



Abstract
Single-case research design is a useful methodology for evaluating the presence of a functional relation between an intervention and the mathematical performance of students with a learning disability. However, a functional relation cannot be established with threats to internal validity of the design. External validity is impacted if researchers do not clearly describe their methods so that others may replicate them. Therefore, single-case researchers must maximize the internal and external validity of their investigations. We provide a commentary on investigations published in Learning Disability Quarterly that implemented a mathematics intervention for students with a mathematics learning disability. We will highlight specific features of single-case designs within the review and provide recommendations for the field.
Single-case research designs have a long, productive history in the field of special education and are suited to establish evidence-based practices for students with disabilities (R. H. Horner et al., 2005; Tawney & Gast, 1984). Single-case research designs are applicable to researchers who aim to test interventions focused on improving the mathematical performance of students with learning disabilities. First, single-case research designs are flexible and allow researchers to tailor interventions to determine which components are functionally related to the mathematical outcome of interest. Second, single-case research designs can be implemented in applied settings without disrupting educational context (cf. randomize control trials assigning students to groups). Third, students with learning disabilities in mathematics comprise approximately 6% to 10% of the school-age population in the United States (Shalev, 2007). This is a small sample of students with heterogeneous cognitive and skill profiles (Lin et al., 2019). Intervention research that focuses exclusively on students with learning disabilities may use single-case research designs to tailor interventions based on students’ needs without worrying about statistical power to detect statistically significant effects. In addition, single-case research designs are a useful methodology to employ after conducting a randomized control trial to address non-responders to initial intervention. Students with learning disabilities may be non-responders to treatment, and by using single-case research designs, researchers may identify which components or intensification elements are functionally related to improved mathematics performance. Finally, single-case research designs focus on the individual student to identify nuanced understanding of how behavior responds to environmental stimuli. This may allow researchers to identify and control for confounding variables that a large-scale randomized control trial would not detect.
The utility of single-case research designs to inform research, practice, and policy is dependent on the internal and external validity of the design. Internal validity refers to the ability of an experiment to rule out alternative explanations (i.e., confounding variables) when making claims regarding a functional relation between an independent and dependent variable. External validity refers to generalizability of results which occurs through replication within single case design. Transparency in reporting experimental characteristics allows others to replicate the study and understand the types of participants, settings, and behaviors to which the findings would be relevant. Two prominent organizations provide guidance for planning and evaluating the internal and external validity of single-case research designs: (a) Council for Exceptional Children’s Standards for Evidence-Based Practices (Cook et al., 2014) and (b) What Works Clearinghouse Standards Handbook, Version 4.1 (What Works Clearinghouse, 2020).
Previous reviews have demonstrated that tools may provide conflicting recommendations due to differences in criteria and indicators included when evaluating the design (Maggin et al., 2014; Ousley et al., 2020; Zimmerman et al., 2018). Thus, for this project we created a coding guide that would allow us to review a host of variables relevant to the internal and external validity of intervention research for students with learning disabilities. The purpose of this manuscript is to systematically review the methodological characteristics of a sample of single-case research designs testing mathematics intervention effects for students with learning disabilities. We aim to provide data on current practices and application of single-case research designs for students with learning disabilities and provide recommendations for the field of mathematics intervention. This will support researchers in continuing lines of research and designing high-quality investigations.
Method
Search Procedure
The focus of this manuscript is to identify trends in methodological characteristics of research using single-case research designs to test effects of mathematics interventions for students with learning disabilities. Given that this article appears in a special issue of Learning Disability Quarterly, we focused the search to articles that appeared in that specific journal. There are other journals with a focus on students with learning disabilities, but the number and type of mathematics intervention articles within Learning Disability Quarterly show aspects of single case design sufficient to describe current practices and application of the design. To be included in the review, studies met following inclusion criteria: (a) use of a single-case research design, (b) test effects of a mathematics intervention, (c) collect a dependent variable measuring mathematics performance, and (d) be published in Learning Disability Quarterly between years 2010 and 2020. To accomplish this goal, we used an existing data set reported in Peltier, Morano, et al. (2020). We briefly provide information on the search procedures. Starting with Volume 33, Issue 1, through Volume 43, Issue 4, of Learning Disability Quarterly, we screened titles and abstracts of all published documents to determine if studies met the inclusion criteria.
Coding
We developed two separate coding guides for the current project. The first coding guide focused on methodological characteristics of the experiment and included 24 variables. The second coding guide focused on graph construction and included four variables.
Study characteristic coding
Participant description
We included the following variables related to participant description: (a) age and grade of participants, (b) gender, (c) ethnicity, (d) disability status, (e) English language proficiency, and (f) socioeconomic status.
Independent variable
We included four variables related to the independent variable. First, we coded the description provided by authors for the independent variable. Second, we coded the role of the interventionist who delivered the intervention. Third, we coded information related to the dosage of the intervention (i.e., number of sessions, length of sessions, number of sessions per week). Last, we coded information related to fidelity of implementation (i.e., percentage of sessions collected and percentage of fidelity reported by authors).
Dependent variable
We included five variables related to the dependent variable. First, we coded the mathematical content that probes intended to measure. Second, we coded how the probes were developed (i.e., researchers, standardized measure). Third, we coded whether maintenance data were collected and how long after the termination of the intervention they were collected. Fourth, we coded whether generalization data were collected. Last, we coded information related to inter-rater reliability or inter-observer agreement for the dependent variable (i.e., percentage of probes collected and percentage agreement).
Design
We included four variables related to the experimental design. First, we coded for the specific design employed by the research team (e.g., multiple-baseline design, alternating treatments design). Second, we coded the number of baseline probes. Third, we coded intervention probes collected per phase. Last, we coded for the specific approach used by the research team to enter cases into intervention (i.e., response-guided, fixed-schedule, randomization).
Evaluation
We included five variables related to evaluation. First, we coded the specific data characteristics reported by authors in their visual analysis of time-series data that led to a determination of a functional relation (e.g., level, trend, variability, level change, immediacy of effect, overlap). Second, we coded for quantitative indices reported to explain magnitude of change (e.g., Tau-U, percentage nonoverlapping data). Last, we coded three variables related to social validity: (a) whose data were collected (i.e., teachers, students), (b) method for collecting data (i.e., interview, questionnaire), and (c) the focus of the social validity procedures (i.e., goals, procedures, outcomes).
Graph construction
We coded two variables that had the potential to alter the visual analysis process used to make decisions about a functional relation: (a) ordinate scaling (i.e., y-axis) and; (b) the data points per x- to y-axis ratio (DPPXYR) (Dart & Radley, 2017; Radley et al., 2018). First, we coded the scale of the y-axis reported on the graph (e.g., 0% to 100%, 0 to 10). Next, we coded the method researchers used to set the y-maximum value (i.e., maximum possible value, maximum observed value for the case, unsure). Finally, we coded two variables related to the proportions of the length of x:y axis. The first was standardized x: y ratio. To compute the standardized x:y, we took a screen shot to measure the height of the y-axis and the length of the x-axis. The pixels of the image were used to divide the y length by x length to obtain 1 unit x: # units y. This allowed us to have a standardized comparison across graphs and be able to compare to recommendations provided by Cooper et al. (2020), between 1.5 and 1.6. The second variable related to x-y proportions was the DPPXYR (Radley et al., 2018). To compute this, we used to standardized x:y value and divided by the number of possible data points to be plotted along the x-axis. For example, if the x-axis included 35 sessions we would divide the standardized x: y value by 35.
Inter-Rater Reliability
To increase inter-rater reliability (IRR) the first and second author met to discuss the variables included on the coding protocol for study characteristics. The second author coded a practice article to determine if consistency across raters was adequate. The second coder then independently coded the 12 remaining articles. Mean IRR by study was 92% (SD = 5.2%; range = 83% to 100%). Mean IRR by variable was 92% (SD = 10.4%; range = 67% to 100%). The following variables had low IRR (a) dosage (9 agreements out of 12 opportunities), (b) # of intervention data points (9 agreements out of 12 opportunities), and (c) approach used to enter cases into intervention (8 agreements out of 12 opportunities). The authors discussed disagreements and consulted the manuscript for final decision.
Results
This targeted review focused on evaluating the methodological characteristics of intervention studies using single-case research designs to test the effects of mathematics interventions for students at risk or identified with a learning disability. We limited our search to Learning Disability Quarterly given the focus of our audience and this special issue. We truncated the search from 2010 to 2020 given advancements made in design and publication of standards. We identified 233 published manuscripts, with 13 (5.58%) meeting our inclusion criteria. Ten different author teams published 13 manuscripts between years 2014 and 2020.
Student Description
The studies include a total of 84 participants. Eleven of 13 studies reported both age and grade level of participants, two studies reported just grade level of participants. Twelve of 13 studies reported gender information for participants. All studies reported ethnicity information for participants. All studies reported information related to participant disability status (i.e., at-risk, disability category); however, they provided varying levels of information on the process used to identify students with the disability category. The studies reported English language status and socioeconomic status (SES) less frequently. For English language status, four studies explicitly stated the inclusion of students identified as English language learners and one study explicitly stated no students were identified as English language learners. The eight remaining studies did not mention English language learner status, which readers may assume means no English language learners participated because it is not explicitly stated. Table 1 shows the participant characteristics across the reviewed studies.
Study Characteristic Coding: Participants.

Note. F = female; M = male; H = Hispanic; W = White; ED = Emotional Disturbance; LD = Learning Disability; OHI = Other Health Impairments; NR = Not Reported; APD = Auditory Processing Disorder; ADHD = Attention-Deficit/Hyperactivity Disorder; FARMs = Free and Reduced-price Meals; AA = African American; MLD = Mathematics Learning Disability; Nat = Native American; SPED = Special Education; Ind = Indonesian; SLD = Specific Learning Disability.
The authors did not explicitly state there were no students included identified as English language learners. bThe authors did not explicitly state FARMs or socioeconomic status of students.
Independent Variable
The 13 experiments implemented a variety of interventions; all 13 provided sufficient detail explaining the essential components embedded in the intervention package. Twelve of 13 studies reported the role of the interventionist (i.e., researcher versus teacher). The authors provided varying levels of detail regarding the experience or content knowledge of the implementor, details that increase external validity of findings. This included information related to the interventionist’s prior experience with the intervention, years of experience teaching children fitting target population, type of teacher certification, and training provided to implement the intervention. Characteristics related to intervention dosage were reported with varying levels of specificity: (a) intervention sessions provided per week, (b) approximate duration of sessions, and (c) number of total sessions. Seven of 13 manuscripts reported the number of sessions provided to participants per week. Twelve of 13 manuscripts reported the approximate duration of intervention sessions; however, direct observation of duration was not collected. Authors of every study included fidelity, reporting percentage of sessions and the mean agreement based on a direct observation checklist. However, not all studies reported that fidelity data were collected across phases with the mean agreement per phase Table 2 summarizes the studies characteristics related to the independent variable.
Study Characteristic Coding: Independent and Dependent Variables.

Note. CAI = Computer Assisted Instruction; T/R = Teacher-Researcher; R = Researcher; T = Teachers; TA= Teacher Assistant; NR = Not Reported; PS = Problem Solving; BL = baseline; Int = Intervention; MN = missing number; QD = quantity discrimination, CRA = concrete-representational-abstract.
No inter-rater reliability was reported but authors did evaluate the parallel form reliability of missing number (0.85) and quantity discrimination (0.87) probes that were administered repeatedly across time.
Dependent Variable
The experimental literature targeted a variety of mathematical concepts: (a) early numeracy, (b) number combinations, (c) computation, (d) rational numbers, (e) word problem solving, and (f) algebra. Eleven of the 13 studies used probes created by the research team as the primary dependent variable. One study did not report how probes were created and one study used a standardized progress monitoring tool (e.g., quantity discrimination and missing number; Clarke & Shinn, 2004). One study used AIMSweb Math Concepts and Applications (NCS Pearson, Inc., 2012) to evaluate generalization of taught skills and one study administered an instrument used in prior research with psychometric evidence provided. Five studies collected generalization data by administering a distal outcome measure. Nine of 13 studies evaluated maintenance of learned skills; two studies collected data from 2 to 8 weeks after the intervention, four studies collected 2 weeks post intervention, one study collected 3 weeks post, one study collected 4 weeks post, and one study did not report the length of time between intervention and maintenance data collection. Twelve of 13 studies collected inter-rater reliability data of scoring probes from 20% of sessions to 100% of sessions. Researchers provided varying levels of specification about percentage of sessions or probes analyzed (i.e., report percentage within phase versus report percentage of all probes). All studies reported IRR as a percentage agreement across raters using a variant of the formula agreements divided by (agreements + disagreements), and multiplied by 100. Table 2 shows the studies’ characteristics related to the dependent variables.
Design
The researchers used a variety of single-case research designs: (a) alternating treatments design (n = 2), (b) multiple-baseline design (across participants n = 1, across groups of participants n = 1), (c) multiple-probe design (across participants n = 5, across groups of participants n = 1), and (d) combination design of multiple-baseline design across participants with changing criterion design (n = 3). Both alternating treatments designs used a randomized process to design intervention sequence with the constraint that no more than two intervention sessions of the same condition would occur. Four experiments used a randomized process to assign participants to tiers of the multiple-baseline design and then used response-guided approach to determine when baseline data were stable enough to introduce the intervention. Three studies operationalized what constituted “stable” baseline. Four experiments used response-guided framework to determine entering cases of the multiple-baseline design into intervention. Three experiments did not provide an operational definition for determining stability nor did they explain their process for determining when to enter cases to intervention. One study did operationalize their determination of stability of baseline data to decide when to enter cases into intervention. One study used a fixed-schedule approach, specifying number of baseline and intervention sessions for each case a priori. Last, one study did not specify their approach in determining when to enter cases into intervention. Although it is not a necessity, both experiments using an alternating treatments design included baseline data, with one collecting five probes and the other three probes. For the remaining experiments using a variant of the multiple-baseline design, seven collected a minimum of five baseline probes for all cases and four experiments had one case with three baseline probes. Table 3 shows the studies’ characteristics related to the designs.
Study Characteristic Coding: Design, Evaluation and, Social Validity.

Note. ATD = Alternating Treatments Design; SMD = Standardized Mean Difference; MBD-G = Multiple Baseline Design across Groups; PND = Percentage of Non-Overlapping Data; Quest = Questionnaire; S = Students; MPD-p = Multiple Probe Design across Participants; NR = Not Reported; PAND = Percentage of All Non-Overlapping Data; T = Teachers; MPD-G = Multiple Probe Design across Groups; MBD-p = Multiple Baseline Design across Participants; CC = Changing Criterion Design; Int = Interview.
Stability of baseline data was not operationalized.
Stability defined as 3 consecutive probes not statistically significant variability with no trend.
On pre- to post-test data, not time-series data.
Evaluation
All 13 studies provided time-series graphs and interpreted results using visual analysis. Researchers provided varying levels of specificity regarding characteristics of the data series in the authors’ interpretation of the presence of a functional relation. In addition, 12 of 13 studies also reported a quantitative metric alongside visual analysis (a) Tau-U (n = 9), (b) percentage of nonoverlapping data (n = 7), (c) percentage of all non-overlapping data (n = 2), and (d) standardized mean difference (n = 1). Ten of 13 studies evaluated social validity of the intervention, with five collecting data from students, two collecting data from teachers, and three collecting data from both teachers and students. Six studies conducted interviews to gather data and four studies used questionnaires. Table 3 shows the characteristics associated with the studies’ evaluation and social validity methods.
Graph Construction
Although there were 13 studies, one collected data with a natural upper bound and without; therefore, there were 14 graphs evaluated for this section. One of the studies reported mean standardized x:y values of graphs between 1.5 and 1.6 (recommendations provided by Cooper et al., 2020). No studies reported mean DPPXYR between 0.14 and 0.16 (recommendations provided by Dart & Radley, 2018). Ten of the graphs were less than DPPXYR = 0.14, which may inflate Type I error for visual analysis and three reported DPPXYR greater than 0.16 which may inflate Type II error for visual analysis. Seven graphs that reported data with a natural upper bound maximum (i.e., percentage accuracy, number of points possible) set the y-maximum at that value, which will reduce Type I error rates. For data without natural upper bound maximum, two of graphs set the maximum y-value slightly above the maximum observed value which aligns with current recommendations. Five graphs set the maximum y-value at the maximum observed value. Table 4 shows the characteristics of the studies’ graph construction.
Study Characteristic Coding: Graph Construction.
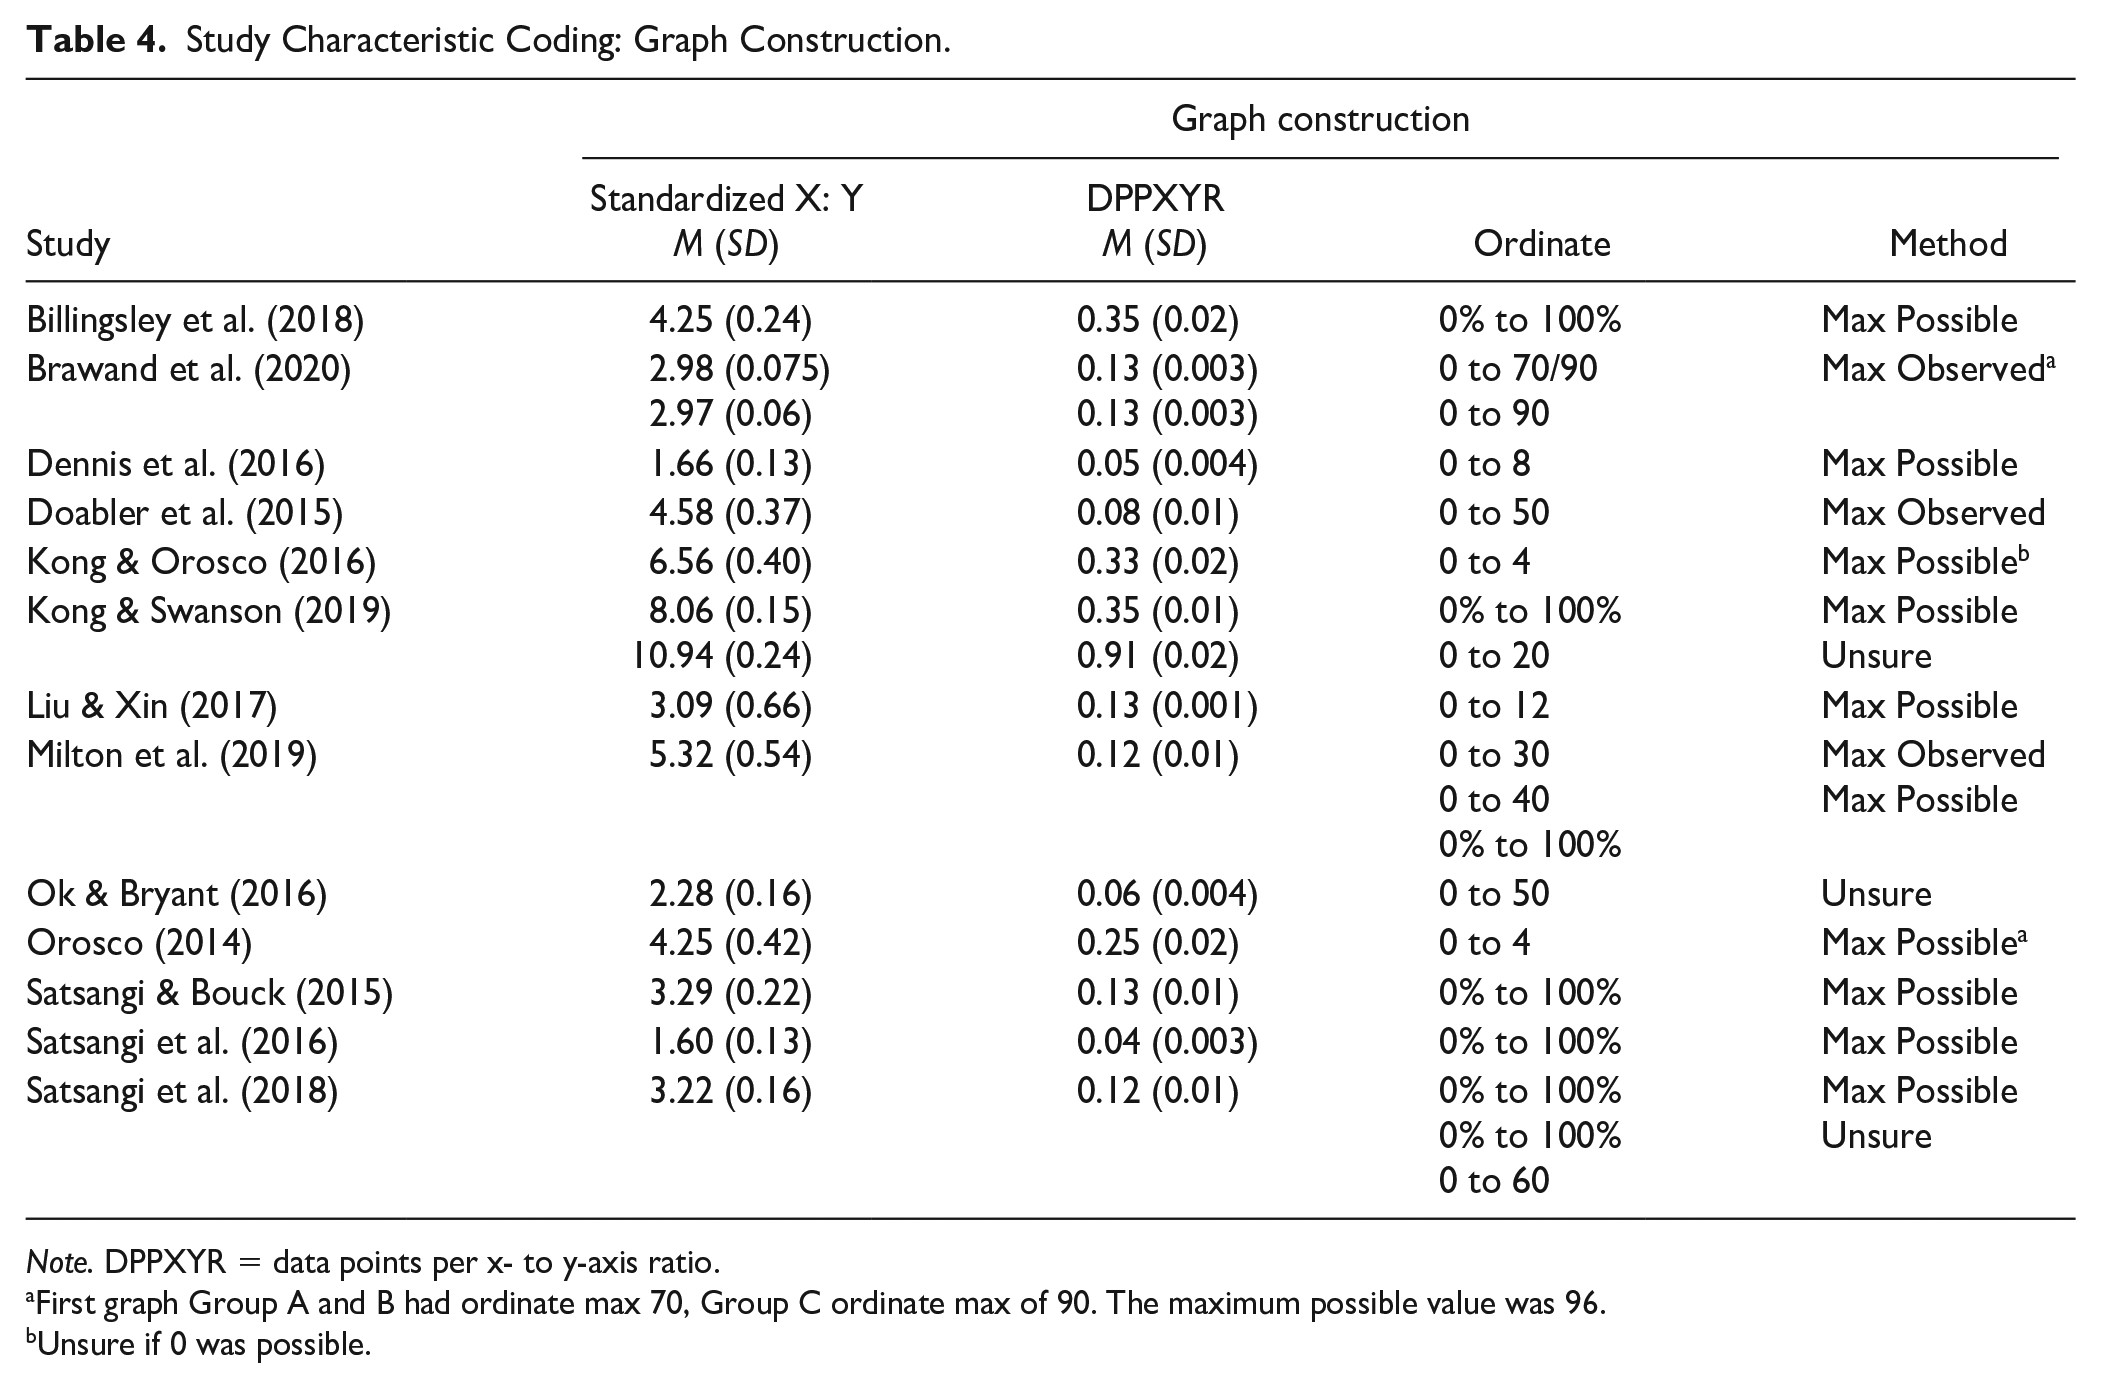
Note. DPPXYR = data points per x- to y-axis ratio.
First graph Group A and B had ordinate max 70, Group C ordinate max of 90. The maximum possible value was 96.
Unsure if 0 was possible.
Discussion
Participants
Rosenberg et al. (1994) set standards for participant description for students with learning disabilities. These include gender, age, race/ethnicity, SES, grade level, intelligence, achievement, level and time associated with special education services, and location. Rosenberg et al. (1994) asked that certain variables be explained such as the determination of SES and determination of special education eligibility. Since single-case research designs focus on individual student performance and response to interventions, it is critical that researchers provide detailed descriptions. All of the studies included descriptions of gender, age, race/ethnicity, grade level, and location. All but four provided SES information, defined as receiving free and reduced lunch, and many of these were reported at the school level. Finding individual information on SES can be problematic given schools’ concerns about students’ confidentiality, but several researchers within the review had access to this information (Doabler et al., 2015; Liu & Xin, 2017; Orosco, 2014; Satsangi & Bouck, 2015; Satsangi et al., 2016). Four studies within the review provided specific definitions associated with student’s disability label or risk for mathematics disability with State criteria (Liu & Xin, 2017; Milton et al., 2019) or accepted definitions in the field (Kong & Orosco, 2016; Kong & Swanson, 2019). Six studies within the review provided students’ general achievement in mathematics using a standardized assessment or an annual State assessment (Billingsley et al., 2018; Brawand et al., 2020; Kong & Orosco, 2016; Kong & Swanson, 2019; Liu & Xin, 2017; Milton et al., 2019). Of these, Liu and Xin (2017) and Milton et al. (2019) provided intelligence quotients and were the only studies that provided all demographic information recommended by Rosenberg et al. (1994). Consumers of research need this information to understand, replicate, and extend research. Since single-case research designs require both direct and systematic replication to generalize findings, researchers need to understand the participants’ background. Being specific about labels is important since “at risk” may be interpreted differently across regions and settings and individual U.S. states have flexibility in their definitions of learning disabilities.
Research Design
The research designs employed in the sample studies included multiple probe design across students or groups, multiple baseline design across students or groups, alternating treatment, and combined designs (e.g., changing criterion and multiple baseline design). These designs allow for demonstration of effects without returning to baseline, the hallmark of the ABAB design (Baer et al., 1968). In most academic intervention research, ABAB designs are not possible because learning cannot be reversed. Five out of the 13 studies used a multiple probe design, an alternative to the multiple baseline design (R. D. Horner & Baer, 1978). Multiple baseline designs may pose problems with extended baseline and intervention phases. For example, within a multiple baseline across students or groups design, individuals in the third phase complete baseline assessments repeatedly as individuals in Phases 1 and 2 reach mastery criterion. In contrast, individuals in Phase 1 continue to complete assessments of mastered content while individuals in Phase 3 continue to mastery. The multiple probe design allows for intermittent probes that show stable baseline and intervention performance without subjecting individuals to assessment fatigue. Also, probing, as opposed to continuous data collection, can limit the threat of testing (Campbell & Stanley, 1963; Christ, 2007).
High Quality Designs
Multiple baseline and multiple probe designs
According to the What Works Clearinghouse Standards Handbook, Version 4.1 (2020), designs that meet standards without reservation have a minimum of six phases with at least five data points per phase. Designs with six phases with at least three data points meet with reservation. The timing of the introduction of intervention must have a degree of concurrence; for example, first introduction of intervention should occur when other students or groups are in baseline, and the same is true for the introduction of intervention for the next student or group.
With respect to multiple probe designs, there are additional requirements for baseline. To meet standards without reservation, initial baseline data collection sessions must overlap, meaning that there must be three consecutive probe points for each case. To meet with reservations, initial baseline data must have one overlapping data point. Second, baseline must end with consecutive data points prior to intervention, three to meet standards without reservation and one to meet with reservation.
Three multiple baseline studies within the review had at least five data points in both baseline and intervention phases (Brawand et al., 2020; Liu & Xin, 2017; Satsangi & Bouck, 2015). The baseline phases in Satsangi and Bouck (2015) appear to be staggered in their onset with successive phases beginning when the previous student completed three baseline assessments. Liu and Xin (2017) did not have extended baseline phases even though the design is labeled as multiple baseline. The other studies within the review that employed multiple baseline designs had some baseline phases with three data points (Kong & Orosco, 2016; Kong & Swanson, 2019; Orosco, 2014), meeting What Works Clearinghouse Standards Handbook, Version 4.1 (2020) with reservation. Four of the five multiple probe designs within the review had at least five data points in baseline and intervention (Dennis et al., 2016; Doabler et al., 2015; Milton et al., 2019; Satsangi et al., 2018). Ok and Bryant (2016) had baseline phases with a range of three to eight data points. Regarding the requirement of overlapping initial baseline data, two studies met the What Works Clearinghouse standards without reservation (Milton et al., 2019; Ok & Bryant, 2016); two studies within the review met with reservation with a range from one to three (Doabler et al., 2015; Satsangi et al., 2018). Doabler et al. (2015) included three consecutive overlapping data points at the end of baseline phases, meeting the What Works Clearinghouse standards without reservation. Three multiple probe studies within the review met the criteria with reservation with ranges from one to two data points just prior to intervention (Milton et al., 2019; Ok & Bryant, 2016; Satsangi et al., 2018).
The variance in meeting the What Works Clearinghouse standards across the multiple baseline and multiple probe designs were in baseline phases. It was not possible to obtain rationale from the authors of studies included in the review; however, an author of this review had experience that led to research design decisions related to baseline. Adolescent students had two and four baseline data points, respectively, ranging from 0% to 17%. Previous experiences with the students had shown that repeated failure led to decreased rapport and refusal to participate. The researcher considered the emotional impact of repeatedly asking adolescents to complete assessments for which they lacked prerequisite skills. To provide benefit to students and conduct the study, the researcher proceeded with intervention. The baseline levels for the studies that did not meet What Works Clearinghouse standards without reservation were also very low. Within the review, for example, Satsangi and Bouck’s (2015) and Liu and Xin’s (2017) studies (without extended baselines) and Milton et al.’s (2019) and Dennis et al.’s (2016) studies each had consistent baseline performances near zero. These authors acknowledge that meeting standards without reservation would strengthen the studies; however, practical considerations may also be part of decision-making.
The studies varied in their reporting of the decision process related to moving students from baseline to intervention. Four researchers assigned the order of students using a randomized process and a response-guided approach for entering cases into intervention. Using randomization reduces the risk of finding effects that are not actually present (Type I error; Kratochwill & Levin, 2014). For example, without randomization, a researcher may choose a student with the most promise for the intervention to receive intervention first and this may expedite changes observed and exaggerate the findings. Most of the studies used a response-guided approach in determining the change from baseline to intervention. Within multiple baseline and multiple probe designs, a response-guided approach has greater advantage to a fixed schedule. Designating a particular level of response to intervention prior to the next student leaving baseline provides the researcher information that can be used to make decisions and adjustments. When using a fixed schedule (e.g., each student begins after the previous student completes two intervention sessions), a lack of response may not be detected as readily. The power of single-case research design is its attention to the individual (Baer et al., 1968), and a response-guided approach provides an additional process focused on each individual student.
Related to the response-guided approach, there was a design issue across studies within this review. Only four provided specific definitions associated with their response-guided approach. For example, when telling readers that students remained in baseline until data were stable, researchers must define stability. Four studies within the review did this, and this increases the internal validity of their studies as well as provides information for others to replicate their methods when attempting to generalize the findings (Milton et al., 2019; Satsangi & Bouck, 2015; Satsangi et al., 2016, 2018).
Alternating treatments designs
The What Works Clearinghouse standards require a minimum of five data points per baseline or intervention phase within an alternating treatments design to meet without reservations. Furthermore, the standards specify the interventions should be provided at random with the constraint that no more than two consecutive sessions of an intervention should be applied. The model design described by Barlow and Hayes (1979) includes a baseline phase, a phase of alternating treatments, and a phase that includes the continuation of the most effective treatment. Satsangi et al. (2016) implemented a baseline phase with five stable data points per student. Next, students engaged in randomly alternating intervention conditions and this phase included at least five data points for each condition and no more than two consecutive sessions per phase, meeting What Works Clearinghouse standards. The final phase, implementation of the best or most preferred intervention, controlled for potential multiple treatment interference (Satsangi et al., 2016). Billingsley el al. (2018) also used an alternating treatment with a baseline condition. There were three data points per condition with no more than two consecutive sessions per phase which did not meet What Works Clearinghouse standards.
Changing criterion designs
The What Works Clearinghouse standards for reversal or withdrawal design apply to this design. Designs that meet standards without reservation have at least three criterion changes and should include at least three data points per phase. Three studies within this review embedded changing criterion into their multiple baseline designs (Kong & Orosco, 2016; Kong & Swanson, 2019; Orosco, 2014). Orosco (2014) showed three changes in criterion level, but the number of data points per criterion ranged from one to two. The other two studies showed three distinct levels of criterion with at least three data points in each (Kong & Orosco, 2016; Kong & Swanson, 2019). According to Kazdin (2013) changing criterion designs show the intervention’s effect by demonstrating that changes in behavior are consistent with the change in the criteria for performance. As the criterion changes (increases or decreases), the graph will show changes in the data points. Given the nature of the interventions and their effects on learning, decreasing the criterion was not possible. Kong and Swanson’s (2019) study did not show marked differences in student performance with each criterion change (e.g., systematic changes to particular level with each criterion change). However, the embedded nature of the designs may have influenced this.
Inter-Assessor Agreement
The What Works Clearinghouse standards requires that more than one observer systematically measure the dependent variable over time. This is defined as the collection of inter-observer agreement (IOA) for 20% of data points in each baseline and intervention phase. All but one of the studies within this review (Doabler et al., 2015) included inter-assessor agreement. These studies met the standards with ranges from 20% to 100% of assessments across phases and students.
Fidelity
According to Cook et al. (2014), high-quality research collects fidelity of implementation data across the study and participants. The studies each included measures of treatment fidelity with percentage of sessions checked ranging from 8% to 40%. Doabler et al. (2015) checked fidelity for five out of 60 sessions and Billingsley et al. (2018) checked 12% of sessions for fidelity of treatment. All other studies within the review met or exceeded recommendations for the field as suggested by R. H. Horner et al. (2005) and had fidelity that ranged from 50% to 100%. In three studies within the review, a teacher or other school practitioner was the interventionist (Doabler et al., 2015; Milton, et al., 2019; Orosco, 2014). Doabler et al. (2015) had fewer fidelity checks than other studies; one instructional group averaged 50% fidelity and the others ranged from 84% to 95%. Milton et al. (2019) and Orosco (2014) had intervention fidelity by practitioners of 100%. One common component of the three studies that included practitioner interventionists was manualized interventions. The other studies within the review included a researcher as the interventionist, and most of the interventions were described as researcher-created (Brawand et al., 2020; Dennis et al., 2016; Kong & Swanson, 2019; Liu & Xin, 2017; Ok & Bryant, 2016; Satsangi & Bouck, 2015; Satsangi et al., 2016, 2018). These may have been less developed interventions and it would be logical that a researcher would implement them as they are refined with replication. As these interventions show promise, researchers should create manuals and professional development procedures so that they can be implemented by others. This type of implementation increases the likelihood that interventions will be useable and effective in practical settings.
Data Collection
Most researchers within the review collected data beyond accuracy or fluency (Brawand et al., 2020; Dennis et al., 2016; Kong & Orosco, 2016; Milton et al., 2019; Ok & Bryant, 2016; Orosco, 2014; Satsangi et al., 2016, 2018). Satsangi et al. (2016, 2018) recorded percentage of prompts needed or the percentage of steps completed independently. The researchers included least-to-most prompting within sessions. The researchers defined student independence as a step completed without a prompt. Similarly, Brawand et al. (2020) observed students’ execution of the processes required within schema-based instruction; the dependent variable of percentage correct included more than the resulting correct answers. Orosco (2014) noted students’ accuracy based on the word problem’s level of complexity. Several researchers within the review collected data on students’ strategy-use (Dennis et al., 2016; Kong & Orosco, 2016; Ok & Bryant, 2016). Milton et al. (2019) collected data on both fluency and accuracy. The notation of both accuracy and fluency may be helpful for researchers and practitioners. We have experience teaching computation to students in which they showed fluency near the accepted norm of 30 correct digits written in 1 min as recommended by Hosp et al. (2016); however, none of the sums or products were correct because the students wrote partially correct sums (e.g., 4 x 8 = 36 or 9 + 4 = 12). Therefore, it may be helpful to note both aspects of students’ computation performance. Milton et al. (2019) and Liu and Xin (2017) captured students’ understanding of the target mathematics concept. Students in Milton et al. (2019) drew and verbally explained their understanding of the target operation and students in Liu and Xin’s (2017) study explained their approach to problem solving. The aforementioned approaches to measuring the effects of mathematics interventions provide different insights into learning. These are consistent with current mathematics standards that emphasize mathematical thinking and approaches to mathematics tasks.
Another method that varied across studies was the timing of assessments. Some researchers collected assessment data within the instructional session, during an independent practice portion of the lesson, or immediately following the lesson (Dennis et al., 2016; Doabler et al., 2015; Kong & Orosco, 2016; Kong & Swanson, 2019; Ok & Bryant, 2016; Satsangi & Bouck, 2015; Satsangi et al., 2016, 2018). This measured students’ acquisition of the lesson immediately following instruction. Other researchers within the review administered assessments prior to instructional lessons (Brawand et al., 2020; Liu & Xin, 2017; Milton et al., 2019). This timing of probe administration assessed students’ retention from lesson to lesson. This is short-term maintenance and most of the studies included maintenance measures for more prolonged period as discussed below.
Researcher-created assessments
Nine of the studies used researcher-created assessments to show effects of the dependent variable. The availability of published assessments that are specific to the dependent variables included in this review is limited and standardized mathematics assessments only provide a small sampling of each concept. Therefore, it is necessary for researchers to create their own, but questions may arise regarding their content validity and reliability. Two studies in this review reported content validity. Liu and Xin (2017) addressed content validity of their measures by reporting that they took items from the school district’s adopted mathematics textbooks. Brawand et al. (2020) had a panel of experts (mathematics teachers) review their items for content validity. There are content validity indices that systematize the process for expert review. Polit et al. (2007) describe an index for item-level content validity. Experts review items for difficulty and relevance and provide a rating 1 to 4 (1 = not relevant, 4 = highly relevant). Researchers calculate the index noting the number of items rated with scores of 3 and 4. The researchers divide the sum of these items by the number of expert reviewers. Index scores from 0.78 to 1.0 indicate satisfactory validity. Two of the studies within the review reported the reliability of their researcher-created probes (Kong & Swanson, 2019; Milton et al., 2019).
Maintenance and generalization
All but three studies within the review included maintenance measures with schedules ranging from 2 to 8 weeks following intervention (Billingsley et al., 2018; Dennis et al., 2016; Doabler et al., 2015). Five studies included measures of generalization or transfer (Dennis et al., 2016; Doabler et al., 2015; Kong & Swanson, 2019; Liu & Xin, 2017; Satsangi & Bouck, 2015). Two of those measures were AIMSWeb curriculum-based assessments, Math Concepts and Applications (Kong & Swanson, 2019), and second grade computation (Dennis et al., 2016). Doabler et al. (2015) used curriculum-based measures with timed assessments in which students identified missing numbers and identified differences between quantities. The assessments used by these three researchers within the review are commonly used in school settings and widely accepted measures of progress, so this justifies their use for generalization. Doabler et al.’s (2015) study was different because the primary dependent variable was a distal measure (i.e., Quantity Discrimination, Missing Number) with strong psychometric properties. This means that following instructional sessions, students completed this measure rather than an assessment of the specific lesson topics. Satsangi and Bouck’s (2015) generalization measure included word problems in which students applied their geometry learning to real life situations. Liu and Xin (2017) also included word problems in their generalization measure. Students solved two-step word problems using their knowledge of one-step problem solving within the intervention.
Visual Analysis
A common critique of visual analysis is the lack of agreement across visual analysts. Vannest and Ninci (2015) found a weighted mean interrater agreement of 0.76 across a variety of design types and analyst experience levels. To systematize the approach and increase the likelihood of agreement, the What Works Clearinghouse Standards Handbook, Version 4.0 (2017) provided a roadmap for this process. Although beyond the scope of this paper, Version 4.1 removed visual analysis from the process. See Maggin et al. (2020) for commentary on that decision. First, baseline and intervention phases are evaluated separately to determine range, level, trend, and variability. Second, between phase comparisons (i.e., baseline to intervention) are conducted to determine the immediacy of effect, level change, change in trend, and change in variability. Last, consistency of similar phases is evaluated (i.e., baseline to baseline and intervention to intervention) by considering level, trend, variability, and range. We evaluated authors’ transparency in reporting visual analysis. All researchers within this review reported level. Billingsley et al. (2018) used terminology associated with visual analysis within definition. Liu and Xin (2017) provided a specific definition of level. Milton et al. (2019) specifically defined the number of probes to criterion and defined stability. Orosco (2014) defined the step-wise criterion for the changing criterion design. The same lead researcher across three studies defined stability as well as the calculation used for trend (Satsangi & Bouck, 2015; Satsangi et al., 2016, 2018).
Graph Construction
Regarding the ratio of the x to y-axis, researchers within this review reported large variability across graphs, both within and across design types; few aligned with recommendations from Cooper et al. (2020) and Kubina et al. (2017). If the x-axis is too long in comparison to the y-axis the data will appear distorted and may increase Type II errors (i.e., claiming no functional relation when one is present or interpreting magnitude of effect as lesser). Whereas, if the x-axis is too short in comparison to the y-axis, the data will appear distorted and may increase Type I errors (i.e., claiming functional relation is present when one is not or interpreting magnitude of treatment effect as greater). However, this was not surprising because Ledford and colleagues (2019) identified that editorial board members in special education preferred ratios that did not align with recommendations and noted the number of data points should be considered.
Radley and colleagues (2018) extended this by proposing the data points per x- to y-axis ratio (DPPXYR) and then demonstrating that graphs falling between 0.14 and 0.16 on the DPPXYR scale were ideal (Radley et al., 2018). The major takeaway is graphs below 0.14 on the DPPXYR scale are likely to lead to overestimates of intervention effects (i.e., Type I error); however, these findings are based on only one study and further replication is warranted.
Creating the graphical display can be challenging given the complexity involved in considering the number of possible data points along the x-axis when considering the length of the x- and y-axis. Another practical challenge may be page limits for publication; a shorter y-axis may allow for all graphs to be presented on one page. Nonetheless, when creating a time-series graph, researchers should consider manipulating the axis lengths to meet recommendations rather than using the default graph produced within the software program. Last, the narrative description and mathematical calculations that accompany graphical displays augment visual analysis. For example, a reader viewing the time-series graph can read the authors’ narrative reporting to identify alignment (e.g., level, trend, variability, immediacy of effect, number of data points to the criterion for mastery, amount of overlap). Therefore, we recommend detailed narrative explanations of the changes in the dependent variable across phases.
Magnitude of Change
Another component of high-quality single-case research is the selection of indices to report the magnitude of change (Cook et al., 2014). Predominantly, non-overlap indices have been used to gage magnitude of change, and this trend was identified in the included studies. Although each index is computed differently, their similarity is reporting the percentage of intervention data improved from baseline data. Tau-U (Parker et al., 2011) was the most common measure across the studies in this review. In addition to Tau-U, researchers calculated the percentage of nonoverlapping data (Scruggs et al., 1987; PND) or the percentage of all nonoverlapping data (Parker et al., 2007; PAND). PND and PAND are simple indices of nonoverlap, but they are limited given their sensitivity to outliers and dependency on phase lengths. Tau-U has become more prevalent because it allows researchers to account for monotonic trend in baseline and, by considering all pairs of data from baseline to intervention, has been shown to be more robust than other non-overlap indices. However, there are limitations to Tau-U, as identified by Tarlow (2017), who consequently proposed baseline corrected Tau. Within this review, Billingsley et al. (2018) used the standard mean difference (Busk & Serlin, 1992; SMD). Using this metric, the researcher calculated the difference between the means in baseline and intervention and divided the difference by the standard deviation of the baseline. According to Olive and Franco (2008), the resulting value is interpreted similarly to metrics used in group designs.
Social Validity
Social validity is a hallmark of single case research design; therefore, high-quality research shows that outcomes provide benefit to participants and other stakeholders (Cook et al., 2014). Baer et al. (1968) explicitly stated that research should be applied, meaning that it is of benefit to individuals and society. All but two researchers within this review (Kong & Swanson, 2019; Liu & Xin, 2017) collected and reported social validity data. Five researchers within this review included social validity as a research question (Doabler et al., 2015; Ok & Bryant, 2016; Satsangi & Bouck, 2015; Satsangi et al., 2016, 2018). Including social validity research questions brings this key component of our field to the forefront and communicates that the researchers value it. Researchers collected social validity data through interviews and surveys with the greatest focus on student and/or teacher preferences regarding intervention features as well as their perception of the intervention’s benefit.
Conclusions and Implications
To conclude, there are additional implications regarding the findings of the review. We provided data on current practices and application of single-case research designs for students with learning disabilities with recommendations to support future high-quality investigations of mathematics interventions. The studies in this review included mathematics content across grade levels that addressed students’ mathematical thinking, problems solving, computation, number sense, algebra, and geometry. They demonstrated key elements of high-quality single case design (Cook et al., 2014; R. H. Horner et al., 2005; What Works Clearning House Standards, 2020) with most studies meeting criteria across standards. The implication for the field is that researchers limited threats to internal validity and provided sufficient descriptions of their work to facilitate replication, supporting external validity. This means that a growing body of interventions with a base of validated evidence will be available to practitioners across a variety of mathematical concepts that students with learning disabilities encounter throughout grade levels.
An area of this review with the most variance was the definition of terms associated with visual analysis; only a few defined trend and stability. Most researchers left the reader responsible for knowing the meaning of level, range, immediacy of effect, and variability. The implications are that individuals seeking to replicate the findings may define these aspects differently and therefore, interpret students’ performance differently. For the field to continue replication and extension of research findings, we must ensure that there is technical clarity in our methods.
All but one study went beyond simple visual analysis and included an additional index for evaluating magnitude of change. The majority relied on indices of magnitude of change that were based on overlap between baseline and intervention. Reliance upon indices of this type may encourage us to focus on immediacy of effect, one aspect of an intervention’s power. As a field, we should attend to multiple components of interventions that benefit students. Given the prevalence of overlap as a measure of magnitude of change, there is an implication for the timing of assessments. Within this review, studies differed with many administering assessments immediately following explicit instruction while others gave assessments at least a day after instruction. The former will likely produce greater magnitude of change since students had immediate access to modeling and guided practice. In practice, teachers likely expect student progress to be evident from lesson to lesson. Therefore, as a field, we may consider which approach to timing of assessment provides practitioners with information that best mirrors instructional conditions. Finally, the hallmark of single case design is the focus on individual students and the provision of benefit (Baer et al., 1968). The studies in this review achieved that with some emphasizing its importance with research questions devoted to social validity. The implications are that our growing knowledge about individualized mathematics interventions address the unique needs of students with learning disabilities.
Footnotes
Declaration of Conflicting Interests
The author(s) declared no potential conflicts of interest with respect to the research, authorship, and/or publication of this article.
Funding
The author(s) received no financial support for the research, authorship, and/or publication of this article.
