




Abstract
Poor nutrition is known to be associated with a number of adverse health outcomes; adequate nutrition is related to a large number of factors, including geographic access to healthy foods. Access to healthy foods can be especially challenging for older people with any kind of transportation or mobility limitations. In addition, some older populations may have reduced access to healthy foods because of the unavailability of food outlets in their neighborhoods. Using the geographic information system (GIS), this study assessed census block level geographic accessibility to healthy and unhealthy food outlets in one county in Ohio. It was found that there was a noticeable disparity in geographic access to food outlets in this older population, depending on which part of the county they live in. These findings have implications for future public health research and policy planning.
Introduction
The positive relationship between good nutrition, as suggested in the Dietary Guideline for Americans (such as nine servings of fruit and vegetables per day, limited consumption of fats; U.S. Department of Health and Human Services & U.S. Department of Agriculture, 2005), and better health has been well established (Cordain et al., 2005; Federal Interagency Forum on Aging-Related Statistics, 2008). Dietary guidelines are based partly on the fact that many specific diseases such as cardiovascular disease, type 2 diabetes, hypertension, osteoporosis, obesity, and certain cancers are linked to poor diet (Campbell & Haslam, 2004; Hu, van Dam, & Liu, 2001; Lichtenstein et al., 2006; Willett & Trichopoulos, 1996). Although food choices and individual dietary patterns are influenced by a complex set of factors, one important source of variability is access to kinds of food (Burns & Inglis, 2007; Larson, Story, & Nelson, 2009). Poorer access to fresh foods is associated with lower consumption of fresh fruits and vegetables (Blanchard & Matthews, 2008; Bodor, Rose, Farley, Swalm, & Scott, 2008; Morland, Wing, & Diez-Roux, 2002). Perceptions of greater availability of fresh food available at supermarkets in one’s neighborhood are associated with adopting a recommended healthy diet (Moore, Diez-Roux, Nettleton, & Jacobs, 2008; U.S. Department of Health and Human Services & U.S. Department of Agriculture, 2005). Thus, neighborhood food environment (including geographic access to healthy and unhealthy foods) is an important structural influence on the food choices available to individuals and their actual nutrition intake (Cheadle et al., 1991; Glanz, Basil, Maibach, Goldberg, & Snyder, 1998; Morland, Diez-Roux, & Wing, 2006).
Older Americans may be more disadvantaged than other groups with respect to food access due to overall mobility and other limitations (Burns & Inglis, 2007; Iezzoni, McCarthy, Davis, & Siebens, 2001), including difficulties with walking, taking a bus, and carrying heavy groceries (Algert, Agrawal, & Lewis, 2006). Giving up driving due to physical and/or financial limitations becomes more common in old age (National Highway Traffic Safety Administration, 2007). For those who give up driving, access to private transportation may be affected by living alone; approximately, 19% of male and 39% of female population aged 65 years and older live alone in the United States (Federal Interagency Forum on Aging-Related Statistics, 2008). For those individuals who live alone and give up driving, access to private transportation is likely to be limited because of the need to make arrangements with, and depend on, a person (or service) outside the household. In many communities, nonmedical transportation is not readily available as a service for older people. In addition, older adults are more likely than other age groups to live in rural areas, where public transportation is much less likely to be provided (Rogers, 2002). The unavailability of private vehicles and public transportation can negatively affect older people’s access to a variety of healthy food choices (such as greater number of and higher quality of vegetables and fruits, whole grains, and healthful convenience foods) at reasonable prices and can also add transportation costs related to grocery shopping (Bawa & Ghosh, 1999; Beaulac, Kristjansson, & Cummins, 2009; Bolen & Hecht, 2003). Given age-related physical decline and lack of ability to drive or to access transportation, older people may experience “deprivation amplification”—added disadvantages due to undesirable community environment (Macintyre, 2007). Older adults with limited mobility are already disadvantaged if they must travel long distances to shop for healthy food; they may face additional difficulties accessing to healthy foods if they live in a community where there is no transportation service available and/or no healthy food markets.
Poorer food access is also more problematic in its consequences for older people because of unique nutrition needs in later life, such as need for more vitamin D, vitamin B12, and calcium but less calorie intake than the younger population (Lichtenstein, Rasmussen, Yu, Epstein, & Russell, 2008; U.S. Department of Health and Human Services & U.S. Department of Agriculture, 2005). Considering the older population is estimated to be 73.5 million or 20% of the total U.S. population by 2030 (Federal Interagency Forum on Aging-Related Statistics, 2008), older people’s access to healthy foods is an ongoing and increasing public health concern. Thus, it is important to investigate the relationship between age and access to food options that can hinder or promote healthier food intake, and ultimately better health. Existing literature has established various sets of links between nutrition and health, between access to healthy food and food choices, between healthy food choices and nutritional status, and between age and access to foods. Previous literature has also suggested that older age may amplify the impact of neighborhood factors and may moderate the effects of nutrition intake on health (Michael & Yen, 2009; Wilson, Alexander, & Lumbers, 2004; Wylie, Copeman, & Kirk, 1999). In addition, there are clearly complex structural, psychological, behavioral, cultural, and biological processes that affect these linkages, and there may be multiple pathways through which any single or set of factors could affect health outcomes. Although elaboration of a full conceptual model of food choices and health outcomes is beyond the scope of this article, a general depiction of these processes is useful.
Figure 1 provides that broad overview; the portion of the model that is directly addressed in this article is bounded by the dotted lines: the ecological-level linkages between age and geographic access to foods and, by extension, the link between age and availability of healthy food options. This set of interconnections has not been fully investigated in previous research, especially at the ecological level. The model notes two distinct components of access which have been identified in the literature: geographic and economic (McKie, 1999). Economic access is a combination of price of foods and lower income status that may be a barrier to purchase foods (Donkin, Dowler, Stevenson, & Turner, 2000). People with low income may not be able to make certain food choices due to higher prices of those items, notably fresh products. A further complication in the economic accessibility of food is that the cost of healthy foods might be higher in the kind of food outlet that is more common in low-income areas. Economic and geographic access can be interrelated when affordable healthy foods are not available within a reasonable distance or accessible through reasonable means of travel to grocery shopping (e.g., private vehicle; Bawa & Ghosh, 1999; Mikkelsen, Chehimi, & Robert Wood Johnson Foundation, 2007). For older adults, both geographical and economic factors might play a role in meal planning, shopping, and food choices (McKie, 1999).

A conceptual model of the link between age, food access, and health outcomes
Although it is important to acknowledge these possible interrelationships, this article focuses on geographic accessibility to healthy and unhealthy foods as related to density of older populations. Geographic access or physical access is generally based on physical distance and travel time to food stores (Algert et al., 2006; Apparicio, Cloutier, & Shearmur, 2007; Blanchard & Matthews, 2008; Bodor et al., 2008; Pearce, Witten, Hiscock, & Blakely, 2007). Physical distance is the most commonly used measurement method in the previous literature, although there are some exceptions (see Method section and Table 1). For instance, several studies used density of food stores within defined areas as the measure of geographical access to food (e.g., Moore et al., 2008). It should be noted that distance through road network instead of straight distance to food stores is a reasonable measurement as it would reflect actual travel time more precisely (Pearce et al., 2007).
The Examples of Geographical Accessibility Measurement in Past Studies

Geometric center.
The green availability index is based on the number of different types of fruits and vegetables in each of the fresh, frozen, canned, and juice categories recorded in data collection (Donkin et al., 2000).
Meshblock comprises the smallest unit of census data in the New Zealand Census (Pearce et al., 2007).
dij = |xi – xj| + |yi – yj|, where dij is the distance between i and j, x is latitude coordinates of origin i, and y is longitude coordinates of destination j.
All grocery shops surveyed by the local governments of the study areas.
These definitions of food access are conceptually interrelated. Some progress has been made in tying some of these ideas together with the concept of “food deserts,” which describe the geographic patterning of compounded inequality in food access. Food deserts have been linked to the emergence of out-of-town supermarkets where only individuals who can afford to own private vehicle or pay for public transportation can purchase a variety of healthy foods at reasonable prices; this pattern was identified in the early 1990s in the United Kingdom (Acheson, 1998). More recently, food deserts were defined as “an area where residents have limited access to supermarkets and supercenter stores” in the United States (Blanchard & Matthews, 2008). Although the link between residing in a food desert, socioeconomic status, and individual-level access to food has not been consistently established, according to a recent systematic literature review, “food deserts” exist in the United States and are of concern because of their role in increasing health inequality through deprivation amplification; minorities and people who are poor are more likely to reside in food deserts (Beaulac et al., 2009; Economic Research Service, 2009). This article builds on the idea that geographic access to healthy and unhealthy foods is patterned by sociodemograhic characteristics and that age is a significant factor to consider in the food access–food choice–nutritional status–health outcome chain.
Even though progress has been made in identifying the geographic and economic dimensions of access to food, little is known about geographical accessibility to foods among the older population. Using well-established dietary guidelines, health care professionals, and health educators can encourage older adults to follow a recommended diet. Yet individuals may not be able to maintain healthy diets or make positive changes in their diets without good access to healthy foods (Baker, Schootman, Barnidge, & Kelly, 2006; Coveney & O’Dwyer, 2009; Morland, Wing, Diez-Roux, & Poole, 2002). Particularly because of possible disadvantages such as decline in physical function and limited availability of transportation, geographic access to healthy food is crucial to older people’s ability to fulfill unique nutrition needs in later life.
This research assesses food access for the older population by examining the link between the community-dwelling aged population in a particular geographic area (in this study, a census block group) and geographic access (travel time) to healthy and unhealthy food outlets from their residences in that area. This aggregate level of analysis will identify areas that are disadvantaged in terms of healthy food access. The study addresses four specific questions:
How is density of the older population associated with the location of healthy and unhealthy food outlets?
What are the service areas (defined below) for healthy and unhealthy food outlets?
What is the average travel time to the closest healthy and unhealthy food outlets within a given census centroid (defined below)?
Using mapping techniques and analyses and linking them back to the distribution of the older population, can we identify “at-risk” areas in which food access is particularly poor for older people?
Findings are relevant to the planning and delivery of services for older people living in low-access areas; the measures and analytic methods are relevant to future research on the relationships between socioeconomic status and food access.
Method
This article uses geographic information system (GIS) to analyze the pattern and relationships described in the research questions above; this technique yields a structural-level understanding of the patterning of geographic access and age distribution with geographic units.
Using GIS to Measure Food Access
The GIS is “a computer-based system for integrating and analyzing geographic data” (Cromley & McLafferty, 2002) which can be used to view, quantify, and analyze information within a geographical context (e.g., spatial patterns; Vine, Degnan, & Hanchette, 1997). One measure of food accessibility—access to food stores—has been used in several past studies using GIS (Algert et al., 2006; Apparicio et al., 2007; Blanchard & Matthews, 2008; Burns & Inglis, 2007; Donkin et al., 2000; Jeffery, Baxter, McGuire, & Linde, 2006; Pearce et al., 2007). As shown in Table 1, the conceptualization and measurement of food access varies according to target food stores (supermarkets, fast food restaurant), departure place (individual residence, census tract centroid), mode of transportation (walk, car, bus), and characteristics of study area (urban, rural, and country).
From a methodological point of view, it must be noted that the measurement of spatial accessibility to food outlets is affected by the modifiable areal unit problems (MAUP), which refers to potentially different spatial analysis results and misleading interpretations about the spatial data depending on the choice of geographic unit (e.g., census tract, county, state; Beyer, Schultz, & Rushton, 2008). Oftentimes, MAUP is discussed in the context of an ecological fallacy—the incorrect inference to individual-level relationships based on findings from group-level data (e.g., aggregate data for cities; Waller & Gotway, 2004). It is suggested that the MAUP should be dealt with in any spatial analysis by carefully selecting appropriate areal units or using methods that are robust to the MAUP (Openshaw, 1996). For example, Clarke, Eyre, and Guy (2002) applied the spatial interaction model that takes relevant factors such as average food expenditure by household types, attractiveness of food outlets, and area-level data including level of consumer expenditure in addition to the distance to the closest supermarket. Likewise, Smoyer-Tomic, Spence, and Amrhein (2006) measured the population-weighted minimum distance and coverage areas to supermarkets in Canada to handle the MAUP.
Location Studied and Unit of Analysis
This study focused on Hamilton County, Ohio, with a population of 842,369 in 2006 (U.S. Census Bureau, 2007). The largest city in the county is Cincinnati, the third largest city in the state of Ohio, with a population of 842,369. Ohio had the sixth largest older population (N = 1,507,757) in 2000 and is one of nine states with greater than 1 million older adults in the United States (He, Sengupta, Velkoff, & Debarros, 2005).
Hamilton County was chosen for two reasons. First, the proportion of older population (13.4%) is comparable with the national average of 14.5% (He et al., 2005). It could reasonably represent typical geographical areas in terms of older population in the United States. Second, despite the capability of GIS, focusing on large geographical areas may lose within-area variability of access to foods. Hamilton County is a reasonable study area as it has a balanced mixture of urban and rural areas with approximately national average proportions of older population. The unit of analysis in this study is the census block group, which is a subdivision of census tract and contains approximately 1,500 persons (U.S. Census Bureau, 2005). Census block group was chosen because it is the most reasonable representation of community/neighborhood environment available from the U.S. Census data which also can assure sufficient individual privacy (Diez-Roux et al., 1999). This unit of analysis assures privacy but does have a disadvantage in that within-block group variability (e.g., size, population) is not captured (Krieger, 1992).
Measures and Data Sources
To explore the links among aging populations and geographic access to food, this research uses two central concepts: food access to healthy and unhealthy food outlets as indicated by various measures of distance and numbers of older people in a census centroid, which is a point located at the geographical center of census unit (e.g., census tract, census block). Food access is measured in terms of travel distance and travel time to food outlets, and service area for healthy and unhealthy food outlets. Although access to healthy food is crucial for nutrition, unhealthy food outlets (e.g., fast food restaurant) are also important because of their possible negative influence on individual dietary habits (e.g., Larson et al., 2009). More than 20% of older adults use fast food restaurants at least occasionally (at least once a week) if not more frequently (Bowman & Vinyard, 2004; Paeratakul, Ferdinand, Champagne, Ryan, & Bray, 2003). As making an unhealthy food choice presumably has a negative effect on the likelihood of making a healthy food choice (and vice versa), it is important to consider the availability of both options in a given geographic area. Details of the measures, and the data sources used to calculate the measures, are described here.
Healthy and Unhealthy Food Outlets
To classify healthy and unhealthy food outlets, we used the definition from the study conducted by the California Center for Public Health Advocacy (CCPHA, 2007). Healthy food outlets include supermarkets, supercenters, and produce vendors, based on the assumption that these locations would have a wide variety of higher quality healthy foods, including fresh fruits and vegetables at lower prices; in contrast, unhealthy food outlets include fast food restaurants and convenience stores where more foods with higher calorie and less fresh products, if not little, are provided at higher prices (Economic Research Service, 2009; Horowitz, Colson, Hebert, & Lancaster, 2004). Considering the CCPHA study’s definition for each type of food outlets and available data in this study, we intended to make a comparative community-level food access assessment and used the following definitions:
Supermarket—National franchise, regional franchise, and individually owned grocery stores with annual sales of at least US$1 million. The examples were Walmart Supercenter, Meijar, Kroger, and others. A criterion of at least US$1 million of annual sales was used in this study to be comparable with other community-based food access assessment such as the CCPHA project, and to address a problem with too few supermarkets with annual sales of US$2 million in the Hamilton County, although annual sales of at least US$2 million and/or other measures (e.g., floor space) are the more commonly used criterion in the past studies (Food Marketing Institute, 2008).
Produce vendors—Retail outlets whose primary function is to sell produce (vegetable and fruits). The mobile stands or roadside stands were excluded in this study because they are classified in “Agriculture” instead of “Food Stores” (U.S. Census Bureau, 2007).
Fast food restaurants—National, regional, and local franchise restaurants. Restaurants (both franchise and nonfranchise restaurants) with more than three locations with the same name in the Hamilton County were included in this category. The examples of major franchise restaurants were McDonald’s, Burger King, Wendy’s, White Castle, and so on.
Convenience stores—Retail stores with a primary function to sell consumable products that are predominantly foods, or foods plus gasoline services, at convenient locations.
Food access. Two distance-based measures of food access were calculated for this study: average travel time to a food outlet and service area for food outlets. Travel time is the amount of time it would take to walk to a food outlet, given the road networks between the outlet and the population-weighted census block group centroid, which is the balance point of the polygon (census block group) formed by its boundaries with considerations of population distributions within the polygon (Donkin et al., 2000; Hwang & Rollow, 2000). An assessment based on walk-based travel time is a useful approach to reflect the importance of transportation service and older adults’ independence in communities because “unable to walk to a supermarket” determines the necessity of other travel means. Service area combines travel time with mapping techniques; service area shows the geographic area that fall within a specified distance radius of a food outlet. Simultaneous mapping of the service areas results in a determination of what proportion of census centroids fall within certain travel times from healthy and unhealthy food outlets and within the service area of those outlets. We used three different travel distances/times to calculate service areas: 800-m or 16-min walking time; 1,600-m or 32-min walking time; and 3,200-m or 64-min walking time. The 800-m/16-min walking service area is considered to be “accessible,” allowing a calculation of what proportion of the population-weighted census block group centroid are within easy access of healthy or unhealthy food outlets. As points of comparison, all three levels of service area were calculated for both healthy food outlets and unhealthy food outlets.
Data Sources
The data were derived from multiple sources. The map data that are Topologically Integrated Geographic Encoding and Referencing system (TIGER) line data were obtained from the U.S. Census Bureau’s website (U.S. Census Bureau, 2008). For the basic demographic information, the U.S. Census 2000 Summary File 3 (SF3) was obtained from the U.S. Census Bureau’s website (U.S. Census Bureau, 2007). The lists of all registered food manufacturers and food outlets were obtained from the Hamilton County Health Department (N = 2,541) and city of Cincinnati Health Department (N = 2,214). These two separate data sources on food outlets were necessary because, although Cincinnati is located in Hamilton County, food outlets in this area are governed by the city health department. Any food outlet in Ohio is legally required to register to their local/state government to obtain business licenses/permits (The State of Ohio, 2010). For additional information and to verify types of food outlets, we referred to Google Maps (Google Inc., 2009), a website Manta.com that provides free profiles covering large companies worldwide (EC Next, 2009), and each food outlet’s website when available. According to the EC Next, the information regarding companies is gathered from multiple sources including public financial and trade resources; public records (e.g., business registration, government registries); and reports from the company. We assumed that the publicly available information is correct.
Data Preparation
All of the map data were aggregated using the GIS software ArcMap 9.3 (ESRI, Inc., Redlands, CA). Then, the census block group map data were combined with Census 2000 SF3 file to get demographic information. As a representative location of older (age 65 and older) people’s residences, the population-weighted census block group centroid was used.
Food outlets were categorized according to the procedure described in the Measures section above. Those that did not match any of the definitions were excluded from the analyses. For example, food outlets such as butcher shops, bakeries, ice cream stores (except major chain stores with more than five locations in the United States), book stores with meal service, adult daycare centers, school cafeterias, snack stands of professional sport fields, bars, seafood markets, coffee houses, confectioners, and theaters were excluded.
The classified food outlets were geocoded (plotted on the map) to 2000 U.S. census block group. Approximately, 21% of the food outlet locations did not initially match due to changes in zip codes and streets names. We referred to the latest address for each unmatched location and corrected any information when needed. When Census TIGER line roads data did not have certain streets, the closest available location was used.
Analysis
There were four steps in the analysis plan for this study. For the first research question, overlay analyses were done by combining the map layer showing the distribution of older populations and the map layer showing the locations of healthy/unhealthy food outlets. The outcomes of overlay analyses were visually examined. For the second research question, with the ArcMap network analyst extension, healthy/unhealthy food outlet service areas were computed and visualized. We defined services area as 800-, 1,600-, 3,200-m distance using road network from each food outlet and created a walking time for each distance, based on a suggested walking speed 3,000 m/hr (Burns & Inglis, 2007). For example, for someone who lives in the 1,600-m service area of a supermarket, it is necessary to walk approximately 32 min with the assumption of walking speed described above. For the third research question based on the road network analysis, the distance (travel time) from each population-weighted census block centorid to the closest healthy/unhealthy food outlet was computed for descriptive statistics of mean, minimum, and maximum distance, and for data visualization. Also, bivariate analyses were conducted to examine the differences between accessibility to healthy and unhealthy food outlets.
For the fourth research question, we used Getis-Ord Gi* statistics to identify clusters of census block groups with greater/less travel time to healthy/unhealthy food outlets (Mitchell, 2005). We chose Getis-Ord Gi* statistics over other commonly used statistical methods such as local Moran’s I to examine the degree of geographical association in a variable’s distribution for two reasons (Anselin, 1995; Parker & Asencio, 2008). Getis-Ord Gi* identifies clusters of high values (hot spots) and low values (cold spots) unlike other methods quantifying the similarity of values whether high or low. For the purpose of this study, it is crucial to explore both “good” and “poor” accessibility, or greater and less travel time, to food outlets to detect inequality of food access among the older population. In addition, given the concept of food deserts, hot spots or areas where older people need to travel greater amount of time to purchase healthy foods can be visually examined with the outputs of hot spot analysis. Getis-Ord Gi* is computed as follows.
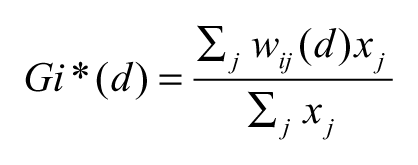
where d is the distance to the closest healthy/unhealthy food outlet from the population-weighted census block group centorid for census block group j and wij is the spatial weight for the values (travel time; x) of the target neighbor pair of census block groups (i and j). We chose 3,200 m for the search threshold which determines “neighbors” of a census block group based on proximity to reflect the results of service area analysis. More details of Gi* statistics is provided elsewhere (Getis & Ord, 1996). Z scores were computed for statistical significance test. A high z score indicates its neighbors have greater travel time, and vice versa. A z score of 0 indicates no concentration of areas with greater/less travel time to food outlets.
Last, to examine average travel time to the nearest healthy/unhealthy food outlet for each census block group, simple density analyses were conducted with the ArcMap spatial analyst. Then, three-dimensional models demonstrating the association between the distribution of older population and the travel time to the nearest healthy/unhealthy food outlets within the Hamilton County were created with the ArcScene 9.3 (ESRI, Inc., Redlands, CA) to visually examine the distribution of older populations and food access simultaneously. All statistical analyses were done with ArcMap 9.3 and R 2.1 (R Development Core Team, 2005).
Results
We identified 85 healthy food outlets and 957 unhealthy food outlets according to the criteria described above. There were 736 census block groups with older residents (mean population = 154, SD = 116.15) in Hamilton County, Ohio. Table 2 shows the summary statistics for key variables of interests. For bivariate analyses, we used the Wilcoxon signed rank test to compare the travel distance with healthy and unhealthy food outlets as these variables were not normally distributed. The Wilcoxon signed rank test is a nonparametric statistical test to examine locations of the median, given the distribution of the two variables; therefore, the requirement for the distribution is absent (Ott & Longnecker, 2008). For the proportion of census block group within/not within three different service areas, chi-square test was used. The road network distance (travel time) to healthy food outlets was significantly greater than that of unhealthy food outlets (p < .001). Also, the area coverage of unhealthy food outlets (service area) was significantly greater than that of healthy food outlet at 800-, 1,600-, and 3,200-m range (p < .001).
Summary Statistics for Distance (Travel Time) to Healthy/Unhealthy Food Outlets and Proportion of Census Block Group Centroids Within the Service Area (800, 1,600, 3,200 m)
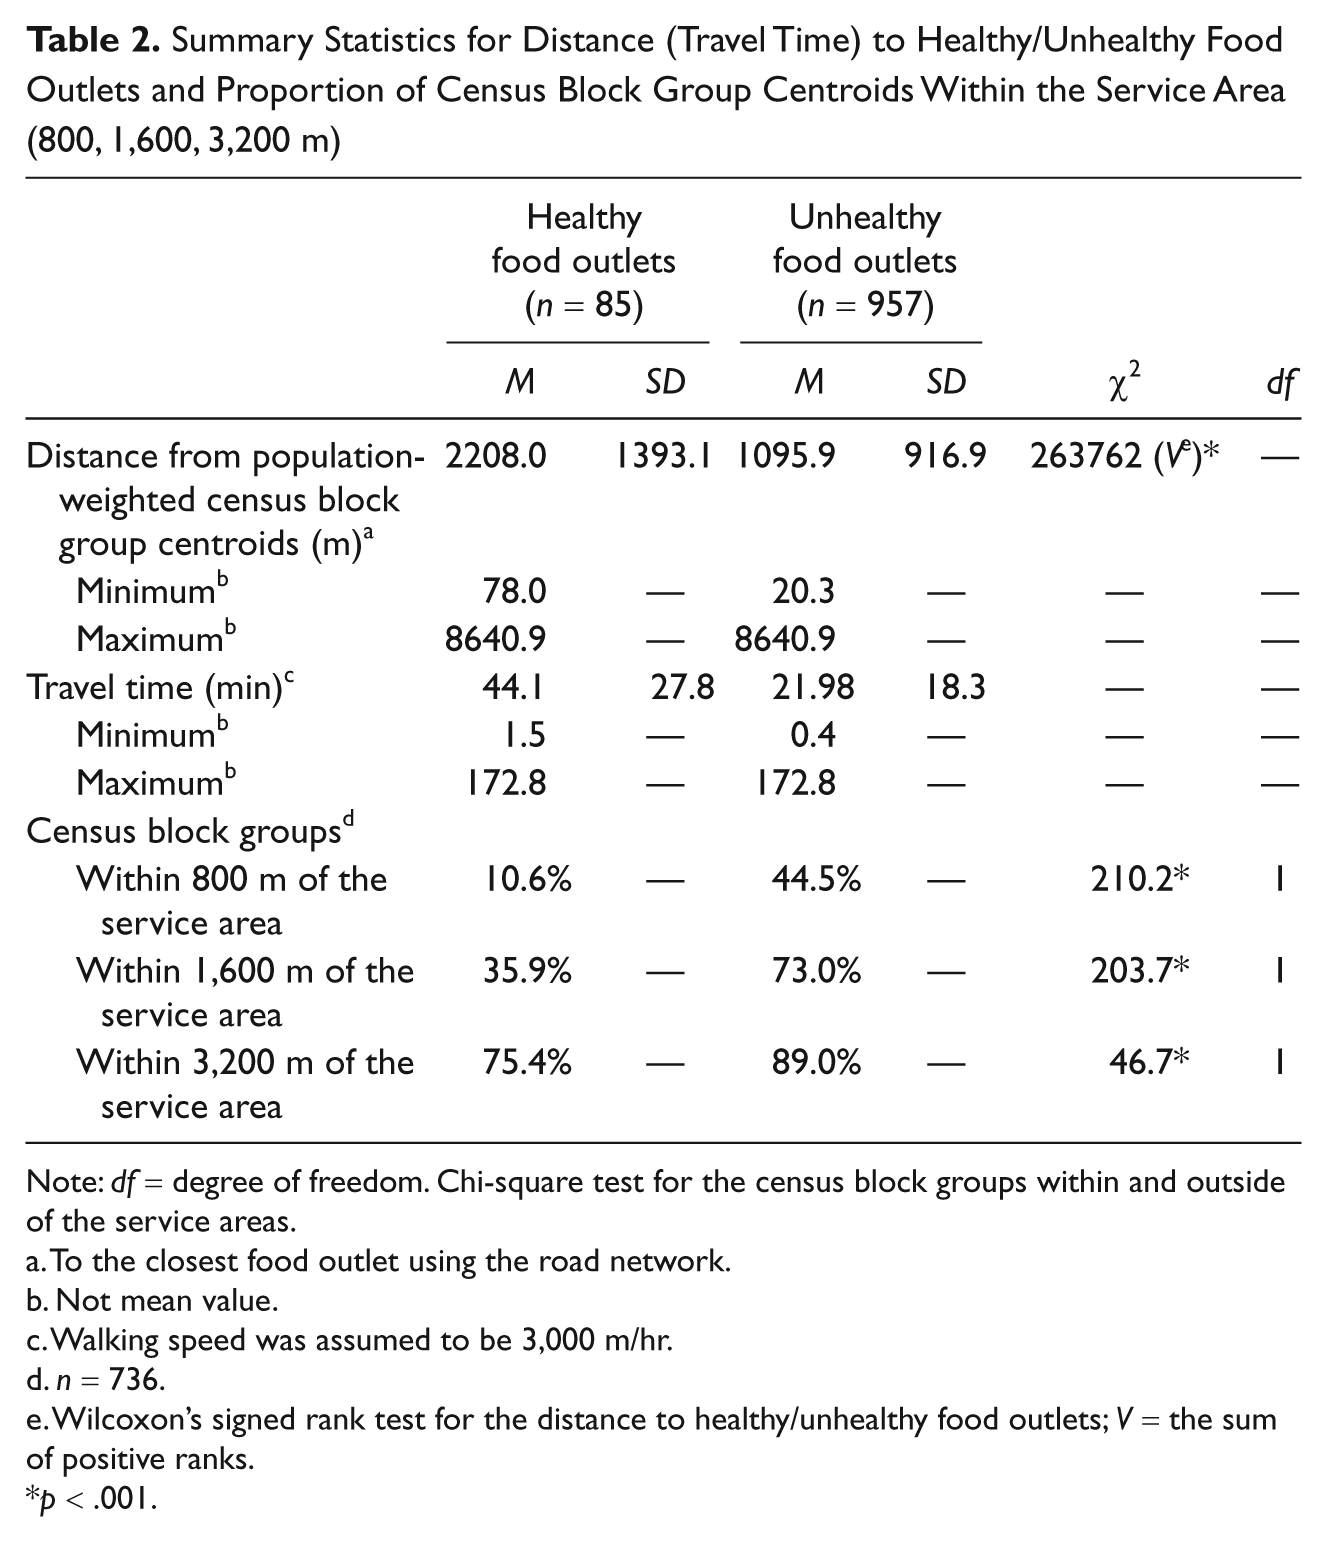
Note: df = degree of freedom. Chi-square test for the census block groups within and outside of the service areas.
To the closest food outlet using the road network.
Not mean value.
Walking speed was assumed to be 3,000 m/hr.
n = 736.
Wilcoxon’s signed rank test for the distance to healthy/unhealthy food outlets; V = the sum of positive ranks.
p < .001.
Figure 2 shows the distribution of older population and food outlets and overlay maps of these two. The older population was moderately concentrated in the city center and immediately adjacent areas of the county, whereas fewer older people were observed in areas around north, west, and east side of the county borders. The overall distribution of healthy food outlets is fairly random, but the west part of the county showed fewer healthy food outlets than other areas of the county. There was a clear concentration of unhealthy food outlets around the central south part of the county (the city of Cincinnati) and the rest of them are spread widely. However, similar to the healthy food outlets, there were fewer unhealthy food outlets in west side of the county, suggesting lower levels of access to both kinds of food outlets in that area. Most importantly, for the research question under examination in this study, the overlay analyses demonstrated that the distributions of healthy food outlets and older population did not overlap—older people were concentrated in areas other than those with high density of healthy food outlets. This pattern is in contrast to that observed for the unhealthy food outlets.

Population 65 years and older, and healthy/unhealthy food outlets, Hamilton County, Ohio
Figure 3 shows the service areas (800-, 1,600-, 3,200-m range or 16-, 32-, 64-min travel time, respectively) of food outlets. As noted above, the service area provides a visual display of the geographic area that falls within a certain range of a food outlet. In comparison with the healthy food outlets, the service areas of unhealthy food outlets cover larger areas of the Hamilton County. Notably, unhealthy food outlet service areas of 800 m were observed primarily in the most central part of the county. The extent of coverage of respective service areas is summarized in Table 2. Approximately, 90% of the population-weighted census block group centroids were outside of the 800-m or 16-min travel ranges of healthy food outlets. This finding is very significant, suggesting that the majority of the population does not live within easy walking access of healthy food outlets. Furthermore, about 25% of the population-weighted census block group centroids were outside of 3,200-m or 64-min travel time ranges of healthy foods, whereas only 11% of them were outside of an unhealthy food outlet service area. Thus, at least nearly one quarter of the older population presumably requires transportation other than walking to get to a healthy food outlet, but only 11% have to travel this distance to get to an unhealthy food outlet. The results of chi-square test supported these findings as a higher proportion of population-weighted census block group centroids were covered by unhealthy food outlet service areas compared with those covered by a healthy food outlet at all three levels of service areas.
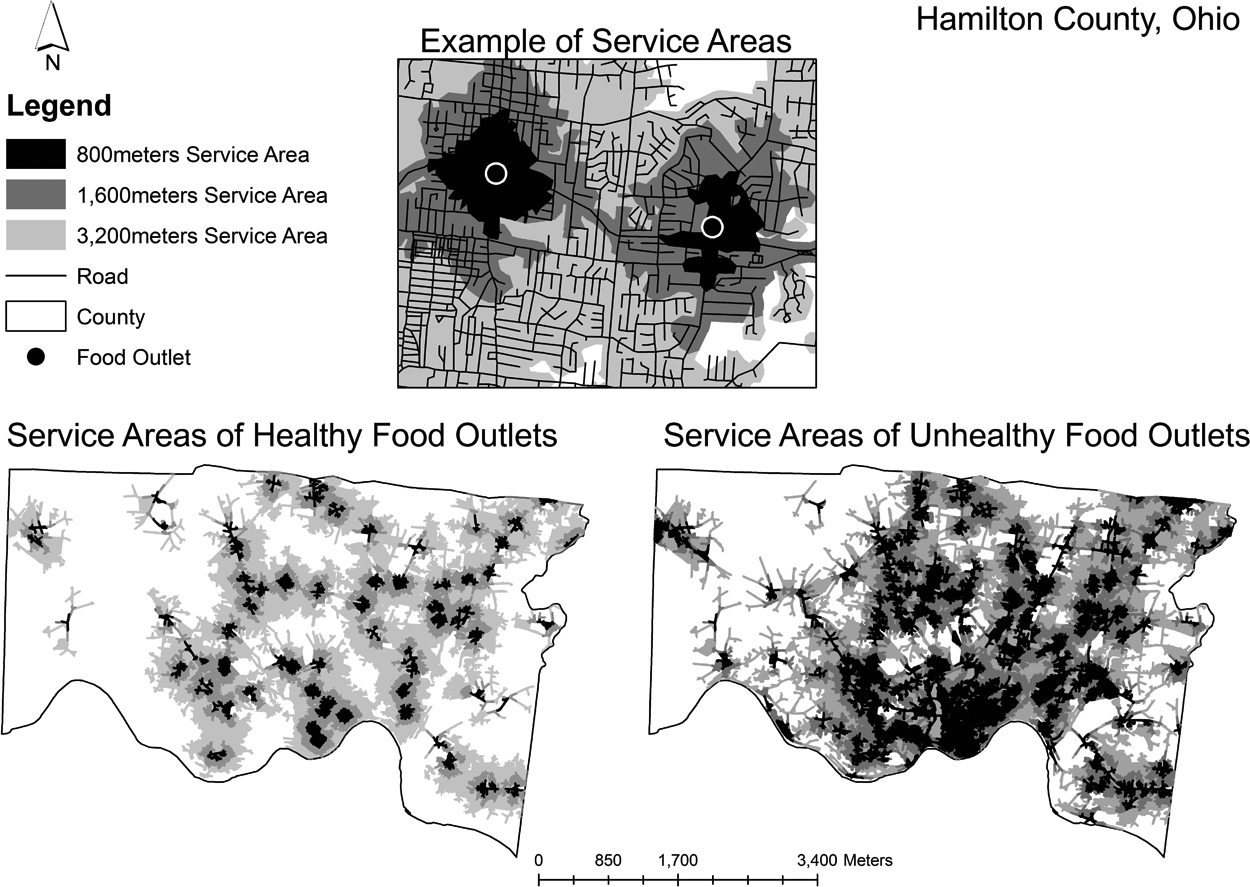
The service areas of healthy/unhealthy food outlets, Hamilton County, Ohio
In Figure 4, it was visually observable that west part of Hamilton County was likely to have greater travel time (poorer accessibility) both to the nearest healthy and unhealthy food outlets. However, the central south part of the county had less travel time or better accessibility to both types of food outlets. The pattern seemed to be stronger for the unhealthy food outlets. These findings were supported by hot/cold spots analyses (Getis-Ord Gi* statistics). There were clusters of census block groups where the older population had poorer geographical access to both healthy and unhealthy food outlets. The results of z test showed that most of these identified hot and cold spots were statistically significant at α = .99 level (z score > 1.65 or <–1.65; >1.96 or <–1.96; >2.58 or <–2.58 = p < .1, p < .05, p < .01, respectively). There was significant inequality not only in access to healthy food but also in access to unhealthy foods among the older population.
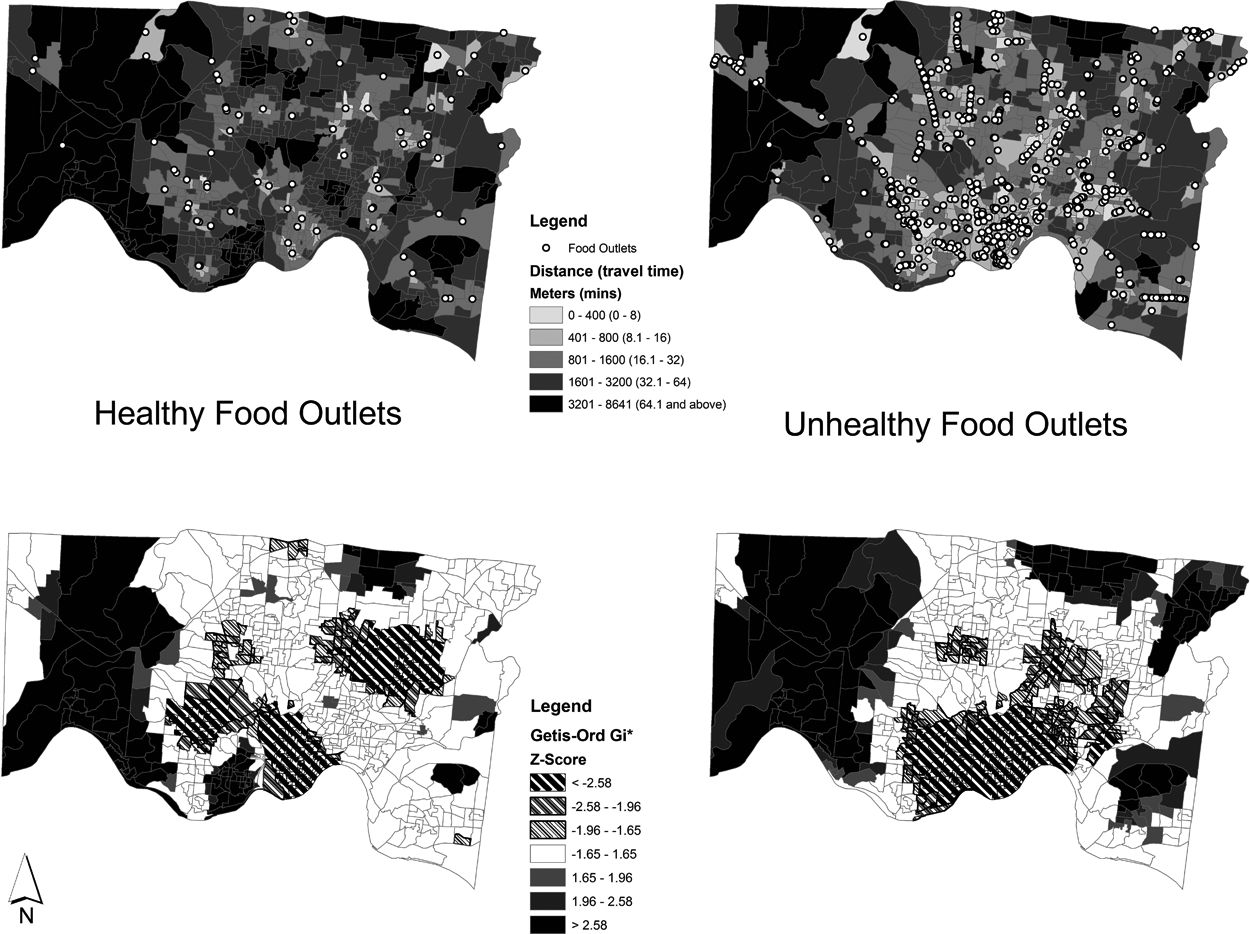
Travel time to the nearest healthy/unhealthy food outlets and the results of hot/cold spot analyses in Hamilton County, Ohio
Figure 5 shows a three-dimensional representation of access to healthy/unhealthy food among the older population. The height of each census block groups reflects number of older adults living in that area. The color reflects the travel time (minutes) to the nearest healthy/unhealthy food outlets. The large older population that can be seen in the south central part of the Hamilton County seems to have poor accessibility to healthy food outlets whereas they have good accessibility to unhealthy food outlets. Most census block groups with small older populations have poor access to healthy food outlets and to unhealthy food outlets, especially in the west side of the county.
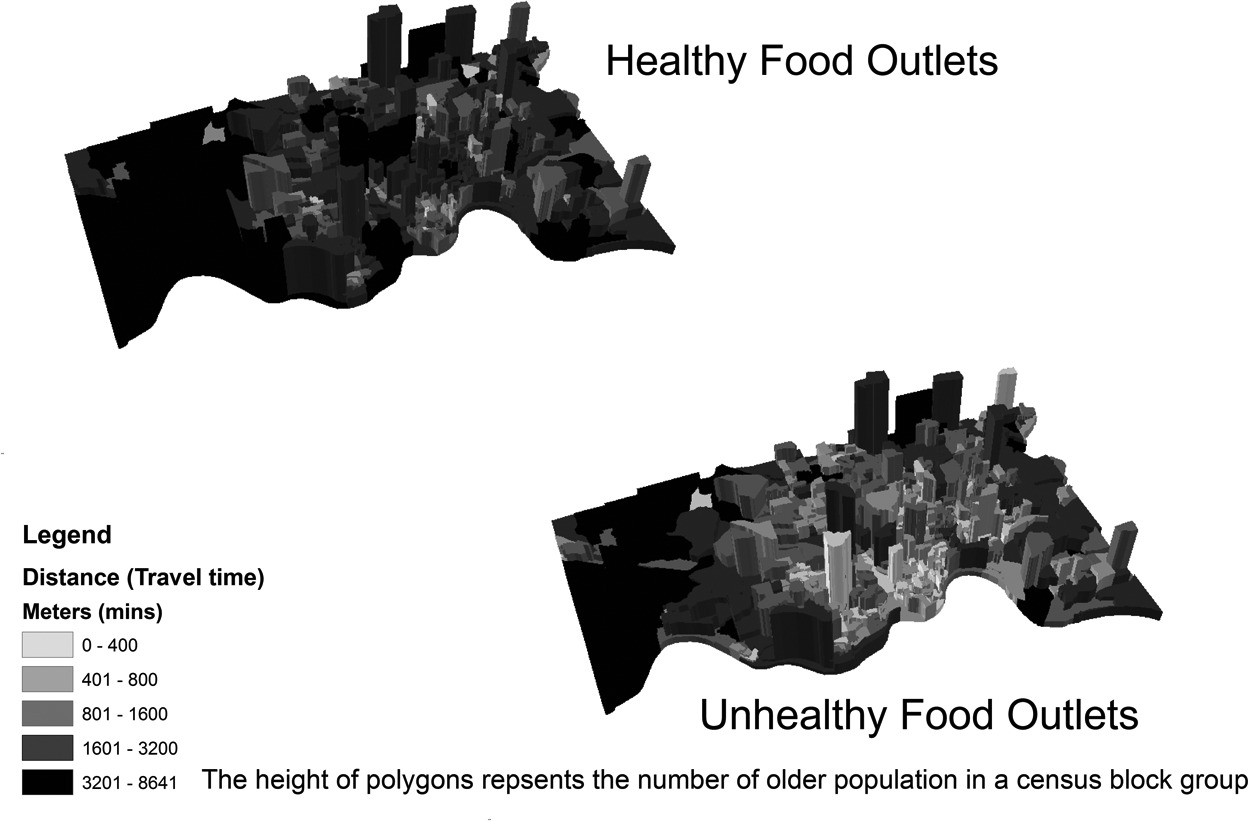
The older populations and travel time to healthy/unhealthy food outlets by census block groups
Discussion
This study described the distribution of healthy and unhealthy food outlets, and examined the ecological-level links among age and geographic access to healthy/unhealthy food outlets among the older population in a large, diverse county in Ohio with GIS software. The findings from this study help to articulate the relationship between sociodemograhic factors (in this case, age) and access to healthy food options; by extension, these findings can be incorporated into a broader conceptual understanding of the interrelationships among food access, choices, behaviors, and distal health consequences. Overall, accessibility to healthy food outlets was poorer than for unhealthy foods. In addition, people who lived outside of service areas were more likely to have poor accessibility both to healthy and unhealthy food outlets. There was a significant inequality in food access among the older population. The results of this study support previous research which examined other specifically disadvantaged populations such as racial minorities and economically poor populations and reported that the poor access to healthy foods in the United States (Baker et al., 2006; Morland, Wing, Diez-Roux, et al., 2002). Visual examination of map data and statistical analysis revealed disadvantaged areas where the accessibility to both healthy and unhealthy foods was poor. Importantly, this study highlighted the capability of the GIS application to systematically identify disadvantaged food access areas and effectively document the findings in a map format.
There are several implications from the findings of this study. First, the importance of transportation for food access among people with limited mobility is highlighted by these findings (Burns & Inglis, 2007). In the county examined in this study, older adults who live in about 25% of census block groups may need to travel more than 60 min to go to healthy food outlets. It appears to be problematic for those who live outside of the healthy food outlet service areas to travel without cars or public transpirations (Burns & Inglis, 2007). It is unlikely that people are willing to or are able to walk long distance with heavy groceries (Algert et al., 2006). Particularly those living in the census block groups with poor accessibility to healthy food outlets may have a higher need for appropriate transportation or shopping assistance to be able to make healthy food choices and to maintain a recommended diet. Second, the GIS-based maps of food access can provide critical information to public health programs, service planning, and policy decision processes because the disparity in food access and potential causes can be clearly visualized (Donkin et al., 2000). That is to say, areas with poor accessibility to healthy foods can be systematically identified while compared with surrounding road network, distribution of food outlets, and older populations simultaneously (See figures). These visual examinations can be tested with a variety of spatial statistical methods (e.g., Moran’s I, Getis-Ord Gi* statistics). Also, use of three-dimensional models makes more complex visual examinations possible. Third, the GIS-based assessment methods of food access can address certain issues with preexisting methods. For instance, initial assessments could be done with low-cost publicly available data such as census data and information from local governments. In addition, unlike data collection in the field, this is an expedient approach to analyzing large geographic areas, as significantly fewer human resources are required. In addition, privacy of personal information can be protected by strategically selecting units of analysis and adjusting visual representation, as in this study which used census block groups with older populations greater than the average (Hirshorn & Stewart, 2003). Last, the findings from this study generate more research questions and clarify potential challenges for planning and policy sectors. Given the mixed findings from past studies on the association between socioeconomic status and geographical accessibility to healthy foods, identifying disadvantaged areas or populations accurately in terms of healthy/unhealthy food access is a reasonable next step. For public sectors, the GIS-based assessments provide useful information for city planning and public health program planning because appropriate target areas and disadvantaged older population can be identified (Morland, Wing, & Diez-Roux, 2002).
There are limitations in this study. The data used for this GIS-based assessment might not have been as recent as would be desired. The numbers and distributions of older population and map data were based on the 2000 Census. Use of population-weighted census block group centroid as a representation of older adults’ residence location cannot capture within-census block group variability. The findings need to be treated with caution due to the MAUP or different geographical units (e.g., census tract, census block group) and areas (e.g., urban vs. rural areas) may generate different findings in the same context as this study (Fotheringham & Rogerson, 2009). Given that the accuracy of geocoding and mapping with GIS can be only as good as data input, the findings should be treated with caution (Larson et al., 2009). Also, the definition of healthy/unhealthy foods may not be comparable to some of the previous studies due to limited information for classification including a common definition of US$2 million threshold, floor space, and detailed types/formats (e.g., traditional supermarket, superstore). However, minor adjustments to such definition appears to be necessary according to local characteristics of focused areas (e.g., population density, area, rural/urban) and objectives of a study (e.g., food access assessment, report for local policy makers; CCPHA, 2007; Economic Research Service, 2009). On a related note, use of publically available information to assess food access could be more practical and applicable to a broader range of situations/communities despite limited detailed information. In addition, older adults may be able to find healthy foods at food outlets that are defined as unhealthy although some argue that it is skeptical about healthy foods such as fresh vegetable and fruits being chosen at fast food restaurants because the fast food restaurant use reflects individuals’ food choice behavior (e.g., lack of taste; Paeratakul et al., 2003). This study did not take into account other possible geographical accessibility indicators such as steep hills, type of roads, available public transportations, traffic condition, use of meal delivery service, or individual physical mobility limitation. Importantly, the assumption of walking speed (3 km/hr) may not be appropriate for older adults since their physical functions significantly vary. The definitions of service areas in this study also need to be taken into account. Some past studies suggest that 500-m ranges or 15-min walk are reasonable accessibility criteria for grocery shopping among physically fit adults (Algert et al., 2006; Marsden, Brown, Hutton, 2006).
Future research should extend the suggested GIS-based food accessibility assessment methods to different geographical areas and to investigate socioeconomic, demographic, and neighborhood characteristics according to healthy/unhealthy food access. In addition, a comparative study between older and younger populations in the context of food access and socioeconomic characteristics would be of an interest. Indeed, our follow-up analyses (the results not reported) for the population distribution showed that the census block groups with large younger populations were more likely to be close to healthy food outlets. Particularly, the city of Cincinnati area where more number of healthy/unhealthy food outlets had a high density of younger populations compared with the counterpart. For more sophisticated measurement, developing collaborative networks between academic researchers and local health organizations is desirable to bridge research and practice. Also, constructing publicly available unified health-related database including food outlet data would be beneficial since current systems often strictly segregate data format and data management by local government and geographical areas (Hirshorn & Stewart, 2003).
Conclusion
This study suggested a novel assessment method for geographical accessibility of healthy/unhealthy food among older adults. The GIS-based assessment revealed that there are potentially disadvantaged areas and disparities in food access in Hamilton County, Ohio. The visually represented data and statistical results are useful information for future public health intervention strategies and policy implications for older population. Further investigation is necessary to examine the validity and reliability of GIS-based assessment method and to incorporate into other research, especially on the association between socioeconomic status and food desert. The use of GIS technology has a great potential both in research and practice focusing on older adults’ mobility, health, and access to resources.
Footnotes
Acknowledgements
The authors thank Dr. John Maingi and Ms. Robbin Abbitt at the Department of Geography at Miami University, Ohio for the GIS technical advice.
The author(s) declared no potential conflicts of interest with respect to the authorship and/or publication of this article.
The author(s) received no financial support for the research and/or authorship of this article.