




Abstract
Recommended levels of physical activity may represent challenging targets for many older adults at risk for disability, leading to the importance of evaluating whether low-intensity activity is associated with health benefits. We examined the cross-sectional association between low-intensity walking activity (<100 steps/min) and health and physical function in a group of older adults. Participants (N = 187; age = 66.8; 91.4% African American; 76.5% female) wore a StepWatch Activity Monitor to measure components of low-intensity walking activity. Only 7% of participants met physical activity guidelines and moderate-intensity activity (≥100 steps/min) contributed only 10% of the total steps/day and 2% of the total min/day. Greater amount, frequency, and duration of low-intensity activity were associated with better self-report and performance-based measures of physical function, better quality of life, and fewer depressive symptoms (ps < .05). The cross-sectional relationship between low-intensity activity and health outcomes important to independent function suggests that we further explore the longitudinal benefits of low-intensity activity.
Regular physical activity is a Healthy People 2020 objective for all age groups (“Healthy People 2020,” 2010). More active compared with less active older adults, have higher levels of cardiorespiratory and muscular fitness, and higher levels of functional health (“Physical Activity Guidelines Advisory Committee Report,” 2008). To achieve health benefits, current activity guidelines recommend at least 30 min of moderate-intensity aerobic activity 5 days a week or 20 min of vigorous-intensity aerobic activity 3 days a week (“How Much Physical Activity Do Older Adults Need?” 2011; Nelson et al., 2007; “Physical Activity Guidelines Advisory Committee Report,” 2008).
According to recent CDC surveillance data, less than 16% of older adults meet activity guidelines, and more than 30% are inactive (report no leisure-time physical activity; Macera et al., 2005). Evidence suggests that many older adults have difficulty initiating and adhering to exercise programs (Boyette, Sharon, & Brandon, 1997; Clark, 1999; Resnick & Spellbring, 2000; Schutzer & Graves, 2004). This is of particular concern for older adults of low socio-economic status (SES) who have lower baseline physical activity levels than higher SES older adults (“Facts About Physical Activity,” 2012; Marshall et al., 2007; “Physical Activity Guidelines Advisory Committee Report,” 2008) and fewer physical activity-related facilities due to restrictive environmental and neighborhood characteristics (Day, 2006; Parra-Medina et al., 2010; Powell, Slater, Chaloupka, & Harper, 2006).
While the current physical activity guidelines focus on moderate-intensity to vigorous physical activity, some studies suggest that low-intensity activity, which may include non-exercise, leisure-time activities (walking for pleasure), and instrumental activities of daily living (e.g., walking related to housework or shopping), as well as low-intensity exercise, may also yield health benefits (Blumenthal et al., 1988; Demakakos, Hamer, Stamatakis, & Steptoe, 2010; Hakim et al., 1998; Hu, Li, Colditz, Willett, & Manson, 2003; Pescatello, Murphey, & Costanzo, 2000; “Physical Activity Guidelines Advisory Committee Report,” 2008; Rippe, Ward, Porcari, & Freedson, 1988; Sattelmair et al., 2011). However, there is currently limited evidence for the relationship between low-intensity activity and health using objective physical activity measures (Duvivier et al., 2013; Lee et al., 2012).
The most recent U.S. Department of Health and Human Services Physical Activity Guidelines recommended additional observational and experimental studies to evaluate the nature of the benefits of low-intensity activity, particularly within understudied populations (“Physical Activity Guidelines Advisory Committee Report,” 2008). We, therefore, described walking activity in an older cohort of urban-dwelling adults at elevated risk for functional decline and disability due to age, low income, low education, and high number of chronic diseases (Freedman, Martin, & Schoeni, 2002; Seeman, Merkin, Crimmins, & Karlamangla, 2010), and examined components of low-intensity walking activity in daily life, including amount, duration, and frequency (Howley, 2001; Kesaniemi et al., 2001), and their cross-sectional associations with physical, mental, and cognitive health.
We report on baseline daily activity measured using an objective step activity monitor (SAM) collected as an ancillary study within the Baltimore Experience Corps Trial (BECT). We hypothesized the following:
Method
Participants
The BECT is a randomized, controlled trial funded by the National Institute on Aging to evaluate the health benefits for older adults participating in Experience Corps Baltimore versus a control group that offered other low-service volunteer opportunities. Experience Corps (EC) is a high-intensity senior service program designed to place volunteers in elementary schools to improve the academic success of young children. Study design, sampling methodology, and recruitment have been described previously (Fried et al., 2004; Fried et al., 2013). Enrollment criteria included age ≥60 years, ≥24 on the Mini-Mental State Exam (MMSE; Folstein, Folstein, & McHugh, 1975), and ability to read at a minimum sixth-grade level (Wilkinson, 1993). Participants agreed to serve 15 or more hr/week for a full school year if randomized to EC. There were no exclusion criteria related to physical activity or function, including Body Mass Index (BMI), chronic diseases, or disability. A subset of participants consenting to the BECT (n = 195) were simultaneously offered the SAM. All baseline measurements were taken prior to randomization to ensure that the intervention had no effects on the results. The study protocol was approved by the Johns Hopkins School of Medicine Institutional Review Board and each participant provided written, informed consent.
SAM Protocol
The SAM is a microprocessor-linked sensor that is worn on the dominant ankle and continuously measures step activity in daily life. The device measures the number of steps at 1-min intervals using acceleration, position, and timing information, and can therefore be used to differentiate between low-intensity and moderate- to vigorous-intensity walking activity as well as characterize the amount, duration, and frequency of daily walking activity. The SAM has been validated across a range of community-dwelling older adult samples with varying functional limitations using self-report and objective measures (e.g., hand-tallied step counts and accelerometers; Cavanaugh, Coleman, Gaines, Laing, & Morey, 2007; Resnick, Nahm, Orwig, Zimmerman, & Magaziner, 2001; Storti et al., 2008). The SAM is particularly sensitive in measuring activity at decreased gait speeds (Storti et al., 2008) and is well tolerated by older adults because it is small and placed on the ankle versus the hip (Algase, Beattie, Leitsch, & Beel-Bates, 2003). The SAM, which is enclosed within a lightweight, pager-sized plastic case, was attached to the participant’s right ankle and calibrated at the baseline evaluation by comparing hand-tallied step counts to 1 min of walking activity at the participant’s normal gait. We instructed participants to wear the SAM for 3 to 7 days (excluding the first half day of data collection at the study visit when the SAM was placed on the participant’s ankle) while keeping a wear time/activity diary at approximately 1-hr intervals throughout these days. Participants were instructed to remove the SAM only when bathing, showering, or swimming and to replace the device immediately after. At the end of this period, participants were asked to mail back, in a pre-stamped, addressed envelope, the SAM, activity diary, and the Pittsburgh Sleep Quality Index (PSQI), which recorded wake and sleep times “during the past month” (Buysse, Reynolds, Monk, Berman, & Kupfer, 1989). The majority of participants wore the SAM during late summer and early fall, which reduced the influence of seasonal effects.
The SAM recorded stride counts within each 24-hr period producing 1,440, 1-min intervals. We doubled stride counts to reflect step counts for both legs. If diary information was not available, we determined wake and sleep times using the PSQI or imputed using the group’s average wake and sleep times over available days.
We excluded days representing non-compliance according to the following four criteria: (a) less than 201 total steps/day, (b) days with less than a total of 6 hr of any activity between wake and sleep times, (c) days with 6 consecutive hr of inactivity (<1 step) between wake and sleep times (Masse et al., 2005), and (d) days when participants recorded not following data collection protocol in their activity diaries. We conservatively elected not to identify and impute missing data (non-wear time) for days included in the analysis (Esliger, Copeland, Barnes, & Tremblay, 2005).
Of the 702 BECT participants, a subset of 195 were offered the SAM at baseline. Participants provided an average of 4.9 days of data. Based on the exclusion protocol detailed above, an average of 0.8 days (16.4% of data collected) were removed from analysis. Data for eight participants were excluded due to non-compliance, and a total of 187 participants comprised the final sample providing an average of 4.3 days (range = 1-9) each.
SAM Metrics
To characterize the proportion of participants meeting physical activity guidelines within our sample, we used the threshold of 10,000 steps/day developed in previous studies as a reasonable equivalent of U.S. physical activity guidelines (Tudor-Locke & Bassett, 2004; Tudor-Locke, Hatano, Pangrazi, & Kang, 2008). We classified participants who walked an average of <10,000 steps/day as less active and ≥10,000 steps/day as active. Based on previous studies translating physical activity recommendations (30 min of moderate-intensity activity/day that can be split into 3, 10-min bouts/day) into a pedometer-based step goal (3 bouts/day of 1,000 steps in 10 min; Marshall et al., 2009; Tudor-Locke, Sisson, Collova, Lee, & Swan, 2005), we additionally classified participants who completed <3 bouts/day on average as less active and ≥3 bouts/day as active.
Intensity ranges (effort associated with walking) included low-intensity (>0 steps/min and <100 steps/min) and moderate to vigorous-intensity (≥100 steps/min) based on studies translating laboratory measurements of oxygen consumption while walking into pedometer-based metrics (Marshall et al., 2009; Tudor-Locke et al., 2005). Metrics representing components of activity within intensity ranges are described below and summarized in Figure 1. All analyses (Table 2) were restricted to low-intensity activity (>0 steps/min and <100 steps/min) and excluded activity at moderate- to vigorous-intensity (≥100 steps/min). All metrics were averaged across all valid days surveyed.

Low-intensity activity metrics.

Activity amount was defined as the number of steps/day at low-intensity and included total steps/day at >0 and <100 steps/min; steps at ≥100 steps/min were excluded. We included total number of steps/day across intensities and the number of steps/day at moderate to vigorous-intensity (≥ 100 steps/min) for comparison. Activity duration was defined as the number of minutes/day of low-intensity activity and included total minutes/day at >0 and <100 steps/min; minutes at ≥100 steps/min were excluded. We included the number of minutes/day of moderate to vigorous-intensity activity (≥100 steps/min) for comparison. Activity frequency was defined as the number of bouts/day of 10-min, low-intensity activity and calculated by adding the number of times participants completed 10 consecutive minutes of low-intensity activity (>0 steps/min and <100 steps/min). This metric was based on U.S. Department of Health and Human Services physical activity recommendations stating that 30-min bouts of activity can be obtained through 3, 10-min bouts that can be accumulated over the course of the day (Nelson et al., 2007; “Physical Activity Guidelines Advisory Committee Report,” 2008). We additionally calculated the number of bouts/day of 30-min low-intensity activity; however; this represented a low frequency event in our sample (M = .56 bouts/day, SD = .95).
Health Measures
We examined the association between low-intensity walking activity and baseline mobility, performance-based lower extremity function, depressive symptoms, quality of life, and global cognition.
Self-reported mobility measures included (a) difficulty walking one mile or several blocks and (b) difficulty going up and down a flight of stairs (indoors; Fried et al., 1991; Weiss, Fried, & Bandeen-Roche, 2007). Participants self-reported “none,” “a little,” “some,” “quite a lot,” or “cannot do” for each measure. Similar to previous studies, both mobility measures were coded as binary indicators so that odds ratios (ORs) indicated any self-reported limitation (“a little,” “some,” “quite a lot,” “cannot do”) versus no limitation (“none”). Performance-based lower extremity function was measured using the Short Physical Performance Battery (SPPB). The SPPB assessed walking (timed 4-meter walk at the participant’s usual pace), tests of balance (ability to stand in the side-by-side, semi-tandem, and tandem positions for 10 s), and strength (time to rise from a chair 5 times; Guralnik et al., 2000). For each test, participants received a score of 0 to 4; 0 indicated an inability to complete the test and 4 indicated the highest level of performance. Scores for all three performance-based measures were summed to create a total score ranging from 0 to 12, with higher scores reflecting better lower extremity function (Guralnik et al., 2000). Depressive symptoms were measured using the Geriatric Depression Scale (GDS) short form, a 15-item list developed specifically for use in older adult populations (higher scores represented more depressive symptoms; Yesavage et al., 1982). Quality of life was measured by summing participants’ self-report of any problems with mobility, self-care, usual activities, pain/discomfort, and anxiety/depression from the EuroQuol questionnaire (The EuroQol Group, 1990). Total scores ranged from 0 to 5 with higher scores reflecting lower quality of life. Global cognition was measured using the MMSE (Folstein et al., 1975), a global test of cognitive function with scores ranging from 24 to 30 at baseline. All models were adjusted for confounders: age at baseline, gender, and race.
Statistical Analysis
We first compared baseline socio-demographic and health characteristics between participants offered the SAMs and those in the larger BECT using chi-square tests for dichotomous variables and t tests for continuous variables (Table 1). Next, we confirmed that all three metrics of low-intensity activity were normally distributed. We additionally examined the Pearson correlations among low-intensity metrics.
Baseline Characteristics Study Subjects (N = 187).

Note. BMI = Body Mass Index; SPPB = Short Physical Performance Battery; GDS = Geriatric Depression Scale; MMSE = Mini-Mental State Exam.
10,000 steps/day considered an estimate of daily recommended walking activity.
30 min/day of moderate-intensity activity (≥100 steps/min) considered an estimate of daily recommended walking activity.
Low-intensity activity defined as walking activity at <100 steps/min.
Moderate to vigorous-intensity is defined as activity at ≥100 steps/min.
We then examined the associations between the three metrics of low-intensity activity and health measures (Table 2). All analyses were restricted to low-intensity activity metrics and excluded moderate or higher intensity activity. Logistic regression models were used to analyze the two binary health measures; model results were expressed as a unit increase in SAM metrics associated with an increased/decreased odds of reporting “difficulty with walking 1 mile or several blocks,” and “difficulty with one flight of steps.” Linear regression models were used to analyze the four continuous health measures; model results were expressed as a unit increase in SAM metrics associated with an increase/decrease in “Lower extremity function (SPPB),” “Depressive Symptoms (GDS),” “Quality of Life,” and “Global Cognition (MMSE).” Estimated effect sizes of steps/day (amount) and minutes of activity (duration) on health measures were specifically expressed in units of 1,000 steps/day and 10 min/day, respectively, based on previous studies as well as ease of interpretation (Sisson et al., 2010). All statistical tests were two-sided and performed using Stata version 12 (StataCorp, 2011). Regression diagnostics for outliers, normality of residuals, and checks for multicollinearity were performed by visual inspection of residual plots and computation of variance inflation factors. Tobit regression and robust standard errors were used for all regression models where health measures had censoring or skew.
Associations Between Metrics of Low-Intensity Activity and Health Measures.
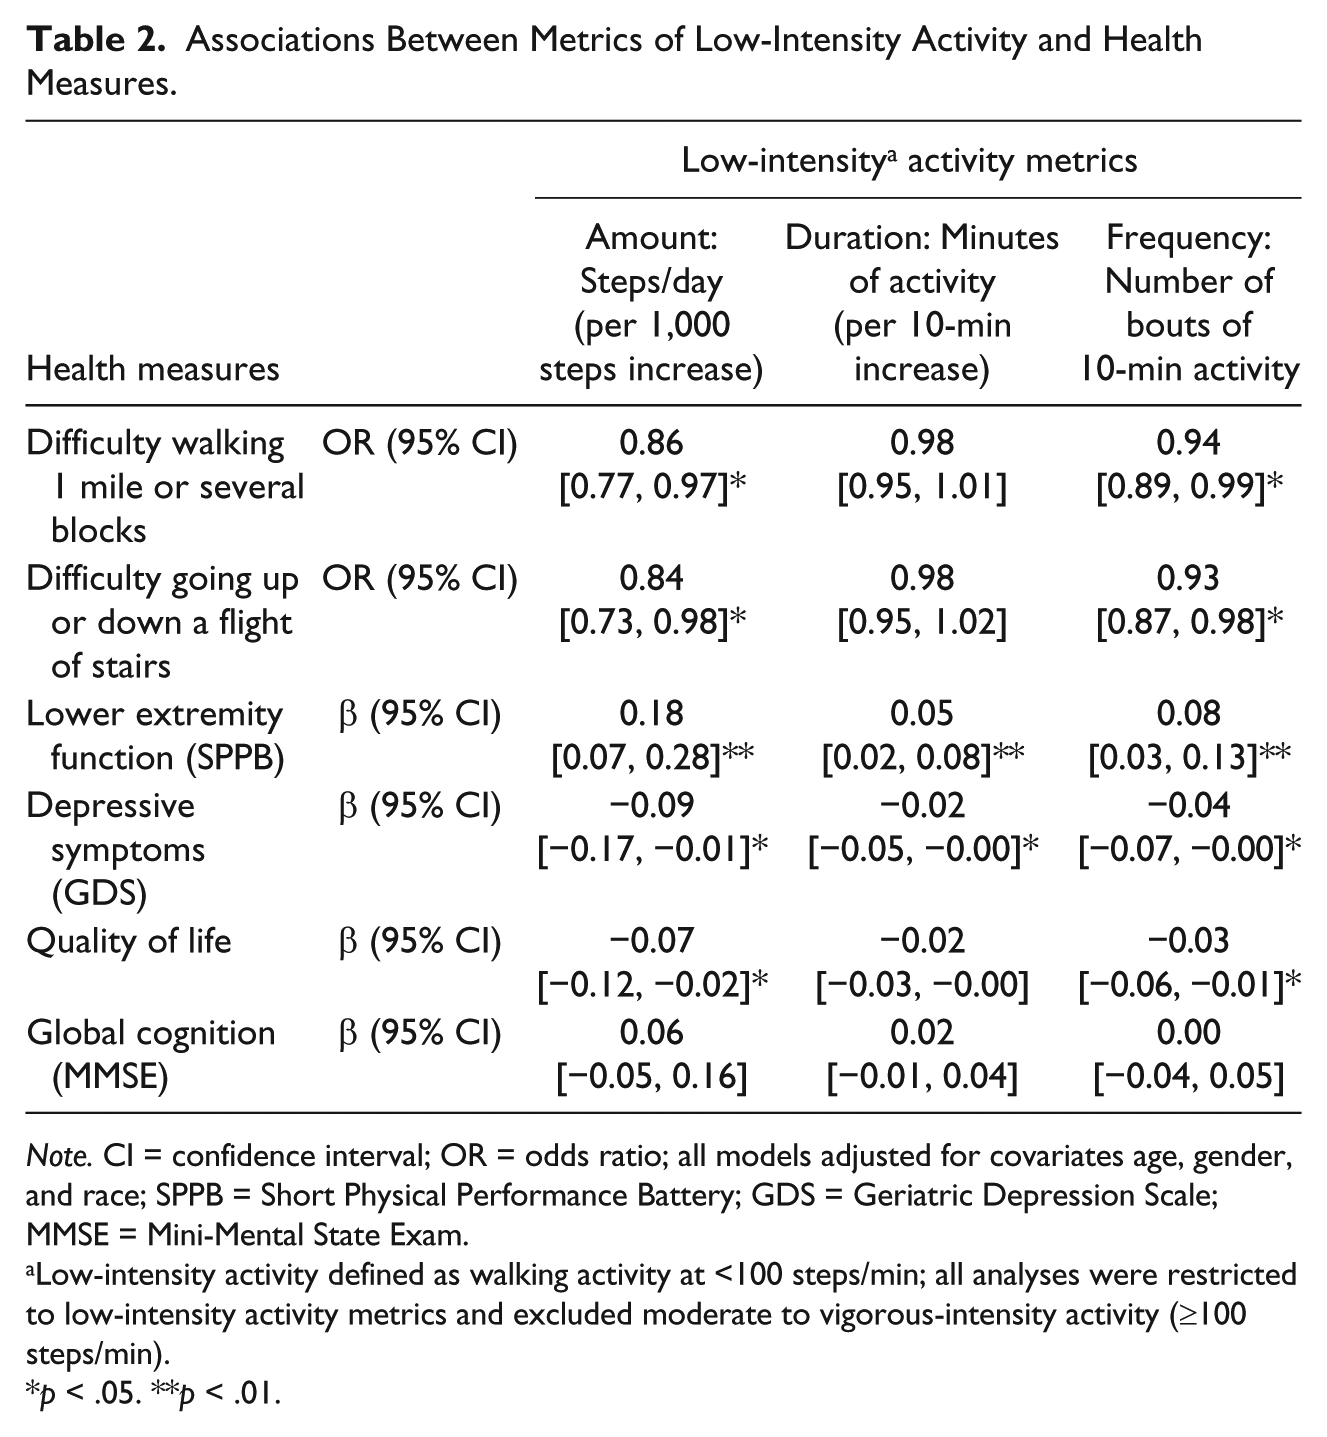
Note. CI = confidence interval; OR = odds ratio; all models adjusted for covariates age, gender, and race; SPPB = Short Physical Performance Battery; GDS = Geriatric Depression Scale; MMSE = Mini-Mental State Exam.
Low-intensity activity defined as walking activity at <100 steps/min; all analyses were restricted to low-intensity activity metrics and excluded moderate to vigorous-intensity activity (≥100 steps/min).
p < .05. **p < .01.
Results
Table 1 presents baseline characteristics of the study sample. Participants averaged 66.8 years, were predominately female (76.5%) and African American (91.4%), with 36.9% reporting high school or less education, and 28.0% reporting household income less than US$15,000. Rates of chronic disease were high; 58.3% of participants were obese, 71.2% reported hypertension, 61.8% reported osteoarthritis, and 32.6% reported diabetes. Participants offered the SAMs did not vary significantly (p < .05) from those in the larger BECT on any of the above socio-demographic and health characteristics at baseline.
Considering physical activity guidelines (10,000 steps/day) 7.0% (n = 16) were considered active and did meet guidelines. Based on Department of Health and Human Services guidelines of 30 min of moderate-intensity activity/day, we found that 1.1% (n = 2) met guidelines by completing 3 or more 10-min moderate-intensity bouts/day. Participants completed a total of 7,648.8 steps/day; the majority of walking activity was in the low-intensity range (6,888.1 steps/day; 90.1% of total daily steps) with minimal activity in the moderate to vigorous-intensity range (760.7 steps/day; 9.9% of total daily steps). Participants additionally had, on average, only 6.9 min/day of moderate to vigorous-intensity activity (2.1% of total daily minutes of activity) with the majority of activity in the low-intensity range (321.9 min/day; 97.9% of total daily minutes of activity; Figure 2). Participants averaged 10.3 bouts/day of 10-min low-intensity activity. As expected, SAM metrics were highly correlated (r = .87-.88; all p < .001).
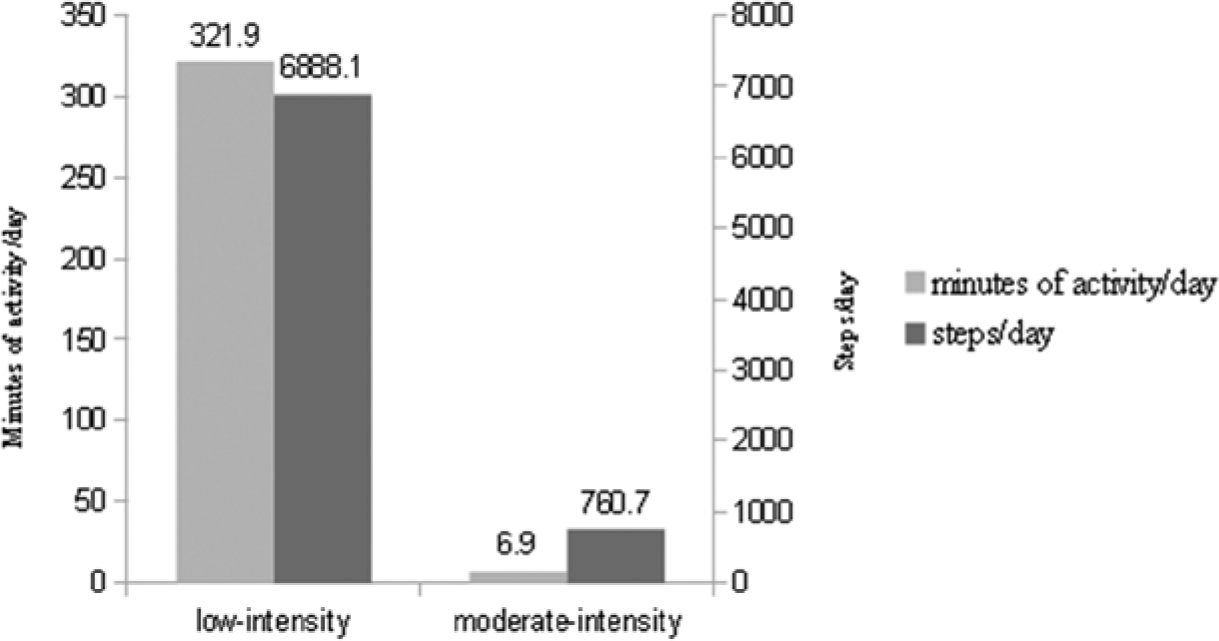
Distribution of average number of minutes/day of activity by intensity (n = 187).
Table 2 presents the associations between low-intensity activity metrics and health measures, after adjusting for age, gender, and race. A 1,000-step increase in steps/day at low-intensity was significantly associated with better physical function measures, including a 14% reduction in the odds of reporting difficulty walking 1 mile (OR = 0.86, 95% confidence interval [CI] = [0.77, 0.97]); a 16% reduction in the odds of reporting difficulty with 1 flight of steps (OR = 0.84, 95% CI = [0.73, 0.98]); and a .18-point increase in SPPB (95% CI = [0.07, 0.28]). Each additional bout of 10-min activity was also associated with better physical function, including a 6% reduction in the odds of reporting difficulty walking 1 mile (OR = 0.96, 95% CI = [0.93, 1.00]); a 7% reduction in the odds of reporting difficulty with 1 flight of steps (OR = 0.93, 95% CI = [0.87, 0.98]); and a 0.08 point increase in SPPB (95% CI = [0.03, 0.13]). A 10-min increase in low-intensity minutes/day was associated with a 0.05 point increase in SPPB (95% CI = [0.02, 0.08]). All low-intensity activity metrics were significantly associated with fewer depressive symptoms. Specifically, for each low-intensity measure, a 1,000-step increase in steps/day, a 10-min increase in low-intensity minutes/day, and an additional bout of 10-min activity were each associated with, respectively, 0.09 (95% CI = [−0.17, −0.01]); .02 (95% CI = [−0.05, −0.00]); and 0.04 (95% CI = [−0.07, −0.00]) fewer depressive symptoms. These associations were significant despite the generally low levels of reported depressive symptoms (M = 3.1; range = 2-10). A 1,000-step increase in steps/day and an additional bout of 10-min, low-intensity activity were also significantly associated with, respectively, 0.07 (95% CI = [−0.12, −0.02]) and 0.03 (95% CI = [−0.06, −0.01]) points better quality of life. However, the MMSE was not associated with low-intensity activity although model estimates indicated a consistent trend between greater low-intensity activity and higher MMSE. MMSE scores were highly skewed (M = 28.2; range = 24-30) due to trial enrollment criteria.
Discussion
In a community-based cohort of urban-dwelling, older adults, we observed that only 7% met physical activity guidelines, with the majority of activity falling within the low intensity compared with the moderate- to vigorous-intensity ranges. In cross-section, greater low-intensity walking activity was associated with better physical function and health, including better quality of life and fewer depressive symptoms. These findings provide evidence for the value of objectively measuring rates of low-intensity step activity in daily life, a range of activity that is much more common than moderate-intensity activity and may serve a target to maintain and promote health.
Moderate-intensity walking activity comprised only 10% of total steps/day and 2% of total minutes/day. By comparison, low-intensity activity was highly prevalent, possibly because it relates to routine daily functional and social activities. For example, activities related to low-intensity walking activity within our sample can include care-taking of grandchildren, walking to catch a bus, and church-related social activities. The step activity associated with these activities in the aggregate may represent health promoting behaviors that should be quantified particularly in minority older adults at elevated risk for functional decline and disability. The SAM was designed to precisely measure walking activity in older adult populations with varying levels of function (Resnick et al., 2001; Storti et al., 2008). Furthermore, it can be used to identify potentially meaningful metrics of daily walking activity beyond total steps/day, including amount, duration, and frequency within the low-intensity range, which may serve as targets in future designs of achievable and sustainable activity interventions in otherwise sedentary individuals.
One limitation of this study was its cross-sectional design. Given the BECT pre–post trial design, we will be able to further explore whether increasing levels of low-intensity activity may protect against subsequent functional, mobility, mental, and cognitive health declines. Another potential limitation was the placement of the SAM device on the ankle versus hip. While this placement allows the SAM to detect steps in participants with altered gait, we did not capture non-ambulatory movement associated with trunk and upper body activities, a component of total daily physical activity. In addition, physical activity guidelines recommend activity 5 days a week; averaging activity across all compliant days provided by participants to determine whether they met guidelines may have underestimated the proportion of participants who were physically active. Also, for those with very low levels of activity, exclusion criteria removing days with less than 6 hr of activity may have resulted in an underestimation of individuals who were very sedentary. However, the effect of any bias was likely minimal given the extremely low overall rates of moderate to vigorous-intensity activity. Finally, while the study sample represented an understudied and at-risk segment of the older adult population, a trial of high-intensity volunteer service may select the more health conscious and physically active members of the community (Boughner, 2010; Lindsted, Fraser, Steinkohl, & Beeson, 1996). Therefore, study results may represent a conservative estimate of walking activity and health relative to the larger older adult population.
Conclusion
Measuring daily walking activity in a largely sedentary and at-risk older adult population demonstrated the importance of low-intensity levels of walking activity to numerous health measures, including physical function, mental health, and quality of life. These positive associations highlight the need to better characterize and understand how increasing daily levels of low-intensity walking in various ways may be associated with the prevention of disability and enhanced quality of life in the aging population.
Footnotes
Declaration of Conflicting Interests
The authors declared no potential conflicts of interest with respect to the research, authorship, and/or publication of this article.
Funding
This work was supported by the National Institute on Aging [grant numbers P01 AG027735, 3P01AG027735-03S2, 3P01AG027735-02S3, K01AG031332]; the National Institute on Aging Claude D. Pepper Older Americans Independence Center [grant number P30-AG021334]; the U.S. Public Health Service [grant numbers R01 HL077141, R01 HL089694, R21 CA127511, RC1 HL099340, and U01 AG022376]; and the John A. Hartford Foundation and the John D. and Catherine T. MacArthur Foundation. The content is solely the responsibility of the authors and does not necessarily represent the official views of the funders.