
Abstract
Heterogeneity in older adults’ mobility and its correlates have rarely been investigated based on objective mobility data and in samples including cognitively impaired individuals. We analyzed mobility profiles within a cognitively heterogeneous sample of N = 257 older adults from Israel and Germany based on GPS tracking technology. Participants were aged between 59 and 91 years (M = 72.9; SD = 6.4) and were either cognitively healthy (CH, n = 146), mildly cognitively impaired (MCI, n = 76), or diagnosed with an early-stage dementia of the Alzheimer’s type (DAT, n = 35). Based on cluster analysis, we identified three mobility types (“Mobility restricted,” “Outdoor oriented,” “Walkers”), which could be predicted based on socio-demographic indicators, activity, health, and cognitive impairment status using discriminant analysis. Particularly demented individuals and persons with worse health exhibited restrictions in mobility. Our findings contribute to a better understanding of heterogeneity in mobility in old age.
The maintenance of mobility in old age is important for quality of life, social participation, and autonomy (Mollenkopf, Hieber, & Wahl, 2011; Schaie, Wahl, Mollenkopf, & Oswald, 2003; Webber, Porter, & Menec, 2010). Mobility limitations (e.g., reduced walking speeds) in old age are associated with a higher risk of adverse events, such as falls or hospitalization (Montero-Odasso et al., 2005), and even with a higher mortality risk (Melzer, Lan, & Guralnik, 2003; Wilson, Schneider, Beckett, Evans, & Bennett, 2002).
Previous research has shown that many older adults exhibit declines in mobility and that the prevalence of mobility disabilities increases with age (Leveille, Penninx, Melzer, Izmirlian, & Guralnik, 2000). Specifically, older adults usually have more conservative walking patterns, characterized by lower walking speeds and shorter step lengths compared with younger people (Abreu & Caldas, 2008; Menz, Lord, & Fitzpatrick, 2003; Shumway-Cook et al., 2007). These age-related gait speed declines have been found when individuals walk as fast as possible, but also when they walk at a comfortable walking speed (Steffen, Hacker, & Mollinger, 2002). Older adults also tend to stay closer to their home than younger age groups, resulting in a more restricted life space (Barnes et al., 2007; Peel et al., 2005).
Previous research based on GPS tracking technology, a tool to objectively assess out-of-home mobility, found that groups differing in cognitive status (cognitively healthy individuals, persons with mild cognitive impairment, and early-stage demented older adults) did not differ in measures of walking behavior (walking speed, number of walking tracks, etc.), which comprises mobility indicators of rather low complexity. However, demented older adults had lower levels in the more complex indicators of global out-of-home mobility, such as the time spent out of home or the number of visited places (Wettstein et al., 2012).
Although these results suggest that cognitive impairment is associated with out-of-home mobility, addressing the issue of heterogeneity of mobility patterns among older adults needs a more profound treatment. As an important general background, differential aging effects and pronounced heterogeneous profiles in old age have been observed in different domains such as cognitive abilities and aging (Christensen et al., 1999; Comijs, Dik, Deeg, & Jonker, 2004; Deary, MacLennan, & Starr, 1998), as well as personality and social integration (Gerstorf, Smith, & Baltes, 2006). This is also likely to be true for the out-of-home mobility domain, but respective empirical underpinning has remained rare.
Cluster analytic approaches have repeatedly been used in the more recent aging research to illustrate phenomena of differential aging and heterogeneity between older adults (Gerstorf et al., 2006; Smith & Baltes, 1998). However, these previous approaches to assess and illuminate patterns of differential aging and heterogeneous profiles of functioning and lifestyle in old age have only rarely focused out-of-home mobility. One exception is the study by Mollenkopf et al. (2004), who investigated the nature and extent of inter-individual heterogeneity in self-reported mobility in a sample of cognitively unimpaired older adults only. Based on cluster analysis with different diary-based mobility indicators as well as satisfaction with one’s own mobility, they identified four subgroups: Subgroup 1 had high outdoor mobility levels and reported a high mobility satisfaction, Subgroup 2 exhibited a medium outdoor mobility and also reported being very satisfied with their mobility, Subgroup 3 was low in outdoor mobility but still rather satisfied with their mobility, whereas Subgroup 4 reported dissatisfaction with their mobility and also had low outdoor mobility levels. Differences between the four subgroups were found regarding socio-demographic indicators as well as health-related, psychological, and structural variables. Mean age as well as the proportion of individuals living alone were highest in Cluster 4, whereas the frequency of persons with a car was lowest in this cluster.
In terms of assessment methodology, however, the Mollenkopf et al. (2004) study solely relied on questionnaire- and diary-based, that is, self-report based information on mobility and did not explicitly include older adults with cognitive impairment. To our knowledge, assessment of out-of-home mobility via GPS technology has so far not yet been used as a source to identify distinguishable mobility profiles. GPS-based mobility measures have several advantages and should, therefore, more intensively be used for the study of out-of-home mobility: Data obtained by GPS technology reveal a high degree of objectivity and accuracy hard to achieve by self-report measures (Shoval et al., 2010; Terrier & Schutz, 2005). Moreover, GPS devices can be used for the determination of various walking parameters, such as walking speed, which cannot easily be assessed based on mobility diaries or other types of self-reports. GPS technology also allows a mobility assessment in the natural environment, thus warranting high ecological validity of the collected data. Moreover, we claim that when addressing heterogeneity in old age, subsamples of cognitively impaired, particularly demented individuals need to be included to obtain a sample that is representative of the population of older adults as the prevalence of dementia dramatically increases in old age (Baltes & Smith, 2003). Therefore, we examine in this article the interindividual heterogeneity in out-of-home mobility in a cognitively heterogeneous sample of older adults based on GPS technology. We use samples from two different countries (Germany and Israel). The inclusion of different cognitive status groups allows us to determine whether different cognitive status groups exhibit different mobility profiles and belong to different mobility clusters. To our knowledge, this relationship between mobility patterns and cognitive status, which might have direct implications for early diagnosis of cognitive impairment in old age, has not yet been addressed by previous research.
To address interindividual heterogeneity in mobility based on GPS tracking technology, the explicit consideration of the multidimensionality is also a major issue (Metz, 2000; Patla & Shumway-Cook, 1999; Webber et al., 2010). We, therefore, follow a multiple-indicators approach by using a range of different GPS-based mobility measures that were collected during a 4-week period for each individual. Although there is some evidence that mobility patterns vary according to weekdays (Kaspar, Oswald, Wahl, Voss, & Wettstein, 2012), we used mobility measures that were aggregated across the whole tracking interval in this study as our research focus was on person-specific and not on time-specific predictors of mobility patterns. We distinguish between two kinds of mobility indicators (see also Wahl et al., 2012; Wettstein et al., 2012): mobility parameters reflecting out-of-home walking behavior (such as walking speed or number of walking tracks), as walking is the most common and frequently used transport mode in old age (Mollenkopf et al., 2004), and parameters that indicate global out-of-home mobility (such as time spent out of home or number of places visited).
Although following a cluster-analytic strategy primarily means an exploratory approach, we also have a number of expectations. Generally, our assumption is that given the described findings on differential aging in general and heterogeneity in older adults’ mobility (Mollenkopf et al., 2004), several different types of GPS-assessed mobility will be identifiable. Regarding the characteristics and correlates of the mobility types, we expect that as demented individuals have been found to show reduced levels in several mobility outcomes when compared with cognitively healthy older adults (Wettstein et al., 2012), most of them will belong to a mobility type that is characterized by generally restricted mobility patterns. We also expect that physical health is another important variable discriminating between mobility types, as declining health is associated with reduced out-of-home mobility (Bendall, Bassey, & Pearson, 1989; Clark, Stump, Hui, & Wolinsky, 1998; Murata, Kondo, Tamakoshi, Yatsuya, & Toyoshima, 2006). Moreover, different mobility types have been shown to have varying degrees of motivation to spend time out of home (Mollenkopf et al., 2004). We, therefore, include this motivational aspect in our set of potential predictors of mobility patterns. We also examine the role of out-of-home activities for the prediction of mobility types. Out-of-home activities represent a typically self-report-based approach to out-of-home mobility (Bielak, 2010). Thus, including out-of-home activities allows us to investigate whether different types of mobility, assessed by GPS technology, also systematically differ regarding their self-reported out-of-home behavior as indicated by out-of-home activity measures. Finally, we will also consider socio-demographic variables such as age, gender, country, and marital status as potentially important to understand heterogeneity in mobility patterns.
Method
Project Design, Study Samples, and Recruitment Strategy
The project “SenTra” (“The Use of Advanced Tracking Technologies for the Analysis of Mobility in Alzheimer’s Disease and Related Cognitive Diseases”; Shoval et al., 2008) provided the platform for this study. Details regarding the project and the sampling procedure have been reported elsewhere (Shoval et al., 2011; Wettstein et al., 2012). A cognitively heterogeneous sample was deliberately collected, composed of cognitively healthy older adults (CH; n = 146) as well as individuals with a mild cognitive impairment (MCI; n = 76) or with an early-stage dementia of the Alzheimer’s type (DAT; n = 35). Participants with cognitive impairment fulfilled either the diagnostic criteria for DAT (American Psychiatric Association, 1994) or MCI (Levy, 1994; Winblad et al., 2004). Because of our intention to use questionnaires as well as GPS technology across a period of 4 weeks (see below), we only included early-stage demented individuals, based on a global deterioration scale (GDS; Reisberg, Ferris, de Leon, & Crook, 1982) score of 4 or a Clinical Dementia Rating (CDR; Morris, 1997) score of 0.5 or 1.0.
All participants were informed about the project and the assessment procedure by means of individual invitation letters, followed by personal telephone calls. If respondents were willing to participate, they were enrolled in the study after informed consent, following the ethical guidelines and procedures for formal ethical consent. Particularly expected ethical considerations regarding the study’s use of GPS/GIS technology (e.g., fear of being observed, intrusion into privacy) were discussed. Written informed consent was received from all participants, and the Ethics Board Review of the University of Heidelberg and the Helsinki Committee (IRB) at the Tel Aviv Sourasky Medical Center approved the study.
Reasons for refusing participation in the study were, among others, distrust or fear regarding the GPS technology (CH: 4%, MCI: 0%, DAT: 4%), lack of interest and/or time (CH: 67%, MCI: 46%, DAT: 29%), general health problems (CH: 17%, MCI: 12%, DAT: 29%), and occurrences with significant others (e.g., recent death of partner; CH: 6%, MCI: 0%, DAT: 0%). We generally recruited, to some extent, a positively selected group of CH, MCI, and DAT participants regarding outcome variables such as health.
Measures
GPS-based measurement of out-of-home mobility indicators as input to explore mobility types
Participants received a GPS tracking kit and instructions concerning its use. The kit consisted of a GPS receiver with a Global System for Mobile communications (GSM) modem and a monitoring unit located in the home that let researchers know whenever the tracked person leaves home (Murakami & Wagner, 1999; Shoval et al., 2008; Shoval et al., 2010; Shoval & Isaacson, 2006). The participant took the unit with him or her whenever he or she was out of home for a period of up to 4 weeks. The GPS was programmed to obtain locations every 5 s when the tracked person was outside the home. The data collected in Israel and in Germany were sent by General Packet Radio Service (GPRS) protocol to the project server at the Hebrew University of Jerusalem (Shoval et al., 2011).
Missing data may result from various sources, such as problems with the mobile phone connection due to underserved areas, connection problems occurring in the data transport from Germany to Israel, or simply participants forgetting the device itself or forgetting to charge it. Therefore, a validity classification was used for periods of 24 hr, and only days that did not have more than 1 hr of missing data were considered “valid days” for full time-space analysis. In addition, we only used tracking data on days with out-of-home behaviors; days that were completely spent at home are excluded from the following analyses. Applying these validity criteria, the mean number of valid days in our sample was 20.5 (SD = 5.9); that is, on average, 70% of the days within the tracking period of our study participants were considered valid. There were no significant differences between the three groups regarding the mean number of valid days.
According to the components of out-of-home mobility that we conceptually distinguished, we included the following GPS tracking data. Regarding out-of-home walking indicators, we refer to five GPS-based indicators: that is, walking distance, walking duration (per walking track), time spent walking (per day), number of walking tracks per day, and walking speed. Walking tracks were identified based on a speed criterion, that is, all tracks with a speed less than 5 km/hr were considered as walking tracks. This criterion proved useful in previous GPS tracking research (Shoval, et al., 2010) for distinguishing walking tracks from tracks that were covered by car or other means of transport. In terms of global out-of home mobility indicators, we refer to the time spent out of home and the number of visited places per day. Only places respondents stayed at for at least 5 min were included; this criterion was chosen following previous research (Shoval et al., 2010) to exclude places of minor importance (such as traffic lights or parking lots) where people usually spend less than 5 min. Places included may thus be locations such as supermarkets, physicians, or the apartment of a relative.
Variables Considered for Additional Characterization of Mobility Types
Additional measures were used to characterize the mobility groups identified and to investigate which of these additional measures discriminate between the mobility types. These variables are out-of-home activity, indoor–outdoor motivation, socio-demographic measures, cognitive status, and health-related variables, which are described in more detail below.
Self-report-based measurement of out-of-home activity
Participants filled out an activity list in which 23 out-of-home activities (e.g., gardening, running errands, working/volunteering) were included. They gave information about which of the activities listed they exerted (yes/no). The list was derived from previous research in which these activities were found to be appropriate representations of older adults’ out-of-home behavior (Heyl, Wahl, & Mollenkopf, 2005; Mollenkopf, 2005).
To identify the (most) cognitively and physically demanding activities within the activity list, an expert rating was derived in the following way: 10 experts from different academic disciplines (predominantly psychology, gerontology, and gero-psychiatry), with extensive scientific and practical knowledge about older age, evaluated the cognitive demands of every single activity, using a Likert-type scale ranging from 0 = little demanding to 10 = very demanding. The resulting ratings were highly consistent, as indicated by a Cronbach’s α of .84 and .89 for cognitively demanding and physically demanding activities, respectively. All activities with a mean cognitive demand rating above the total average (M = 6.05) and with a small interrater deviation (SD < 1.6) were categorized as cognitively demanding activities. These activities were working/volunteering, attending to business transactions (e.g., banking, mail, municipal/local authority), visiting a library, accompanying someone, and being involved in education (e.g., participating in courses, vocational training, senior academy).
In a similar way, activities with a mean physical demand rating above the total average (M = 6.42) and with a small inter-rater deviation (SD < 1.22) were classified as physically demanding activities (shopping, gardening, sports). Activities that were rated as physically and cognitively highly demanding were excluded from both activity classes. To avoid any overlap between the two activity categories, we did not include these activities in both activity domains. Classifying them into one of both activity categories only would have been to some extent arbitrary. Moreover, the number of activities that were both physically and cognitively demanding was not large enough to create an additional activity category.
Indoor–outdoor motivation
Adopting the assessment method reported in previous studies (Mollenkopf et al., 2004), we assessed indoor–outdoor motivation based on one item (“Are you a person who more often likes to stay at home, or a person who likes to be on the go?”). Answers could be given on a scale ranging from 0 = “I would like to be at home all the time” to 10 = “I would like to be on the go all the time”.
Socio-demographic measures
The socio-demographic measures included were age, gender, marital status (married vs. single, widowed, or divorced), and country (Germany vs. Israel).
Cognitive status
Based on the recruitment and composition of the sample (see above), the distinction between CH study participants, individuals with MCI, and older adults with early-stage DAT was used to further characterize mobility types in terms of cognitive impairment status.
Health-related measures
Participants rated their subjective health on a 5-point scale ranging from 1 = excellent to 5 = bad. Previous research has shown that this single-item health indicator is a psychometrically sound and valid measure with consistent correlates (Idler & Benyamini, 1997; Pinquart, 2001). On the same scale, they rated their subjective ability to move. Perceived independence (regarding everyday activities) was assessed on a scale from 0 = completely dependent to 10 = completely independent. Moreover, the following subscales of the SF-36 (Bullinger & Kirchberger, 1998) were used as indicators of health and of health-related quality of life: The Physical Functioning subscale assesses with 10 items the extent to which health problems impair everyday (physical) activities (such as walking more than 1 mile) and self-care. Possible answers on each item are “yes, strongly impaired,” “yes, slightly impaired,” and “no, not impaired”. The SF-36 subscale Role Limitations Because of Physical Health Problems consists of four items assessing whether individuals have problems with work or other daily activities as a result of limited physical health. The subscale Bodily Pain, consisting of 2 items, measures the magnitude of pain within the past 4 weeks and how much this pain interfered with everyday activities. All these SF-36 scales have been shown to be highly reliable and valid assessment instruments (Bullinger & Kirchberger, 1998). The resulting sum scores for all SF-36 scales range from 0 to 100, with higher values indicating better health outcomes (i.e., higher physical functioning, lower physical role limitations, and less pain).
Data Analysis Strategy
First, a two-step cluster analysis (SPSS, 2001) was conducted with all included GPS-derived indicators of out-of-home mobility, namely, the measures of out-of-home walking behavior (time spent walking per day, number of walking tracks, walking distance, walking speed, and walking duration per walking track) and the indicators of global out-of-home mobility (e.g., time out of home, number of places visited). The application of cluster analysis serves to identify individuals who are similar to each other in a multivariate space that is determined by multiple variables (Smith & Baltes, 1998). This allows an identification of and distinction between different types or “clusters”. The advantage of the two-step cluster analysis is that the number of clusters is determined automatically, based on the Schwarz Bayesian Criterion, so that the selection of clusters is less arbitrary than based on other cluster analytical approaches.
The resulting clusters in this study were subsequently compared regarding their mobility patterns. For characterizing the mobility clusters and for a first estimation of the “goodness” of the cluster solution, differences between clusters in the mobility measures and their effect sizes were investigated based on univariate as well as multivariate analyses of variance ((M) ANOVAs). We also used the mobility indicators as predictors of mobility cluster membership by using a discriminant analysis. The aim of this analysis was also a first evaluation of the adequacy of the cluster solution.
To investigate whether differences between clusters are not restricted to indicators of mobility, the clusters were then compared in measures of activity, outdoor motivation, health, cognitive status, and socio-demographic indicators. Again, multivariate as well as univariate ANOVAs and chi-square tests were used for these comparisons.
Finally, to investigate the robustness and usefulness of the cluster solution found, a discriminant analysis was calculated to predict cluster membership based on predictors from the domains of cognitive status, out-of-home activity (number of physically demanding activities, number of cognitively demanding activities), health-related variables (subjective movement ability, perceived independence, bodily role limitations), indoor–outdoor motivation, and socio-demographic measures (age, country, marital status, gender). IBM SPSS Statistics 20 was used for all statistical analyses. Effects reaching a significance level below p = .10 will be considered as marginally significant effects.
Results
Identifying and Describing Mobility Clusters Based on GPS-Indicators
The cluster analysis resulted in a three-cluster solution. Due to missing data, only 243 of the original 257 cases could be categorized into clusters. Cluster sizes were n1 = 117, n2 = 62, and n3 = 64, respectively. Comparing the clusters regarding the mobility indicators using multivariate analysis of variance, the difference between the three groups was clearly significant. Differences between clusters in the mobility measures are illustrated in Figure 1. Univariate ANOVAs with every single mobility indicator as dependent variable were all highly significant, with effect sizes in a range between partial η2 = .11 and partial η2 = .59. Thus, following the classification of Cohen (1977), all effect sizes but one were large. Specifically, the mean number of places visited and the average amount of time spent out of home were significantly different between all three clusters. Cluster 2 had the highest levels in these measures, whereas Cluster 1 had the lowest scores. On average, the difference between Clusters 2 and 1 in time spent out of home per day was more than 3 hr, which is more than one standard deviation of the total sample’s distribution in time out of home. Cluster 2 also visited about two places more per day on average compared with Cluster 1. The effect sizes for the group differences were partial η2 = .35 for time spent out of home and partial η2 = .41 for the number of visited places, which implies large effects for both global out-of-home mobility indicators.
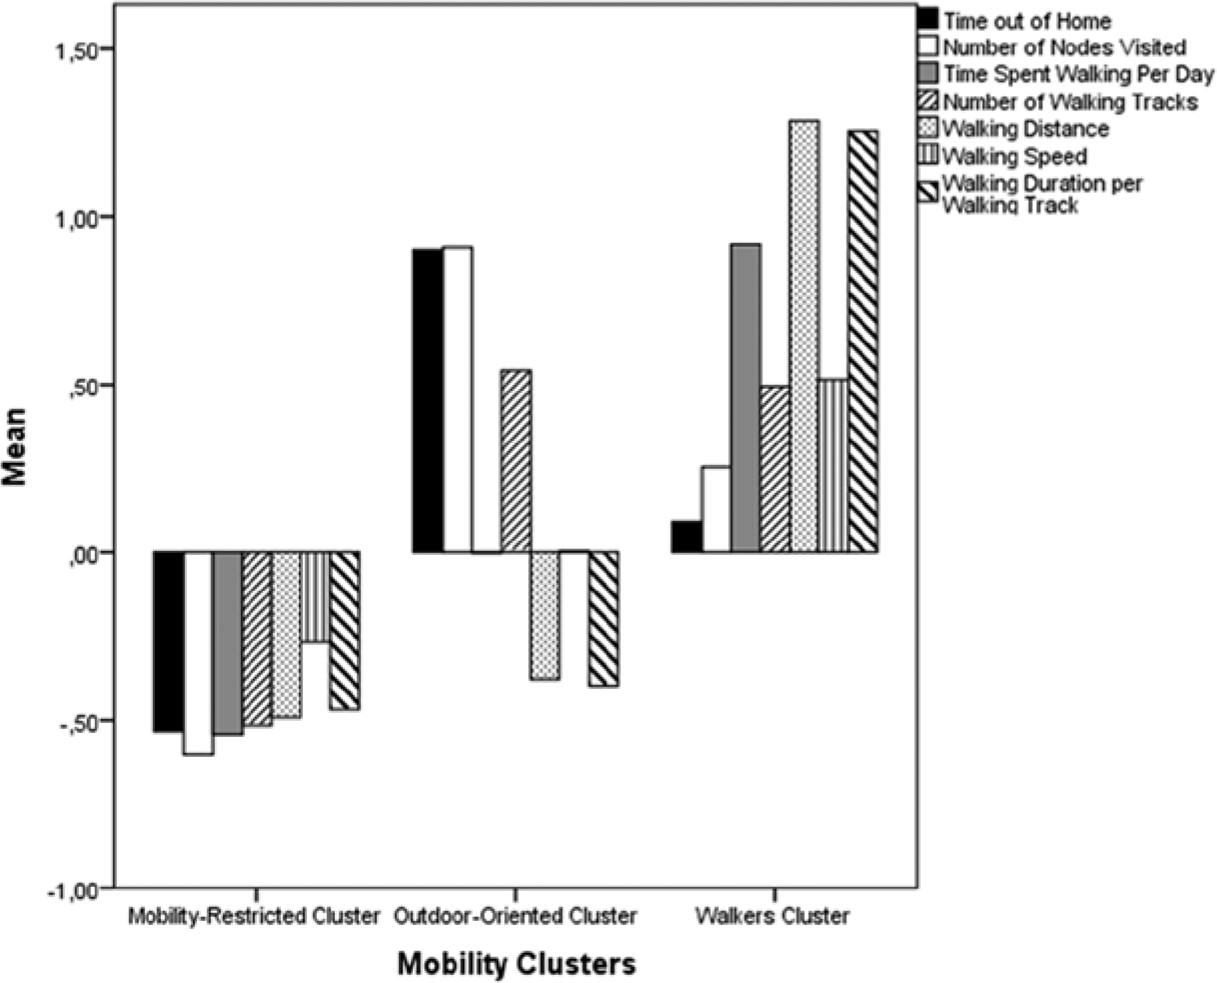
Mobility clusters and their mean scores on different mobility indicators.
The three groups also significantly differed in walking indicators: Cluster 3 had the highest amounts of time spent walking, and Cluster 1 was again the group with the lowest levels. The number of walking tracks per day was also significantly lower in Cluster 1 as compared with Clusters 2 and 3. Regarding walking distance, walking speed, and walking duration, Cluster 3 had significantly higher mean values than Clusters 1 and 2, which were not different from each other. Effect sizes for group differences in all walking indicators were consistently large (partial η2s > .25), with the exception of a medium effect size (partial η2 = .11) for walking speed. The highest effect size (partial η2 = .59) was found for walking distance, with a mean walking distance for Cluster 3 (M = 1.46 km), which was more than 3 times higher than the mean for Cluster 1 (M = 0.46 km).
To summarize the differences between the mobility types identified, we found, as expected, consistently significant differences between the three clusters in all mobility variables, with strong effect sizes for all group differences but one. Cluster 1 (n = 117) had generally low levels in all mobility indicators and was therefore labeled the “mobility-restricted” cluster. Cluster 2 (n = 62) showed high amounts of time spent out of home and a high number of places visited and therefore represented the group of “outdoor-oriented” individuals. Finally, individuals in Cluster 3 (n = 64) were highly engaged in walking and were considered as the group of “walkers.”
Separating all three clusters by a discriminant analytic approach using the mobility indicators as predictors resulted in two significant discriminant functions that separated well between the three clusters. Predicting cluster membership by the discriminant functions resulted in correct classifications for 96.3% of all cases. Wilks’s lambda, indicating the proportional amount of between-groups variance not accounted for by the mobility indicators, was .16, which implies that the predictors discriminated well between groups. However, this goodness of discrimination is hardly surprising as predicting cluster membership based on the variables that were already used for building the clusters is, to some degree, a tautologic proceeding. Clusters are usually created in a manner that results in groups that are highly different from each other regarding the variables used for the cluster analysis. However, the differences of high effect sizes between mobility groups regarding indicators of mobility as well as the goodness of the mobility discriminant functions give a first hint that the identified clusters are meaningful. We will additionally compare the mobility clusters in domains other than mobility and conduct a discriminant analysis using alternative variables to investigate which variables are the best in discriminating between the three identified types of out-of-home mobility.
Characterizing Mobility Types Based on Socio-Demographic Indicators, Cognitive Status, Health-Related Outcomes, Out-of-home Activities, and Indoor–Outdoor Motivation
In the following, we describe, based on univariate ANOVAs as well as chi-square tests, whether and to what degree the mobility types identified differed from each other in activity-related, socio-demographic, and health-related domains, as well as in their indoor–outdoor motivation and their composition of cognitive status groups (Tables 1-3).
Differences Between Clusters in Out-of-Home Activity and Indoor–Outdoor Motivation.
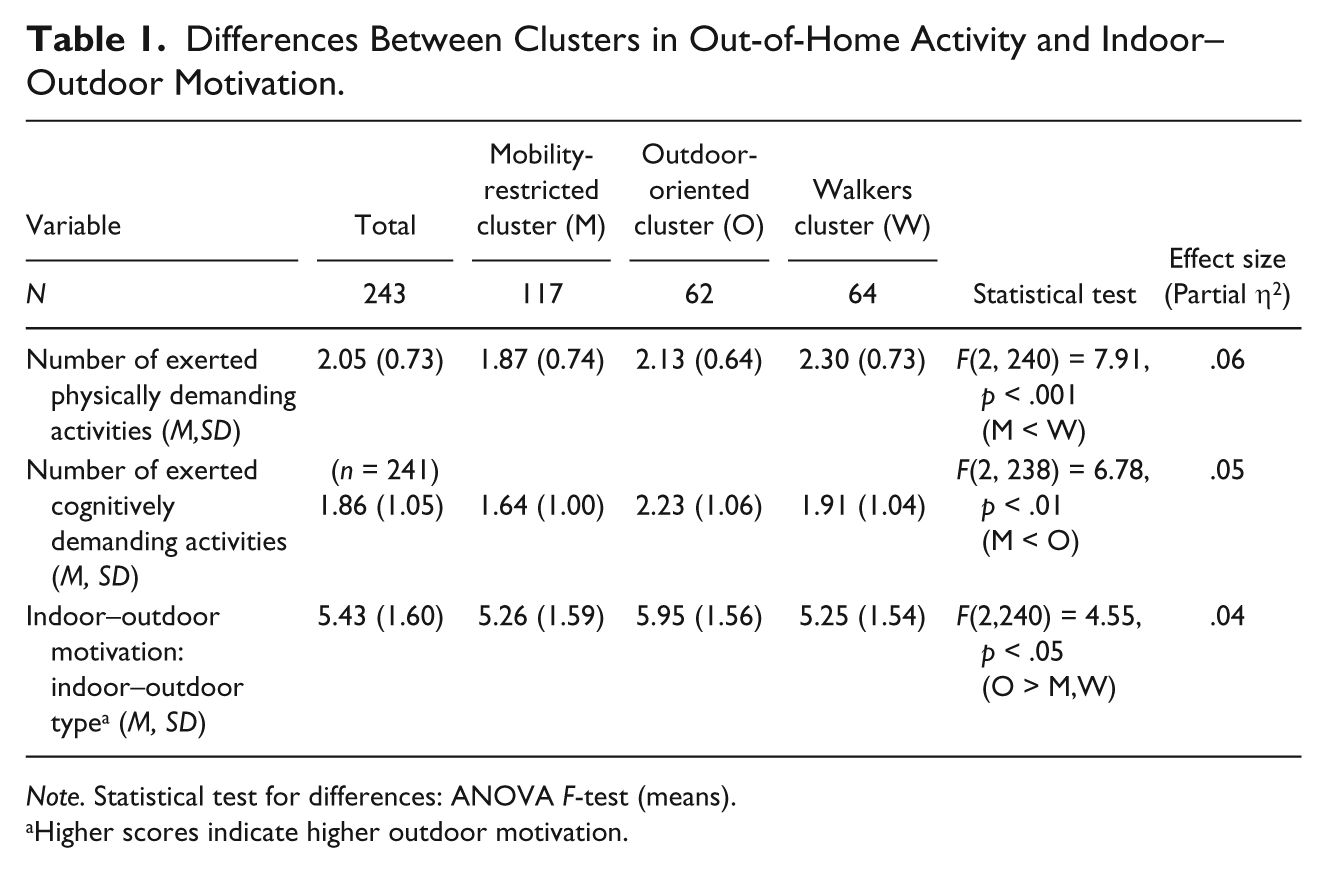
Note. Statistical test for differences: ANOVA F-test (means).
Higher scores indicate higher outdoor motivation.
Differences Between Clusters in Socio-Demographic Measures and Cognitive Status.

Note. Statistical test for differences: ANOVA F-test (means) and chi-square test (frequencies). CH = Cognitively healthy control persons, MCI = Persons with mild cognitive impairment, DAT = Persons with early-stage dementia of the Alzheimer’s type.
Not married includes divorced, widowed, or single.
Differences Between Clusters in Health-Related Outcomes.
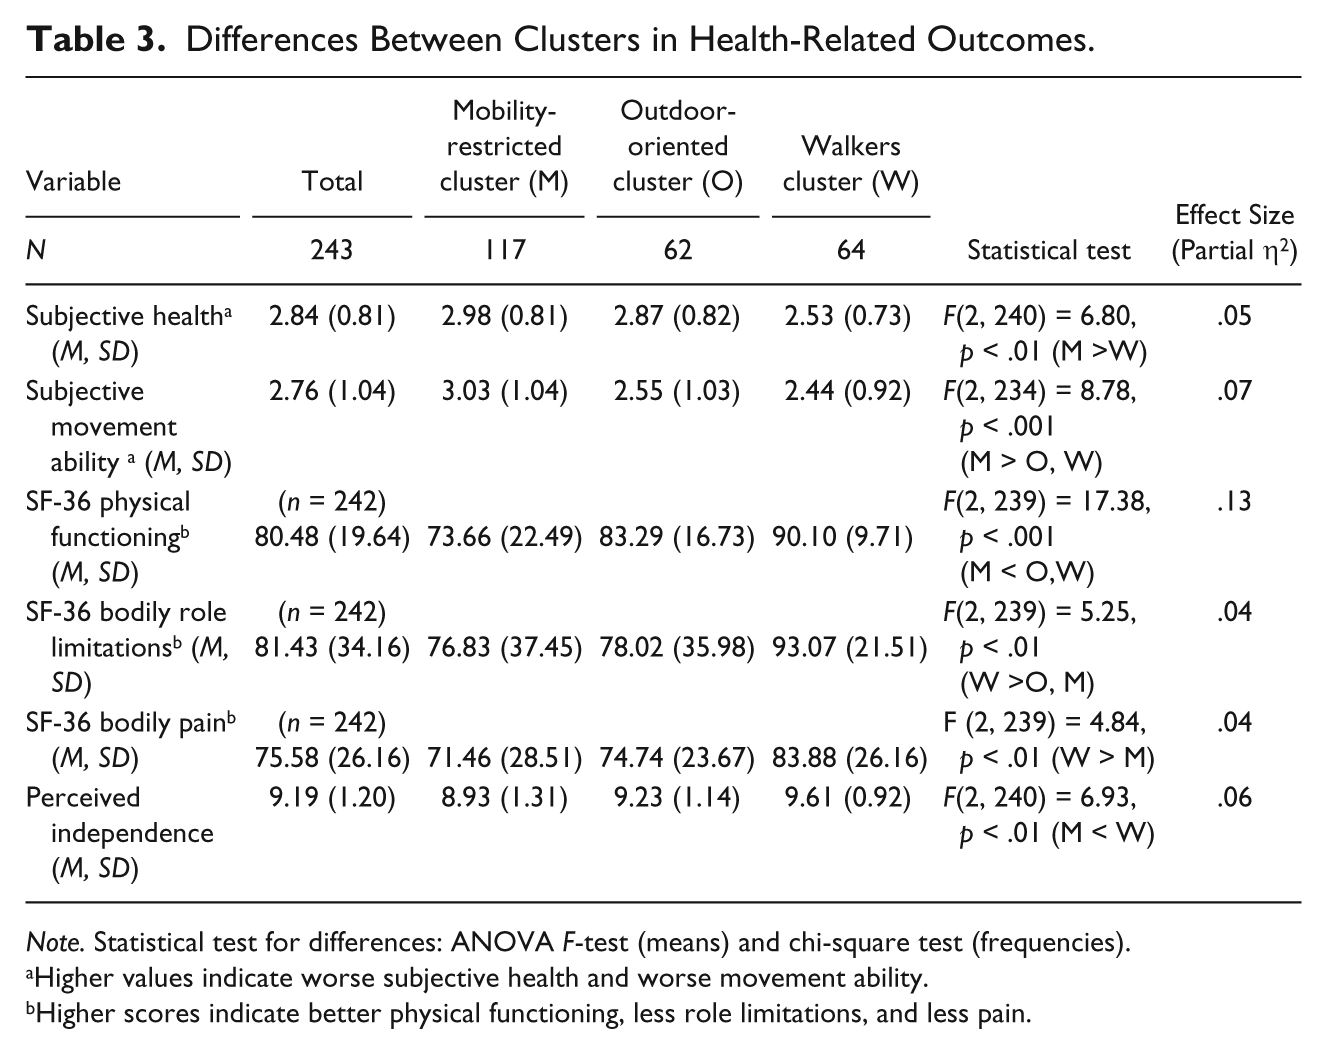
Note. Statistical test for differences: ANOVA F-test (means) and chi-square test (frequencies).
Higher values indicate worse subjective health and worse movement ability.
Higher scores indicate better physical functioning, less role limitations, and less pain.
Differences in self-reported out-of-home activity and indoor–outdoor motivation
Significant group differences in out-of-home activity were found indicating reduced activity engagement in the mobility-restricted cluster (Table 1). This group was significantly less cognitively active than the outdoor-oriented cluster and significantly less physically active than the walkers cluster. Both group differences were in a medium effect size range (partial η2 = .05 and .06).
Indoor–outdoor motivation was also significantly different between groups. Not surprisingly, the outdoor-oriented cluster, which is the group with the highest amounts of time spent out of home, reported significantly higher outdoor motivation than the other groups. However, this effect was small (partial η2 = .04), and all group means were rather close to the scale midpoint, which indicates that most study participants equally liked staying at home and being out of home and reported no clear indoor versus outdoor preference.
Differences in socio-demographic indicators and cognitive status
A significant relationship between country and cluster membership was found (Table 2): The majority of all Israeli individuals (62%), but only 38.2% of the German older adults, belonged to the mobility-restricted cluster, whereas about 37% of the German study participants belonged to the walkers cluster and only 11% of the Israeli subsample. About every fourth of the Germans and the Israelis belonged to the outdoor-oriented cluster.
Mobility groups also significantly differed in age: The mobility-restricted cluster was significantly older (M = 75.3, SD = 6.6) than the outdoor-oriented cluster (M = 70.0, SD = 5.1) and the walkers cluster (M = 71.9, SD = 5.3), which were not significantly different from each other. The effect size of the age difference between groups (partial η2 = .13) was medium to large. Notably, the mean age difference between the mobility-restricted group and the outdoor-oriented group was more than 5 years, which is close to one standard deviation of the age distribution of the total sample.
Moreover, the relationship between gender and cluster membership reached significance: More than 50% of all women, but only 43.9% of all men, belonged to the mobility-restricted cluster. Only 17.5% of all women were in the walkers cluster, whereas the percentage of men in this cluster was clearly higher (35%). Marital status and cluster membership were also significantly related to each other: Most of the individuals who were either living alone, divorced, or widowed (55%) belonged to the mobility-restricted group. Only a small percentage of them (13.3%) were in the walkers cluster, whereas about one third of the married individuals belonged to this cluster.
Regarding the distribution of cognitive status groups across the clusters, there was a marginally significant relationship between cognitive status and cluster membership: The majority of all DAT persons (about 66%), but less than 50% of the MCI and of the CH individuals, belonged to the mobility-restricted cluster,. Only 6.2% of the AD individuals belonged to the outdoor-oriented cluster, whereas the proportion of CH (27.7%) and MCI (30.0%) individuals belonging to this cluster was clearly higher.
Differences in health-related outcomes
Differences between groups in all health-related outcomes indicated highest health-related vulnerability in the mobility-restricted group and most favorable health levels for the group of walkers (Table 3). Specifically, the mobility-restricted group reported worse subjective health as compared with the walkers cluster and worse subjective movement ability than both the other clusters. Physical functioning as assessed by the SF-36 subscale was also lower in the mobility-restricted cluster than in both the other clusters. Mean scores in “Role limitations because of physical health problems” were highest (indicating low role limitations) in the walkers cluster, which significantly differed from the other two groups. Finally, the mobility-restricted group reported significantly more bodily pain and less subjective independence (regarding everyday activities) than the walkers cluster. Effect sizes of group differences in the health-related outcomes were in a small to moderate range (partial η2’s between .04 and .13).
Notably, all three groups had a rather good health status: Most rated their subjective health and movement ability as good, leading to consistently high mean scores. In addition, regarding subjective independence, all group means were clearly above the scale midpoint (5.0). These results might be due to sample selectivity so that population health levels are probably below the mean scores reported here. However, even within this sample of relatively healthy elders, we found meaningful differences in health-related outcomes.
Multivariate Analysis: Predicting Mobility Type by Discriminant Analysis
To investigate whether the cluster solution found is a robust one and what variables are most appropriate for discriminating between the identified mobility types, we used socio-demographic (age, country, marital status, gender) and health-related (subjective movement ability, subjective independence, bodily role limitations) predictors, as well as cognitive status, activity (number of exerted cognitively demanding activities, number of exerted physically demanding activities), and indoor–outdoor motivation as predictors of cluster membership in a discriminant analysis. Both resulting discriminant functions reached significance, with a Wilks’s lambda of .63. As can be seen in Figure 2, Discriminant Function 1 separated the mobility-restricted cluster from both the other clusters. Discriminant Function 2 discriminated between the walkers cluster and the outdoor-oriented cluster.

Scores of the mobility clusters on the discriminant functions of socio-demographic, health-related and other variables.
Age, country, subjective movement ability, subjective independence, and both activity indicators (number of cognitively and physically demanding activities) had the highest loadings on Discriminant Function 1 (Table 4), which discriminated between the mobility-restricted cluster and the other two clusters. This reflects our already reported findings that study participants within the mobility-restricted cluster were older, predominantly from Israel, and less mobile, independent, and less engaged in out-of-home activities as compared with the other groups. However, the loadings of the activity indicators on Discriminant Function 1 were lower than the respective loadings of the other variables, which means that socio-demographic indicators (age and country), subjective mobility, and subjective independence discriminate better between mobility groups than out-of-home activity.
Structure Matrix of the Discriminant Functions Composed of Socio-Demographic Indicators, Country, Health-Related Variables, Cognitive Status, Indoor–Outdoor Type, and Out-of-Home Activities.
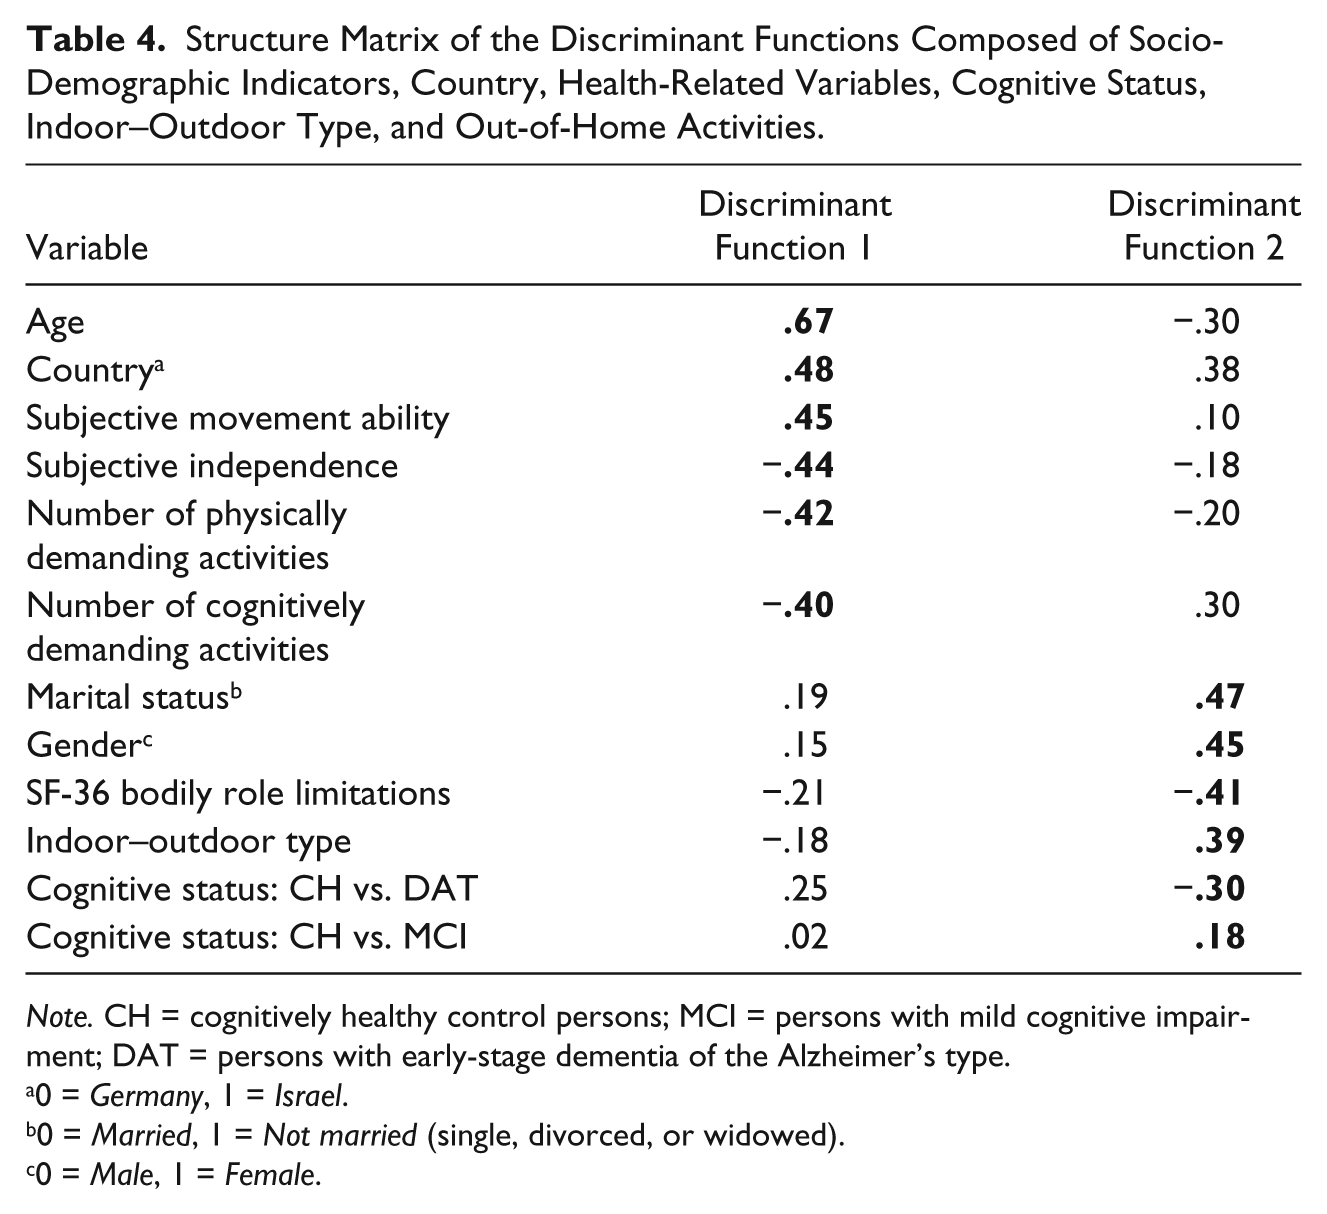
Note. CH = cognitively healthy control persons; MCI = persons with mild cognitive impairment; DAT = persons with early-stage dementia of the Alzheimer’s type.
0 = Germany, 1 = Israel.
0 = Married, 1 = Not married (single, divorced, or widowed).
0 = Male, 1 = Female.
Discriminant Function 2, which separated between the walkers cluster and the outdoor-oriented cluster, was primarily composed of the variables marital status, gender, bodily role limitations, indoor–outdoor motivation, and cognitive status. This is in agreement with our findings that the proportion of male and of married individuals was higher in the walkers cluster as compared with the outdoor-oriented cluster. Moreover, the walkers cluster reported less bodily role limitations than the outdoor-oriented group. The outdoor-oriented cluster had a higher outdoor motivation than the walkers group. Regarding the frequencies of cognitive status groups within the two clusters, the proportion of persons with DAT was higher in the walkers group, whereas relatively more MCI individuals belonged to the outdoor-oriented group. Regarding Discriminant Function 2, it should be noted that marital status, gender, and bodily role limitations had the highest loadings on this function, whereas the loadings of cognitive status (particularly the contrast CH vs. MCI) were clearly lower. Thus, in analogy to Discriminant Function 1, socio-demographic measures (e.g., marital status, gender) had the highest loadings on Discriminant Function 2 and discriminated better between mobility groups than did cognitive status.
Based on the discriminant functions, 62.4% of the cases were correctly classified in the cluster they belonged to. The rate of correct classifications was particularly high for the walkers group (67.2%), whereas only 52.6% of the individuals belonging to the outdoor-oriented group were correctly classified. Grouping all individuals into the largest cluster (the mobility-restricted cluster) led to a correct classification rate of 48.2%, so assigning the individuals to clusters by using the discriminant functions led to a clear increase in the rate of correct classifications.
Discussion
In this study, the interindividual heterogeneity of out-of-home mobility, assessed by GPS technology, was analyzed in a cognitively heterogeneous group of older adults. Based on a cluster analysis, three types of mobility were identified: Cluster 1 (n = 117) had generally low levels in all mobility indicators and thus represented the “mobility-restricted” cluster. Cluster 2 (n = 62) had high amounts of time spent out of home and a high number of places visited and was therefore named the “outdoor-oriented” group. Individuals in Cluster 3 (n = 64) were highly engaged in walking and were thus considered as the group of “walkers”. The three clusters were significantly different from each other in all mobility measures. It is notable that the cluster of mobility-restricted persons was the largest group (45.5% of the total sample). However, we chose the expression “mobility-restricted cluster” because, relative to both the other clusters, this group showed reduced mobility levels. Of course, this does not necessarily mean that individuals in this cluster were all seriously impaired regarding their everyday mobility. Moreover, the finding that more than 40% of the older adults showed rather low mobility levels has also been reported by Mollenkopf et al. (2004).
The mobility clusters identified were also different from each other in domains beyond out-of-home mobility: Regarding out-of-home activity, significant differences were found indicating reduced physical and cognitive activity engagement in the mobility-restricted cluster. Indoor–outdoor motivation was also significantly different between groups, with the highest levels of outdoor motivation in the outdoor-oriented cluster. Cluster membership was also significantly related to socio-demographic measures, such as country (62% of the Israeli persons, but only 38.2% of the Germans, belonged to the mobility-restricted cluster), age (the highest mean age in the mobility-restricted cluster), gender (the majority in the walkers cluster was male and in both other clusters female), and marital status (particularly few individuals in the walkers cluster who were widowed, divorced, or single). The relationship between country and cluster membership certainly has to be interpreted cautiously and does not necessarily reflect cultural differences in mobility patterns: As the Israeli and the German samples were different from each other regarding age and physical functioning, the higher frequency of mobility restrictions in the Israeli group might be due to the higher mean age as well as the worse health of this subsample.
Regarding the distribution of cognitive status groups across the clusters, belonging to the mobility-restricted cluster was particularly common for the DAT group (65.6%), whereas less than 10% of the DAT individuals belonged to the outdoor-oriented cluster. Groups were also different in all health-related outcomes, with differences indicating highest health-related vulnerability in the mobility-restricted group and most favorable health outcomes for the group of walkers.
To investigate the robustness of the cluster solution found and to identify those variables that discriminate best between the identified mobility types, we used socio-demographic and health-related predictors, as well as cognitive status, activity, and indoor–outdoor motivation as predictors of cluster membership in a discriminant analysis. Both resulting discriminant functions were significant. Based on the discriminant functions, 62.4% of the individuals were correctly classified in their respective cluster. Discriminant Function 1 separated the mobility-restricted cluster from both the other clusters. Discriminant Function 2 discriminated between the walkers cluster and the outdoor-oriented cluster. Age, country, subjective movement ability, subjective independence, and the activity indicators (number of cognitively and physically demanding activities) had the highest loadings on Discriminant Function 1, whereas Discriminant Function 2 was primarily composed of the variables marital status, gender, bodily role limitations, indoor–outdoor motivation, and cognitive status. Interestingly, the loadings of the activity indicators and of cognitive status on their respective discriminant functions were lower than the respective loadings of the other variables, which means that the contribution of socio-demographic indicators and health-related outcomes for the prediction of cluster membership is higher than the impact of out-of-home activities and cognitive status. This is in agreement with our findings that cognitive status groups are not significantly different from each other in measures of out-of-home walking behavior and that MCI individuals are similar to CH older adults in most other out-of-home behaviors beyond walking (Wahl et al., 2012; Wettstein et al., 2012). Most of the mobility measures included in this study were indeed measures of walking, which might not be optimal for a discrimination between cognitive groups: Our study participants walked at a self-determined and presumably comfortable speed, which is less cognitively demanding than walking as fast as possible. Moreover, we suppose that participants mostly walked in their familiar everyday environments so that their walking activities corresponded to rather routine-like actions that were not highly cognitively challenging and, therefore, still feasible for all cognitive impairment groups. More complex mobility performances might be more cognitively demanding and thus more closely related to cognitive abilities and cognitive impairment status. Therefore, the mobility profiles identified in this study seem to be more dependent on socio-demographic (such as age) and health-related measures than on cognitive impairment status.
Although cognitive status may not be the most important variable for the discrimination between mobility clusters, our findings clearly confirmed our expectation that the risk of belonging to the mobility-restricted cluster was substantially higher for demented persons (66%) than for cognitively healthy individuals (44%) or older adults with MCI (48.6%). On the other hand, the majority within all groups and of the total sample (48.1%) belonged to the mobility-restricted cluster, regardless of cognitive status. This is in accordance with previous findings that reported a higher risk of mobility impairments and reduced general mobility (Leveille et al., 2000; Mollenkopf et al., 2004), restricted action ranges (Barnes et al., 2007; Peel et al., 2005), and reductions in walking speed (Abreu & Caldas, 2008; Shumway-Cook et al., 2007; Steffen et al., 2002), as well as in walking stability (Menz et al., 2003) in old age.
Our assumption that restricted mobility goes along with worse health, as previous research has already shown (Bendall et al., 1989; Clark et al., 1998; Murata et al., 2006), was also confirmed by our findings. Regarding the characteristics of individuals who exhibit restricted mobility levels, we found that this group did not only report worse health but also tended to be older (more than 5 years than the outdoor-oriented group, on average) and to show lower cognitive functioning than the other groups. Similar findings, also based on a cluster-analytic approach, have been reported by Mollenkopf et al. (2004). Other studies have also reported more restricted mobility performances and, particularly, life spaces with advancing age (Barnes et al., 2007; Murata et al., 2006; Peel et al., 2005).
We also found a relationship between gender and cluster membership: The proportion of women in the walkers cluster was particularly low. This result could be due to the fact that generally, more older women report mobility limitations than men (Leveille et al., 2000). Moreover, women generally tend to have more restricted action ranges as compared with men (Barnes et al., 2007).
Our findings also reflect that out-of-home mobility tends to be restricted when facing cognitive impairments and particularly early stages of dementia (Wettstein et al., 2012). Specifically, more than 60% of all demented individuals belonged to the mobility-restricted group, whereas the percentage of CH individuals and of MCI persons belonging to this group was below 50%. It is possible that cognitive resource loss and, particularly, the occurrence of cognitive impairments such as dementia complicate out-of-home mobility because cognitive resources necessary for certain mobility performances are no longer available. This may result in restricted mobility. In this regard, the provision of safe and supportive environments together with easy-access solutions for orientation and help that reduce the cognitive demands of out-of-home mobility may allow to maintain walking and other mobility-related activities according to one’s own preferences and habits as long as possible. However, caution is needed regarding this conclusion as this study was based on cross-sectional data so that we do not know for sure whether dementia really leads to declines in out-of-home mobility. It might also be the case that restricted mobility is a risk factor for cognitive impairment and decline as has been proposed by other studies (James, Boyle, Buchman, Barnes, & Bennett, 2011). Future research is needed to investigate whether certain patterns of mobility, rather than focusing on general mobility levels, could serve as a diagnostic tool by predicting the later onset of cognitive impairment or prospective cognitive decline.
Our study has several limitations. Given the small sample of DAT individuals, the cluster solution found may be more representative for CH older adults who were the largest group in our sample. However, even if CH individuals were the majority of our sample, we consider the inclusion of older adults with cognitive impairments as a noteworthy strength of this study. Many previous studies have completely neglected the role of cognitive impairment for mobility and mobility patterns although the prevalence of cognitive disorders such as dementia markedly increases with advancing age (Baltes & Smith, 2003).
Due to the limited sample size, a cross-validation of the cluster solution was not feasible so that the robustness of the three-cluster pattern may be questionable. However, we found considerably large effect sizes when comparing the resulting clusters regarding mobility measures which is indicative of the usefulness and “strength” of the cluster solution. Predicting cluster membership based on the mobility indicators also led to a good discriminatory solution. Moreover, we could show that the clusters also systematically differed in measures beyond mobility, and cluster membership could be predicted based on these measures. Thus, the cluster solution is not just an “artificial” one, but differences in mobility patterns go along with meaningful differences in socio-demographic characteristics, health, activity, outdoor motivation, and cognitive impairment status.
Another limitation of this study is that our cross-sectional study design does not allow drawing causal conclusions regarding the described relationships between mobility patterns and other characteristics. Finally, only self-reported health measures were available in this study so that the role of objective health for patterns of out-of-home mobility could not be addressed. However, as already mentioned, subjective health, even if assessed by one item only, has been shown to be a valid measure and a good proxy for objective health (Idler & Benyamini, 1997; Pinquart, 2001). The same is true for the SF-36 subscales, which have been used in this study to assess health as well as health-related quality of life (Bullinger & Kirchberger, 1998).
To summarize, our findings clearly imply that mobility patterns in old age continue to be considerably heterogeneous. Our aim was not only to determine the amount of heterogeneity in out-of-home mobility but also to investigate what subtypes of mobility contribute to this heterogeneity. Specifically, we identified three types of older adults’ mobility patterns based on cluster analysis: one group of older adults who showed reduced levels in all mobility indicators, another group who spent much time out of home and visited many places, and a third group with a particularly high engagement in walking activities. We also found consistent correlates of the different mobility profiles: Cognitive impairment status was related to mobility group membership, with a particularly high proportion of cognitively impaired individuals in the mobility-restricted cluster. Moreover, exhibiting restricted mobility patterns was also associated with higher age, worse health outcomes, and a lower out-of-home activity level.
Footnotes
Acknowledgements
We would like to thank our geography partners in Germany—in particular, Dr. Tim Freytag—for their valuable support regarding the GPS/GIS data collection. Heike Hercher provided the expert rating for distinguishing cognitively and physically demanding activities in her master’s thesis in psychology. In addition, we would like to thank Katharina Hager, Heike Hercher, Johanna Martinez-Slebi, Hannah Schmidt-Friderichs, Elke Voss, and Florian Wernicke for great support in collecting and processing the data of the project. We are also very thankful to the older adults involved in the study.
Declaration of Conflicting Interests
The authors declared no potential conflicts of interest with respect to the research, authorship, and/or publication of this article.
Funding
The authors disclosed receipt of the following financial support for the research, authorship, and/or publication of this article: This work was supported by the German Research Foundation from 2008 to 2011, based on a grant to Hans-Werner Wahl (WA809/11-1).