
Abstract
The purposes of this article are to review the psychometric properties of the Lubben Social Network Scale–6 (LSNS-6) and to determine its utility in assessing social networks of an older adult community sample. We tested the LSNS-6 with Rasch methodology using a sample of 196 older adults, aged 55 and above who live in public and subsidized housing facilities. Rasch analysis showed unidimensionality of the overall scale, high person and item reliability, and good fit of individual items with one exception. Principal component analysis (PCA) of Rasch model residuals suggested family and friend subdimensions. Response categories demonstrated improvement when six categories were collapsed to four. A person-threshold map indicated ceiling and floor effects due to lack of items measuring less and more developed social networks. Recommendations provided in this article can make the LSNS-6 more psychometrically sound and useful in research and practical contexts.
Research shows social networks affect the health and well-being of older adults (Cornwell & Waite, 2009). While social networks are considered to be antecedents to social support, they do provide a model or pathway for social support to occur (Langford, Bowsher, Maloney, & Lillis, 1997). Small or nonexistent social networks can lead to social isolation, which can pose health risks (Cornwell & Waite, 2009). A lack of social networks has been shown to be related to a range of negative health outcomes for older adults, including loneliness, depression, lack of self-esteem, higher risk of disability, poor recovery from illness, and early death (Lubben et al., 2006; Tomaka, Thompson, & Palacios, 2006). In many cases, the size of older adults’ social networks may suffer due to limited physical mobility and resources (e.g., lack of transportation, financial resources, and access to and skills to use new communication technologies; Kobayashi, Cloutier-Fisher, & Roth, 2009; Slegers, van Boxtel, & Jolles, 2007).
Questions have been raised about the impact of widespread use of Internet-based communication technologies and social networking sites on social relationships (Hampton, Goulet, Rainie, & Purcell, 2011). There is particular concern that these technologies may isolate people. This concern is especially strong for older adults whose computer and Internet use rates are coming to parity with the overall population (Zickuhr & Madden, 2012). Some of the research on this issue, however, is encouraging. For example, Jung et al. (2010) found that the use of virtual communication technology can improve older adults’ social networks. More recently, a European multi-country study found that social isolation is lower among Internet users aged 65 and above and that personal social meetings and virtual contacts are complements rather than substitutes (Lelkes, 2012). Researchers agree, however, that little is known of how such technologies affect social networks (Jung et al., 2010). Be these findings as they may, the research in this area is limited, fragmented, and suffers from lack of theoretical guidance and consistency in measurement of the various related constructs. Instruments must be developed or modified and validated for use related to virtual communication (Lubben, 1988). As technology and the way we communicate change, so must our ability to measure their effects.
One of the widely used measures of older adults’ social networks is an abbreviated version of the Lubben Social Network Scale–6 (LSNS-6; Lubben & Gironda, 2000). The 6 items in the LSNS-6 were derived from the full 10-item Lubben Social Network Scale (LSNS-10), which was developed from the Berkman–Syme Social Network Index (BSNI) that measures social networks through marital status, relationships with family and friends, church membership, and participation in community groups (Berkman, 1977).
Psychometric properties of the LSNS-6 have been evaluated through classic test theory, factor analysis techniques, and internal consistency measures such as Cronbach’s alpha (Crooks, Lubben, Petitti, Little, & Chiu, 2008; Lubben et al., 2006). In one study, the internal consistency coefficient was 0.83 across participants in three European cities, with a sample of 7,432 older adults (Lubben et al., 2006). In another study with a sample of 2,249 older adult members of a health maintenance organization, the internal consistency coefficient was 0.84. Factor loadings in both studies were shown to separate according to items relating to family and friends (Crooks et al., 2008; Lubben et al., 2006).
Although these studies have evaluated various psychometric properties of the LSNS-6, they are limited in scope, and other methodological issues need to be examined. First, classical factor analysis focuses on examination of the instrument overall (Merbitz, Morris, & Grip, 1989). Tools such as factor analysis cannot measure coverage (i.e., whether an instrument can measure the entire range of trait levels of persons in a sample), functional aspects of individual items in an instrument, and rating scale structure (Merbitz et al., 1989). Second, it is problematic to treat values assigned to ordinal response categories as true numerical values with equal intervals without validating the property (Grimby, Tennant, & Tesio, 2012). Reporting the sum or average of raw ordinal scores without evaluating equidistance property and making inferences using parametric analysis may lead to faulty conclusions (Baylor et al., 2011; Maxwell & Delaney, 1985; Svensson, 2001).
Rasch Analysis
A solution to these measurement issues is Rasch analysis. Rasch analysis provides more psychometric tools and information than does classical test theory. Ordinal scores are transformed into interval-level data, which allows for valid use of mathematical operations and parametric analysis and provides a truer depiction of a trait (Baylor et al., 2011). An important feature of Rasch modeling is that it is possible to directly compare person locations and item locations on the same metric scale (Bond & Fox, 2007). A person location refers to the extent of a latent trait that a person has, and an item location is the level of the trait expressed by an item on the trait range (Baylor et al., 2011). In addition, Rasch analysis provides various tools that enable examination of key properties of ordinal measures including unidimensionality, item and person fit, person and item separation and reliability, and coverage and targeting (Baylor et al., 2011).
The Rasch model for dichotomous items is expressed in a linear scale composed of log odds units (logits) and uses one parameter, item location, to explain the relationships between an item, a person’s underlying trait, and a person’s response to the item (Baylor et al., 2011). The likelihood that an individual will endorse a specific item is a logistic function of the distance between person location and the item location on a common metric (logit) scale. With the logit scale, unit intervals between locations on the line have a consistent value (Bond & Fox, 2007). Zero logits represent the mean of item locations. A person location on a linear line is equal to an item’s location when the person has a 50% chance of affirming the item (Bond & Fox, 2007). The most complete information about an individual’s latent trait is obtained where a person location meets the item location. In other words, an item is most effective in estimating trait levels of persons (or most sensitive in discriminating person locations), whose person locations are at or very near the item location (Baylor et al., 2011).
The Rasch model can be generalized to polytomous items with ordered response categories such as those in Likert-type scales (Ostini & Nering, 2006). In polytomous models, ordered response categories are treated as latent dichotomous items combined together (Ostini & Nering, 2006). It is assumed that respondents make simultaneous, dichotomous choices for each response category in answering questions with multiple categories (Andrich, 1978). Rasch analysis of ordered polytomous data can use either a partial credit model (PCM) or a rating scale model (RSM). The PCM can handle the situation where different items have different numbers of response categories in a scale (Bond & Fox, 2007). In the RSM, all items in a scale should have the same number of categories and the distances between thresholds (the points where two adjacent categories are equally probable) are consistent across all items (Andrich, 2011; Ostini & Nering, 2006). The RSM is useful for obtaining reliable estimates from insufficient data (e.g., as in sparse rating-type data or data with a small sample size) because the model has fewer parameters to estimate compared with the PCM (Ostini & Nering, 2006).
Article Aims
The aims of this article are to (a) use Rasch analysis to describe psychometric properties of the LSNS-6 and (b) evaluate the utility of the LSNS-6 in assessing social networks of an older adult community sample.
Method
Project and Participants
This study uses baseline data collected to evaluate a pilot project that aimed to assist low-income seniors and people with disabilities in engaging in regular and sustained computer and Internet use. The project provided the participants with a comprehensive program for computer engagement that included individualized computer training, permanent access to subsidized computers, technical support, and free Internet access. In this article, responses to six LSNS-6 questions were analyzed, which were part of a survey questionnaire that also asked participants’ demographic characteristics and computer and Internet use.
The participants were 196 adults aged 55 and older, living in 12 low-income senior housing facilities or in surrounding neighborhoods in Northern Illinois. The buildings are public and Section-8 housing facilities selected to be representative of the spectrum of such facilities across the United States. They are located in several large Northern Illinois cities, surrounding counties, as well as several smaller suburban cities and rural towns. Adults aged 55 and older were defined as older adults, in accord with the U.S. Department of Housing and Urban Development’s definition of “senior” (U.S. Department of Housing and Urban Development, n.d.). Only seniors who chose to participate in the computer and Internet training program and completed the consent process participated in the study. The university institutional review board reviewed the research protocol, including the consent process Office of Research Compliance (ORC).
Instrument
The LSNS-6 questions ask about the number of relatives and friends one sees or hears from at least once a month, feels close enough to call on for help, and feels at ease enough to talk about private matters. The six questions have the following 6-point Likert-type response choices: 0 = none, 1 = one, 2 = two, 3 = three or four, 4 = five through eight, and 5 = nine or more. The sum of six item scores (ranging from 0 to 30) is used to measure the extent of overall social connectedness, and the sum of each three family-related item scores and three friend-related item scores (each ranging from 0 to 15) is used to evaluate kinship ties and nonkinship ties, respectively (Lubben et al., 2006).
Analysis
Data were analyzed using WINSTEPS computer software, Version 3.74 (Linacre, 2009) to produce various Rasch statistics. The rating scale model (RSM) was used because all items had the same number of categories and category values, and a parsimonious model was preferred due to the small sample size. Specifically, the following psychometric characteristics were evaluated.
Unidimensionality
Unidimensionality is satisfied if each item in an instrument assesses a somewhat different aspect of an underlying trait, but still assesses the same trait (Bond & Fox, 2007). Rasch modeling provides various means of testing unidimensionality including fit statistics and principal component analysis (PCA) of Rasch model residuals (Bond & Fox, 2007). To determine dimensionality, two fit statistics, mean square residuals and standardized z scores, are used (Bond & Fox, 2007). Generally, mean square residuals from 0.60 to 1.40 and standardized z scores less than 2.0 are considered acceptable for rating scale data (Wright & Linacre, 1994).
PCA of Rasch model residuals also helps determine an instrument’s dimensionality through examination of the distribution and variance of residuals (Wright, 1996). If there are noticeable patterns in a residual contrast plot, the meaning of the patterns and the strength of the contrast should be examined to determine whether those patterns suggest a secondary dimension that could threaten unidimensionality (Linacre, 2012).
Item and person fit
Item fit is examined to assess whether individual items contribute to a unidimensional trait that is measured by an instrument (Smith, Conrad, Chang, & Piazza, 2002). In a good fitting item, its higher response category should be more likely to be endorsed by persons with a higher level of a latent trait than by persons with a lower level of a latent trait as predicted by a Rasch model (Smith et al., 2002). Person fit assesses whether an individual person responds to items in a manner as predicted by a Rasch model (Smith et al., 2002). A person with a given level of a latent trait is expected to show a greater probability of choosing higher response categories on items at lower locations than on items at higher locations (Smith et al., 2002). To be considered misfitting, an item or a person should show infit statistics that surpass both mean square residuals and standardized z scores criteria (MNSQ > 1.40 and ZSTD > 2.00; Wright & Linacre, 1994).
Person separation and person reliability
The person separation index and person reliability provide information on whether the full range of persons’ latent traits is measured. Person separation index assesses the spread of persons across the trait continuum (Wright & Masters, 1982). Instruments should have a separation index ideally exceeding 2.0 to be effective. Higher separation index values indicate greater spread of persons along the continuum. Low person separation may indicate that the instrument cannot differentiate between individuals with lower and higher latent trait levels. Separation index is used in calculating the number of statistically significant trait level groups (strata) into which the sample of persons can be separated (Bond & Fox, 2007; Wright & Masters, 1982). The formula for calculating the number of strata is HP = (4GP + 1) / 3, where HP is the number of strata, and GP is the person separation index (Wright & Masters, 1982). Person reliability is conceptually equivalent to Cronbach’s alpha. A person reliability of 0.70 is considered acceptable, and 0.80 or higher is considered good (Duncan, Bode, Lai, & Perera, 2003).
Rating scale utilization
The rating scale itself can be examined for its stability and accuracy, including the utility for specific response categories (Bond & Fox, 2007). Three criteria established by Linacre (2002) to determine the functioning of a rating scale include 10 observations per rating category, measures that increase linearly with each category, and mean square residuals between 0.60 and 1.40. Figures illustrating the alignment of thresholds and category characteristic curves also help evaluate whether response categories correspond to reasonable intervals on the latent trait continuum and whether thresholds are ordered (Andrich, 2011). If two adjacent thresholds are too close or there is a category that is hardly a mode (i.e., no peak for the category in category characteristic curves), it suggests two adjacent categories represent too narrow intervals on the latent trait and one of the response categories is rarely chosen by respondents (Linacre, 2002). Generally, thresholds should be at least 1.4 logits apart, but not greater than 5 logits apart (Linacre, 2002). Based on results of these evaluations, collapsing, omitting, or adding response categories can be considered (Kim & Hong, 2004; Linacre, 2002).
Item hierarchy
Person-item maps generated in Rasch analysis help visual examination of item hierarchy (Bond & Fox, 2007). For dichotomous items, those representing higher levels of a trait are plotted at higher locations, and individuals with lower levels of a latent trait are located at lower levels of the scale. The mean person location and dispersion of person locations suggest to what extent the items are targeted to the persons (Pallant & Tennant, 2007). A positive mean person score indicates that the sample has higher levels of a latent trait than the items measuring the construct, whereas a negative mean person score signifies that the sample has lower levels of a latent trait than the items (Tennant & Conaghan, 2007). With a well-targeted measure, the mean person location and the mean item location should be approximately at zero logits, and the items should be spread evenly across person locations (Tennant & Conaghan, 2007). For polytomous items, a person-threshold map is informative in examining the distribution of persons and items. It indicates all threshold locations of each polytomous item along with person locations (Linacre, 2014).
Gaps (i.e., lack of items) on the hierarchy will lead to less precise measurement of persons at these trait levels. For example, if there are not enough items at the top of the instrument, it cannot distinguish among persons with high trait levels. Similarly, if there are not enough items toward the bottom, the instrument cannot distinguish among persons with low trait levels. The former is called a ceiling effect, and the latter, a floor effect (Pomeranz, Byers, Moorhouse, Velozo, & Spitznagel, 2008).
Results
Participant Sociodemographic Information
Table 1 provides participants’ sociodemographic information. It shows that the sample of 196 older adults had a mean age of 65 (ranging from 55 to 88 years). The sample was mainly female (66%, n = 129). Thirty-two percent of the sample had obtained a General Educational Development (GED) certificate or high school degree (n = 62), and 40% (n = 78) had completed some college or a college degree. Just over half of the participants were White (53.1%) while 44.3% were African American. Only 1.9% of the sample was Hispanic, and 0.7% was Native American. There was little diversity in income level. Since the study took place in public and subsidized housing facilities, the income distribution was homogeneous with all of the participants earning US$15,000 or fewer in 2011.
Sociodemographic Characteristics (n = 196).

Note. GED = General Educational Development.
M = 65, SD = 8.47.
Unidimensionality
Summary statistics fell within acceptable ranges (0.6 < MNSQ < 1.40 and ZSTD < 2.00; Wright & Linacre, 1994) for examination of overall fit. In Table 2, two rows at the bottom show that mean square residuals infit and outfit statistics were both 0.99 with small standard deviations (0.25), and standardized z scores were both −0.20.
Item Location Statistics in Misfit Order of the LSNS-6.

Note. 0 = zero, 1 = one, 2 = two, 3 = three or four, 4 = five to eight, 5 = nine or more. LSNS-6 = Lubben Social Network Scale–6; MNSQ = mean square; ZSTD = standardized z scores; EXP = expect.
Sum of item responses by participant.
Number of participant responses per item.
Item location in logits.
Percentage of data points within 0.5 points of their expected value.
Percentage of data points predicted to be within 0.5 points of their expected value.
PCAs of the Rasch model residuals showed that, while the scale reflected a strong single factor accounting for 53.3% of the item response variance, there was evidence of subdimensions with the item residuals. The first component had an eigenvalue of 2.8 (i.e., explains 2.8 items of residual variance) and accounted for 46.3% of the residual variance.
Item and Person Fit
Most individual items and persons showed good fit. For person fit, summary of the 178 nonextreme persons proved to be in the expected ranges (infit 0.99 MNSQ, −0.30 ZSTD; outfit 1.00 MNSQ, −0.30 ZSTD; results not shown). Table 2 provides information on item locations (scored in logits in the “Measure” column) in misfit order. The first item listed (“how many relatives do you see or hear from at least once a month?”) had the highest misfit statistics and was the only misfitting item by fit criteria (0.6 < MNSQ < 1.40 and ZSTD < 2.00; Wright & Linacre, 1994).
The two columns under the “Exact Match” category refer to how predictable or random individual items are, when considering the overall model. The “OBS%” column indicates the percentage of data points within 0.5 points of their expected values, and the “EXP%” column refers to the percentage of data points that are predicted to be within 0.5 points of their expected values. This suggests that OBS% scores, which are less than EXP% scores, indicate data are more random than predicted, whereas OBS% scores, which are more than EXP% scores, indicate data are less random than predicted (Alagumalai, Curtis, & Hungi, 2005). Other than Items 1 and 4, which also demonstrated the highest misfit, OBS% scores were greater than EXP% scores, indicating greater predictability. The mean scores (44.7 OBS%, 40.2 EXP%) and relatively small standard deviations (5.8 OBS%, 0.4 EXP%) suggest that overall the data were congruent with model predictability.
Person and Item Reliability and Separation
Our testing of reliability indicated good internal consistency of the instrument. Rasch person reliability measurement yielded an acceptable score of 0.80 (including both extreme and nonextreme persons), in comparison with the Cronbach’s alpha of 0.84. Moreover, the item reliability statistic was very high (0.95), an indication of model reliability.
A separation Rasch analysis provided further helpful information about to what extent the sample breaks into distinct trait-level groups (Wright & Masters, 1982). Rasch calculations yielded a person separation statistic of 2.00, which is an indication of a moderate spread of items and persons along the continuum. This also resulted in a stratum of 3.00, suggesting the sample can be separated into three distinct groups of trait levels.
Rating Scale Utilization
All three criteria for rating scale effectiveness were met. Specifically, there were more than 10 observations per category (Table 3). As shown in Table 2, the mean square residual statistics were between 0.60 and 1.40, and the standardized z statistics were less than 2.00. Table 4 shows the structure calibrations for the LSNS-6 with six response categories, and a revised scale with four response categories. While the thresholds were in linear order for both models, spacing between thresholds was less than 1.40 logits for the scale with six response categories. With the revised scale with four response categories, however, spacing between thresholds approximated 1.40 logits or greater (with spacing between Response Categories 2 and 3 to be 1.34 logits; Linacre, 2002).
Response Frequency by Category on the LSNS-6.
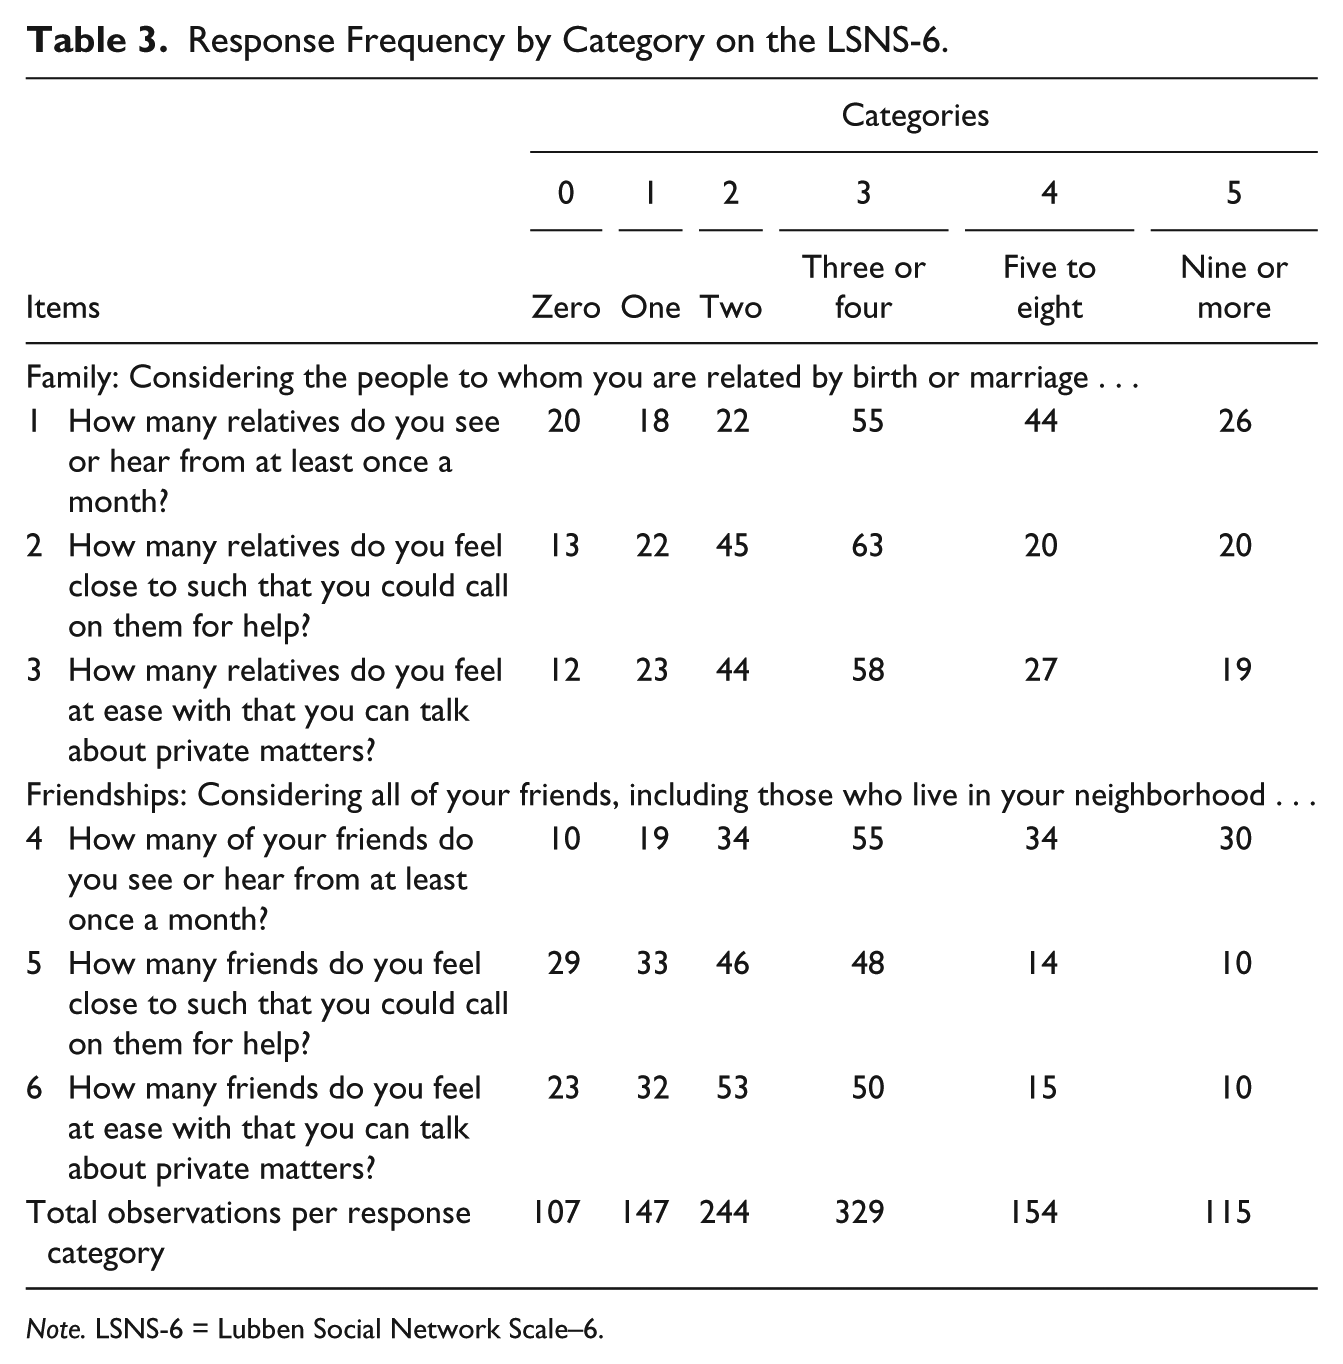
Note. LSNS-6 = Lubben Social Network Scale–6.
Threshold Statistics of the LSNS-6 With a Different Number of Response Categories.

Note. LSNS-6 = Lubben Social Network Scale–6.
Figure 1 displays the category characteristic curves for the LSNS-6 with six response categories (Figure 1a) and four response categories (Figure 1b). Although the figure should display visible peaks for each response category, Figure 1a shows that Categories 1, 2, and 4 do not display as peaks or modes. This suggests that such categories are less often chosen by participants. Figure 1b demonstrates an alternative where Response Categories 1 and 2, and 4 and 5 have been collapsed to result in four response categories. In this case, each of the response categories does display distinct peaks, indicating an improvement to the instrument.

Category characteristic curves: (a) LSNS-6 with six response categories; (b) LSNS-6 with four response categories.
Item Hierarchy and Coverage
Figure 2 is the person-threshold map showing person locations and items’ Andrich threshold locations within the construct hierarchy. To the right of the vertical line, items toward the bottom indicate less developed or limited social networks, whereas those toward the top indicate more richly developed social networks. Items are displayed in the order as they appear in the questionnaire with the number at the end of item labels indicating the threshold number. For instance, “r_cont.5” denotes the fifth threshold of the first item (the number of relatives a respondent sees or hears from at least once a month in six response categories). The left of the vertical line illustrates the distribution of participants with respective levels of the latent trait. Participants with less developed social networks are located lower on the map, whereas those with more developed social networks are higher on the map. We found that although person locations extended from −3 to 4 logits, the thresholds only ranged from −2.13 to 2.25 logits. Consistent with the data from Table 2, Items 5 and 6 were shown to be the most difficult items in the instrument. Data revealed floor and ceiling effects, with an insufficient number of items reflecting participants with the least and most highly developed social networks, respectively. The ceiling effect was more prominent than the floor effect as the gap between the highest person location and the highest threshold location is larger than the gap between the lowest person location and the lowest threshold location.
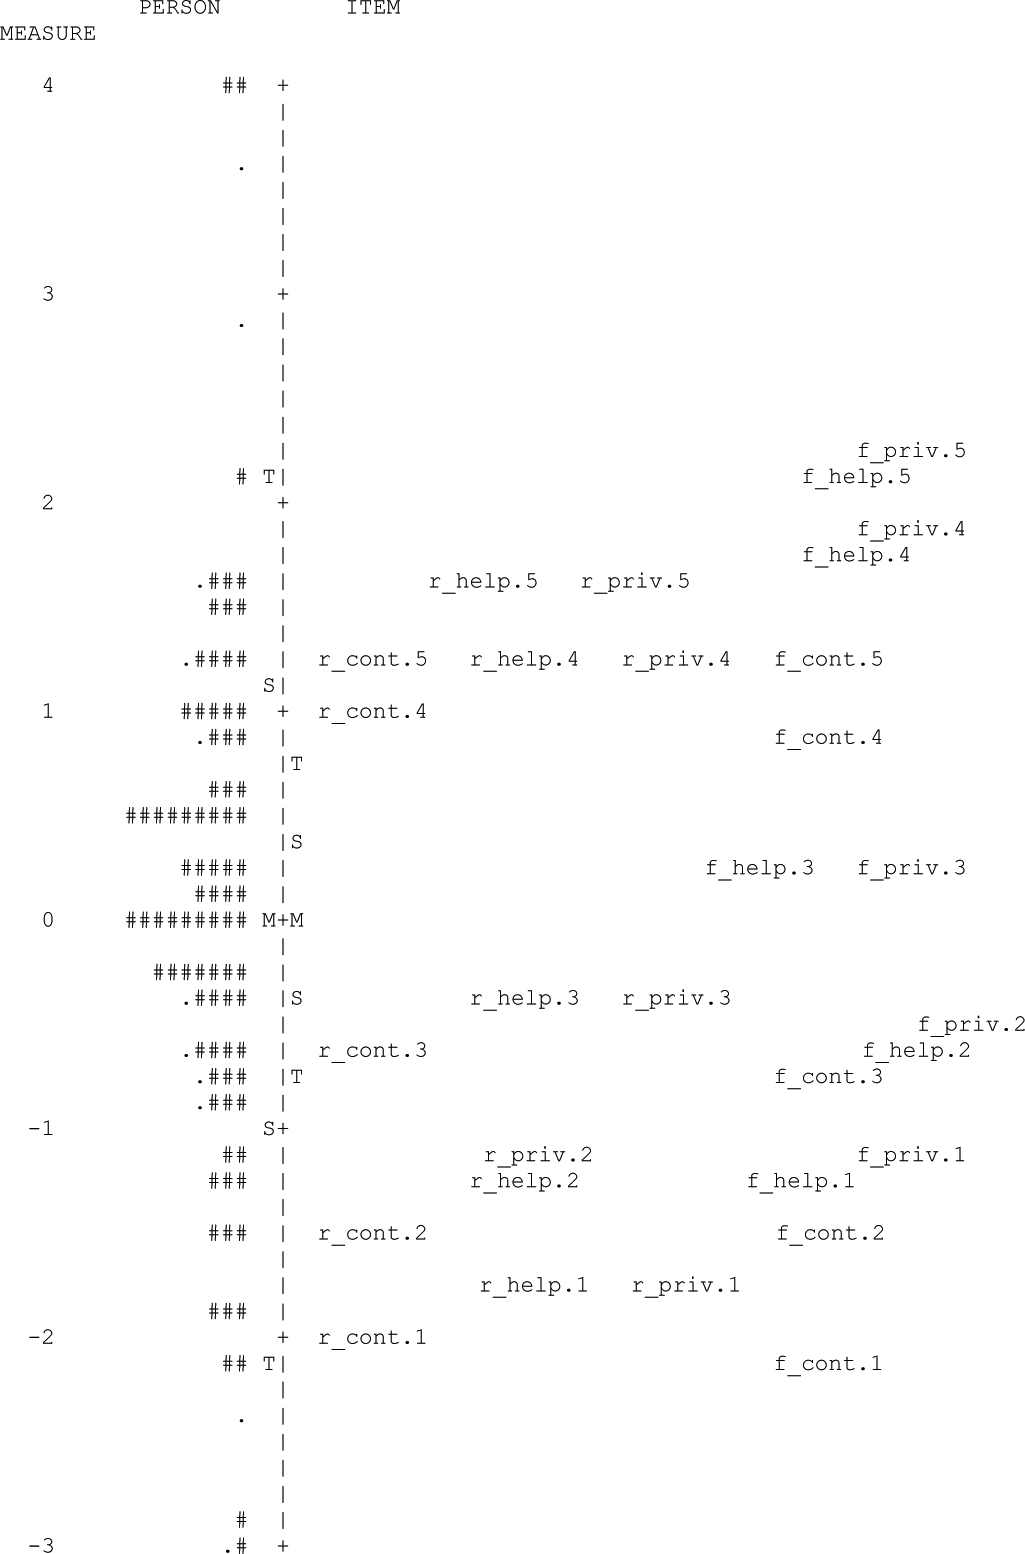
Person-threshold map.
Discussion
The purposes of this article are to review the psychometric properties of the LSNS-6 and to determine its utility in assessing social networks of an older adult community sample. Rasch analysis provides detailed information on how well instrument items can measure a trait and is useful in detailing the positive, as well as less desirable, elements of this instrument.
This analysis shows that the LSNS-6 performs adequately as a measure of social networks in community-residing older adults, but it needs some improvement. With a few modifications, the scale’s response categories can be made ordinal with nearly equal intervals to approach cardinality. Fit statistics and PCA of the Rasch model residuals showed unidimensionality of the LSNS-6. Overall fit statistics falling within acceptable ranges and Rasch measures explaining the largest portion of total variance indicated that the instrument measures one construct. Separation and reliability analysis demonstrated a moderate spread of items and good model reliability. Examination of response patterns also showed the instrument’s overall effectiveness as a rating scale measure.
Rasch analysis results, however, indicate issues in item locations in relation to person locations, individual item fit, and rating scale response categories. Floor and ceiling effects, visually apparent on the person-threshold map (Figure 2), demonstrate a lack of items measuring more and less developed social networks. Particularly, the relatively larger ceiling effect suggests that the instrument lacks items that can assess the persons with more highly developed social networks.
Fit statistics and match percentage scores suggest poorer fit of two items (Items 1 and 4) compared with other items in the instrument. Item 1 is clearly misfitting given the fit statistics falling outside the accepted range (Table 2). Although Item 4’s fit statistics are within the acceptable range, observed data are more random than predicted by a Rasch model (Table 2). One of the potential reasons for the poorer fit might be that the two items are double barreled. They ask participants about how many relatives (Item 1) or friends (Item 4) they see or hear from at least once a month. These questions are problematic for two reasons. First, they ask about two types of contacts (i.e., seeing and hearing from a person). Second, making these two types of contacts tends to be vastly different in terms of difficulty. People are likely to talk on the phone with more people than to meet in person, especially when their relatives or friends live far away. To complicate matters further, there are more diverse modes of communication now than when the LSNS-6 was developed. While “hearing from someone” formerly meant only phone calls or postal mails, now it can include communication through electronic mails, text messages, or Facebook updates, in addition to the traditional modes of communication. Similarly, “seeing someone” can refer to virtually interacting with them through remote video conferencing instead of meeting in person. Subsequently, responses from participants with different assumptions about means of contact could result in item misfit.
Response patterns to rating scale categories indicate room for improvement as well. While the criteria for overall rating scale effectiveness were met and the thresholds were in order, an examination of the alignment of thresholds and category characteristic curves demonstrated that there are two adjacent categories representing too narrow intervals and response categories that are rarely chosen by respondents. When we condensed the scale structure with six response categories to four response categories, spacing between thresholds and category characteristic curves improved. Thresholds had more reasonable intervals (Table 4), and a distinct peak per response category (i.e., indicating modes) appeared (Figure 1).
Floor and ceiling effects could be the result of the issues just discussed, including double-barreled questions, lack of differentiation in social networks through different means, and inadequate response categories. To ameliorate these problems, we recommend revising or adding items so that each item refers to a specific concept and that items reflect use of new communication technologies. Moreover, the response categories must be modified to correspond to such item changes.
The LSNS-6 was developed before the widespread public usage of the Internet, email, and social media. Social media, however, increasingly is part of standard social interactions. Such virtual means of communication should be incorporated in item development. Items referring to virtual versus in-person social contact should be differentiated to allow for better data covering of a wider range of traits in social networks. For example, the intensity or influence of social networks formed through direct personal contact, such as in local neighborhoods and workplaces, could be very different from that formed through virtual contact such as on Facebook or in an Internet forum.
In relation to the revision or addition of items, response categories may be modified to measure social network sizes efficiently. The size of social networks certainly varies widely depending on the type of communication. For example, a social network maintained through Facebook or Twitter is likely to be much larger than one through phone calls or in-person contacts. Either the current response categories (0 = none, 1 = one, 2 = two, 3 = three or four, 4 = five through eight, and 5 = nine or more) or the condensed categories we suggested (0 = none, 1 = one or two, 2 = three or four, 3 = five or more) may not be adequate to capture the extent of network sizes maintained through social networking sites. For example, the number of “friends” contacting through Facebook may be much more than five per month for most social media users.
A few limitations of this study must be considered. While a sample size of 196 adults aged 55 and above was sufficient for Rasch analysis, a larger sample size would have been preferable. Endogeneity in the sample selection may predispose the respondents to be more socially engaged; a randomly drawn sample would make the results more broadly generalizable.
Heeding the psychometric analysis and recommendations provided in this article can result in an instrument better equipped to measure the social network of older adults for both screening and intervention purposes. Technological advances have had significant effects on modes of communication and the development of social networks. A revised LSNS-6 could reflect these changes, for example, by including items accounting for a greater diversity of modes of communication possible with modern technology as well as the way communication may be defined (e.g., definition of friends via Facebook versus in-person contacts). If implemented and adequately evaluated, these changes will make the LSNS-6 more psychometrically sound and thus more useful to researchers as well as practitioners.
Footnotes
Declaration of Conflicting Interests
The authors declared no potential conflicts of interest with respect to the research, authorship, and/or publication of this article.
Funding
The authors disclosed receipt of the following financial support for the research, authorship, and/or publication of this article: This work was partially supported by the National Telecommunications and Information Administration (Grant # CFDA BTOP 11.557).