



Abstract
In this study, the authors evaluate the 2013 consolidation of Iowa’s Area Agencies on Aging (AAA) on the delivery of home and community-based services (HCBS) to older adults in the state. A mixed-methods approach combined a quasi-experimental design using longitudinal service delivery data with qualitative analyses of surveys and interviews with AAA staff and clients. Overall, consolidation had no detectable effect on the proportion of older adults served by the AAAs. Subgroup analysis showed that consolidation increased the average proportion of older adults served in nonmetropolitan counties and the proportion served through congregate meals. AAA staff and clients described both positive and negative aspects of consolidation: better collaboration across agencies, improved consistency in services, significant challenges with completing consolidation processes, and serving expanded geographic areas. As the American population ages and budgetary allocations tighten, findings from this evaluation can inform other states considering similar restructuring efforts.
Keywords
Introduction
The number of Americans above the age of 60 years is expected to increase by 35% by 2030 (Census Bureau, 2018). As the population ages, the prevalence of chronic conditions and the number of individuals living with cognitive and functional limitations is also expected to surge.
This is likely to lead to a corresponding growth in the demand for long-term services and supports (LTSS). The Older Americans Act (OAA)—enacted by Congress in 1965—serves as a mechanism for public financing of LTSS in home and community-based settings. Specifically, Title III of the OAA distributes federal funds (amounting to US$1.4 billion in 2016) to help states organize a broad range of social and nutrition services for individuals above age of 60 years (Congressional Research Service, 2017). Appropriations under the OAA are made to the State Unit on Aging, which then allocates funds to local Area Agencies on Aging (AAA) that serve as frontline vehicles for delivering home and community-based services (HCBS) within their respective planning and service areas.
AAAs typically contract with local service providers to deliver a wide array of services such as home-delivered and congregate nutrition programs, in-home assistance, information and referral, elder abuse prevention, and legal services. Unlike Medicaid, OAA services are not means tested (i.e., individuals do not have to meet income restrictions) and, therefore, serve as an important safety net for older adults who do not qualify for Medicaid-funded LTSS (Centers for Medicare & Medicaid Services, 2018).
In the wake of the Great Recession, AAAs continue to face considerable fiscal challenges: budget caps, mandated by the 2011 Budget Control Act, and subsequent sequestration of discretionary funding, eroded annual appropriations for OAA programs from FY2011 to FY2013, with the latter falling below the FY2007 level. Although funding has increased slightly, current appropriations still lie below the FY2010 level (Congressional Research Service, 2017). In response to tight federal budgets, many states have attempted to restructure existing mechanisms for delivering HCBS to achieve efficiencies and generate cost savings (Kunkel, Reece, & Straker, 2013). Despite this growing trend, there exists little evidence on the effect of such strategies on overall service provision.
This study evaluates whether one such effort in Iowa—the consolidation of the state’s 13 AAAs into six in July 2013—influenced the delivery of HCBS to older adults over FY2010—FY2016. A mixed-methods approach was used: A multivariate difference-in-differences (DD) design was complemented with qualitative analyses exploring subjective experiences of AAA staff and older adults who received AAA services. The DD analysis was extended to assess whether the effect of consolidation was heterogeneous across geography and type of service. Finally, the results were presented back to current AAA directors and the Director of Iowa Department on Aging (IDA)—Iowa’s State Unit on Aging—to gain their insight in interpreting findings.
This article makes four contributions. First, it provides evidence on potential changes in the delivery of HCBS in Iowa over FY2010-2016 period. Tracking these changes is important because HCBS is viewed as a key mechanism for avoiding unnecessary and more expensive institutional care. A national survey of OAA program participants found that more than 85% of those receiving homemaker services, case management, transportation, and home-delivered meals reported that these programs helped them remain at home (Altshuler & Schimmel, 2010). In other words, without these programs, more individuals with “low-care needs” would likely be in nursing homes (Thomas & Mor, 2013). Iowa ranks second nationwide in the percentage of population in nursing homes and where about 26% of nursing facility residents are identified as having “low care needs” compared with about 15% nationally (Iowa Department on Aging, 2013). Understanding factors influencing the availability of HCBS is especially significant when the provision of such services can potentially make a substantial difference in rebalancing long-term care.
Second, current literature on the outcome of consolidation of public services has largely focused on school district, police department or local government consolidation. Even though restructuring of aging agencies has been identified as an important theme across many states in recent years (National Association of States United for Aging and Disabilities, 2012, 2014), to our knowledge, no previous study has empirically evaluated the consequences of consolidating AAAs. As other states consider similar restructuring efforts, 1 it is important to understand how consolidation of local agencies influences service provision for older adults.
Third, existing literature on the centralization of human services is yet to reach a conclusive result (Hall, Matti, & Zhou, 2017). Some scholars find that consolidation is an efficient way to deliver services because large regional organizations take advantage of economies of scale, specialization, and standardization (especially with regard to human resources and information technology; Hall et al., 2017). A larger agency can also facilitate cooperation between different counties and reduce socially inefficient competition (Hall et al., 2017). In addition, consolidation may expand the type of services available to seniors in a given region. On the contrary, AAA consolidation may lead to negative outcomes if service delivery locations become more centralized and difficult to access, especially for seniors residing in rural areas (Murty, 2001). In addition, service providers in central offices may lack an in-depth understanding of the unmet needs and existing resources in outlying areas, which may negatively affect the nature and quality of services delivered (Murty, 2001). This study informs the literature by presenting a fresh empirical analysis of how local agency consolidation influences LTSS.
Finally, while much effort has been geared toward evaluating transitions from fee-for-service to managed care or capitated Medicaid LTSS (Hall, Kurth, Chapman, & Shireman, 2015; Jackson, Rivard, Seibert, Rachel, & Whitworth, 2013; Wegman et al., 2015), little research has evaluated the impact of restructuring other state-funded non-Medicaid LTSS, such as OAA programs. In view of advancing population aging, high costs of nursing facility care and progressive decline in budgetary allocations, understanding the impact of AAA consolidation in Iowa can facilitate the development of a strong evidence base to guide other states considering similar approaches.
AAA Consolidation in Iowa
In 2010, Iowa’s 99 counties were represented by 13 AAAs (Figure 1). During the first session of Iowa’s 84th General Assembly in 2011, House File 45—a bill focused on cutting state spending to counteract the ongoing fiscal crisis—mandated the IDA to reduce the number of AAAs in the state to five (HF45).
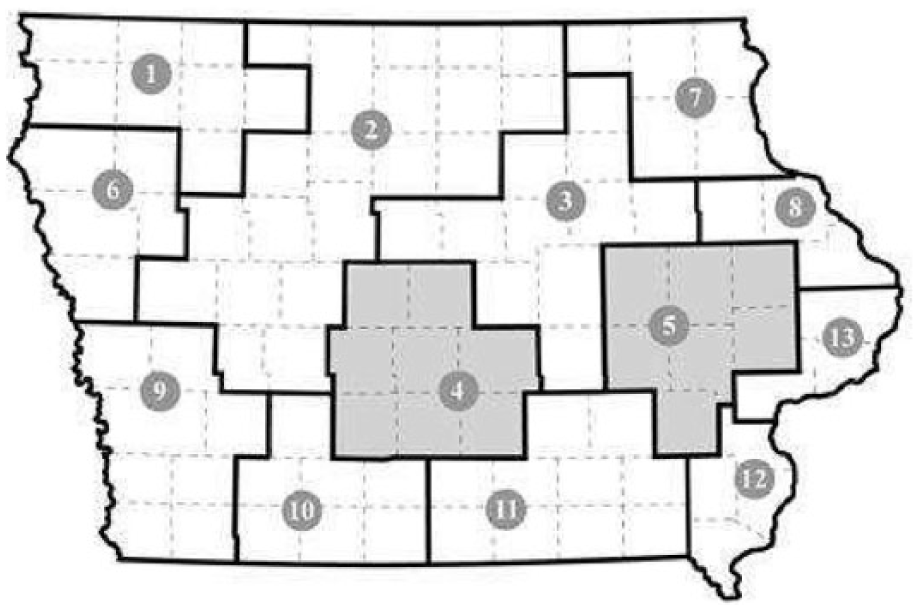
County coverage by 13 AAA before consolidation (FY2010-2013).
To achieve this, IDA held ongoing meetings with the AAAs and their board of directors. During these meetings, some AAAs voluntarily agreed to consolidate (Iowa Department on Aging, 2011). In addition, the department also held 16 community forums throughout the state (attended by 646 Iowans) and met with other aging advocacy groups to gather input on how AAAs might be consolidated (Iowa Department on Aging, 2011). Following these meetings, the IDA determined that the greatest concern related to the aging network’s reorganization was the potential reduction in access to services. To address this, the department prepared several proposed configurations with the aim of making funding formulas across regions more equitable (i.e., base funding on the number of older Iowans in a given region). Given access-related concerns and various configurations developed by the IDA in response, Iowa’s Commission on Aging approved a final reduction to six new AAAs (HF2320). The IDA issued a formal Request for Proposals in January 2013 to designate new AAAs. The 13 original AAAs were legally dedesignated and the six newly designated AAAs began operation on July 1, 2013 (Figure 2).

County coverage by six AAA after consolidation (FY2014-present).
Of the 13 previously operating AAAs, two AAAs—in Areas 4 and 5—remained unchanged and continued serving older adults in the same counties as before (see shaded regions in Figure1a and 1b). The AAA in Area 4 is a division of a local community college with administrative authority held by the College Board and, therefore, remained unchanged. Area 5 is one of the most densely populated areas of the state, making it difficult for other AAAs to absorb this region, or for this AAA to absorb additional counties.
The 2013 restructuring of the AAAs represented “the single largest transformation of Iowa’s aging network since its inception in 1966” (Iowa Department on Aging, 2013). IDA expected this restructuring to “maximize cost efficiencies of programs, staff, physical plants, and other unit costs while ensuring the continuity of services across the state” (Iowa Department on Aging, 2013). The IDA identified two major challenges associated with consolidation: First, four of the six newly designated AAAs significantly expanded their geographical service area. Second, no resources were appropriated by Iowa’s General Assembly to assist the AAAs in the transition of service areas (Iowa Department on Aging, 2013).
Study Design and Data
To evaluate the impact of AAA consolidation, a concurrent nested mixed-methods approach (Creswell & Clark, 2011) was applied. Specifically, we used a quantitative, quasi-experimental design to examine whether AAA consolidation in Iowa influenced the proportion of older adults served. This method was complemented with qualitative analyses of survey data and interviews, focused on understanding the experiences of AAA staff and clients and their perceptions regarding the impact of AAA consolidation. As a final step, integrated findings were presented back to AAA directors and the IDA director. Their feedback was used to validate the interpretation of study results.
Quasi-Experimental Design
A county-level, multivariate DD analysis was utilized to estimate the effect of AAA consolidation in Iowa. The DD estimator contrasts changes in the proportion of older adults served by AAAs in treatment counties before and after consolidation, to corresponding changes in the same outcome in the control counties. As stated earlier, two AAAs serving Areas 4 and 5 did not consolidate, thus, counties in these regions serve as “control” counties; whereas the remaining serve as “treatment” counties. Because consolidation occurred in July 2013, pretreatment time period spans FY2010-2013, and the postperiod is encompassed in FY2014-2016.
The basic DD model takes the form:

The dependent variable Y ct is measured as the proportion of a county’s above 60 years population that received in-home and community services from their AAA during a given fiscal year. The numerators of the proportions are unique counts of clients served by AAAs in each county, obtained from the IDA’s Iowa Aging Program Reporting System for FY2010 through FY2016. The denominators of the proportions are county- and year-specific counts of individuals aged 60 years and older as of July 1, taken from Census Bureau estimates (2017).
Treatment is a binary variable indicating whether a given county is in the treatment (1) group or the control group (0). Of Iowa’s 99 counties, 84 counties comprise the treatment group and 15 are part of the control group. Post indicates the timing of consolidation; it is “0” for FY2010-2013 and “1” from FY2014 onward.
In subgroup analysis, separate models were estimated for metropolitan and nonmetropolitan counties using the Urban Influence Code classification (Economic Research Service, 2013). Additional models for meals (congregate and home delivered) and case management services were examined to assess heterogeneity in the impact of consolidation across types of services. These services were selected because all AAAs provided these in most years of the study period. 2 For each service, the dependent variable is the number of service units provided as a proportion of the above 60 years population for each county-year.
AAA Director Survey and Client Interviews
Directors of the six newly designated AAAs were invited to participate in an online survey. The research team also planned telephone interviews with 12 agency clients (two from each agency). Data from staff surveys and client interviews were examined to identify themes surrounding the study questions and to facilitate the interpretation of quantitative results.
AAA director survey
An electronic survey designed for AAA directors included broad, open-ended questions on the following topics: perceived impact of the consolidation on clients and their staff, support/resources available to carry out consolidation, and perceived benefits and challenges of consolidation. An email invitation to participate in the survey was created and signed by the research team. This invitation was forwarded to the AAA directors from the office of the director of the Iowa Association for AAA Directors. Seven completed survey responses were received. All six AAAs were represented. At one AAA, a director who had recently joined the agency asked two senior staff members to complete the survey on the behalf of the agency.
Client interviews
The research team developed study flyers to recruit AAA clients for interviews. These flyers were provided to all six AAA directors to distribute to their clients. To be eligible, clients had to have utilized any AAA service from at least July 2012 onward to the time of the interview to ensure that participants were able to talk about experiences before and after consolidation. Interested AAA clients contacted the study office to determine eligibility. A semistructured interview guide was developed with open-ended questions focused on the following topics: duration and types of services the clients receive, perceptions about changes in service provision before and after 2013, how they were informed about the consolidation, perceived benefits and drawbacks of consolidation, and their overall reactions to the consolidation and satisfaction with its outcomes.
Among those who contacted the study office, 10 clients were eligible to participate in the interviews. An advanced PhD student (serving as the study’s research assistant), trained in qualitative methods, conducted telephone interviews with nine of the 10 eligible clients. Each interview lasted 45 min to 60 min. All interviews were tape recorded and transcribed. The research assistant read out consent information to clients over the telephone and obtained verbal consent prior to the start of the interview. One eligible client preferred to participate electronically. Using the interview guide, a corresponding online survey was developed for this participant. In this case, consent information and the survey link were provided through an email invitation, and answering questions by clicking on the survey link was considered as providing consent to participate. All 10 clients received a US$20 visa gift card by mail upon completing the interview. This study was approved by the institutional review board (IRB 201701753).
Results
Proportion of Older Adults Served
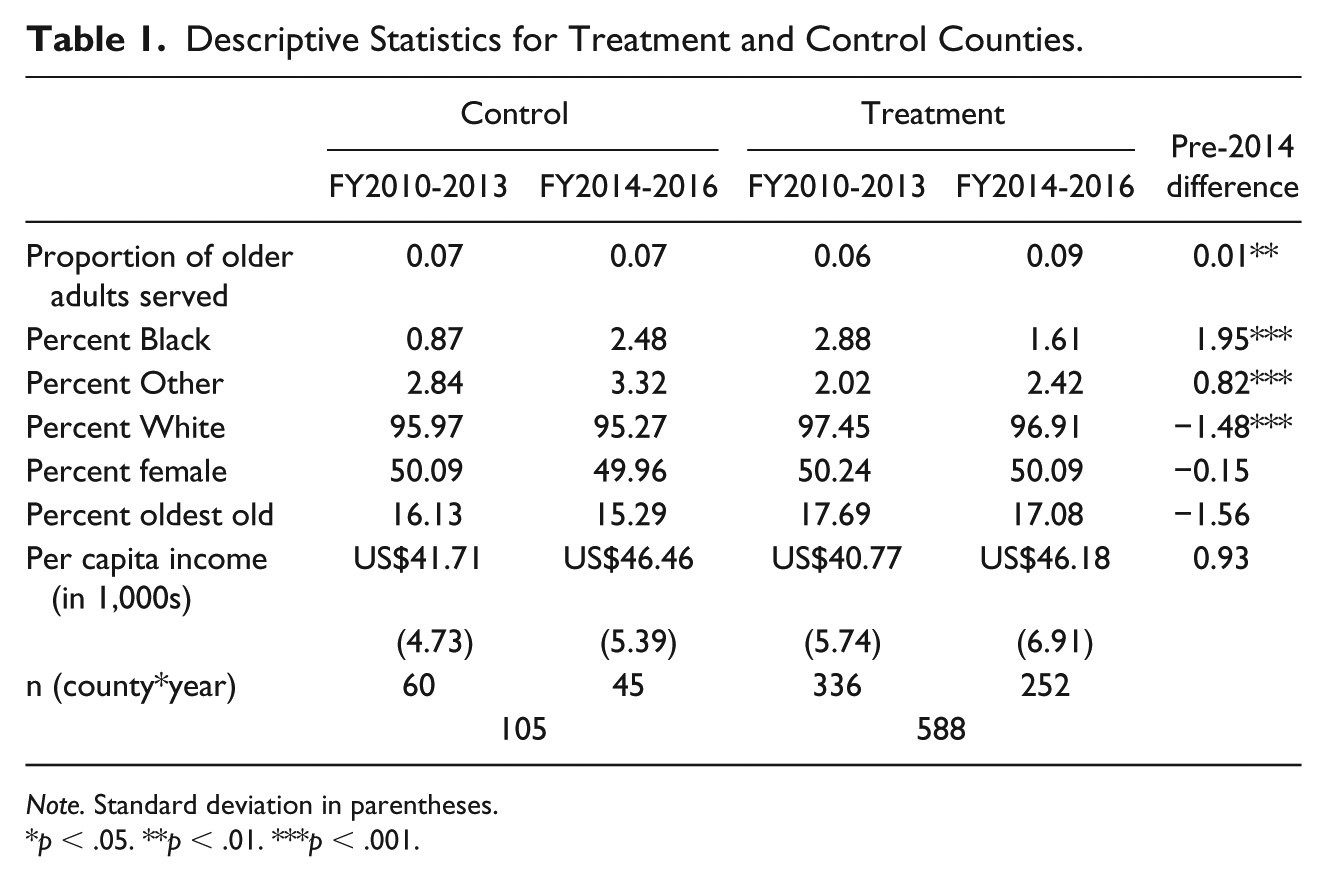
In Table 1, sample means of the variables are presented for the treatment and control groups. Although t tests suggest that treatment and control counties are different in terms of racial composition, the difference is small, and is accounted for by controlling these variables in the regressions.
Descriptive Statistics for Treatment and Control Counties.
Note. Standard deviation in parentheses.
p < .05. **p < .01. ***p < .001.
Figure 3 presents trends in the mean outcome variable (the proportion of a county’s older population that are AAA clients) separately for the treatment and control counties. The vertical line indicates the timing of consolidation in July, 2013. In FY2010, the mean proportion of older adults served by AAAs was higher for the control group as compared with the treatment group. The trend in the outcome variable for treatment counties remained stable until FY2014. However, the average proportion of older adults served by AAAs in control counties decreased slightly in the preperiod. In FY2014 (the first full year after consolidation), older adults served by AAAs rose sharply for both groups, with treatment counties experiencing a much larger increase in the proportion served relative to the control counties. The trend in the outcome fluctuated only slightly in both groups after FY2014.
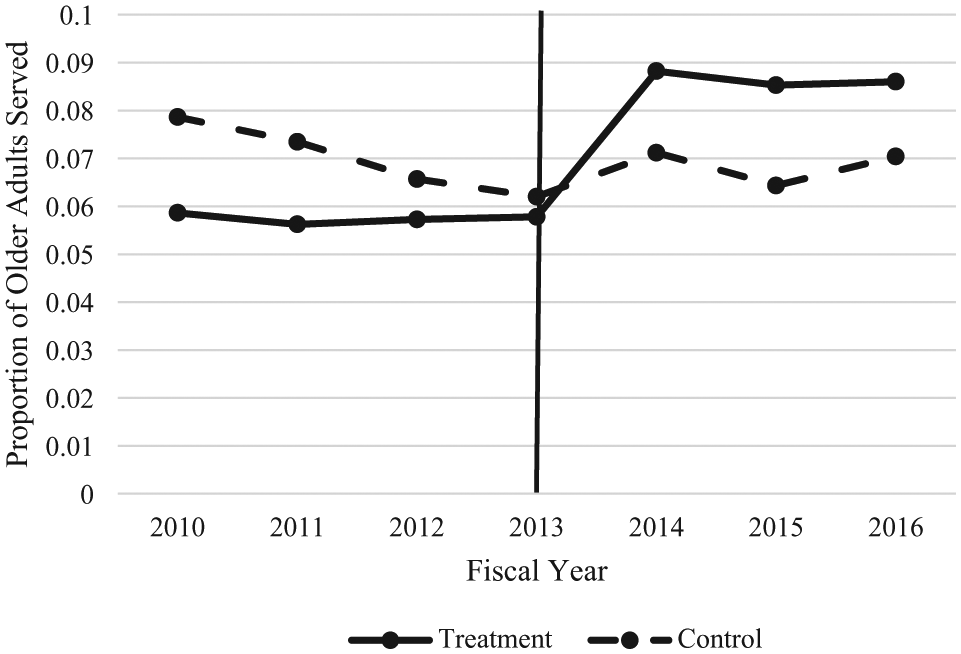
Proportion of older Iowans (aged 60 years and above) served by an AAA in treatment and control counties, FY2010-FY2016.
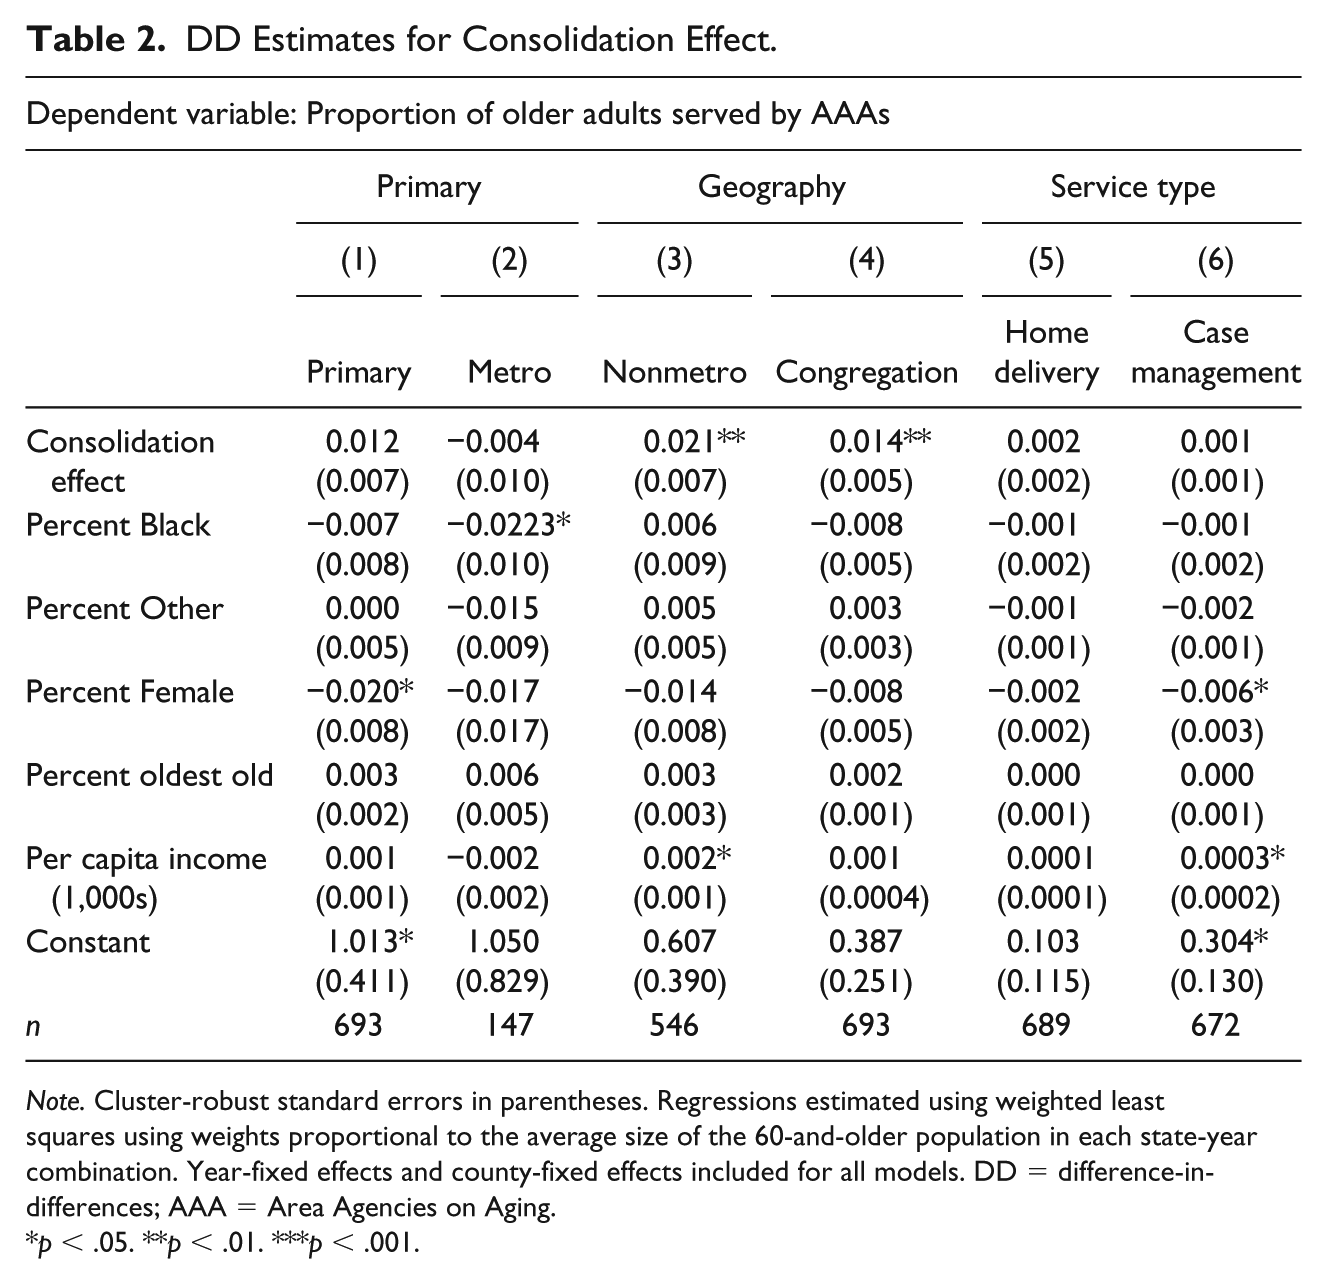
Table 2, column 1, presents the full results of the primary model. The findings indicate that AAA consolidation increased the proportion of older adults served by 1.2 percentage points. The proportion of older adults served by AAAs in treatment counties in FY2013 was about 5.8%. Evaluated at this baseline, the consolidation estimate implies a relative increase of over 20% in the proportion of older adults served in treatment counties. Therefore, while statistically insignificant, the magnitude of the estimated effect appears large when compared with the preconsolidation trend.
DD Estimates for Consolidation Effect.
Note. Cluster-robust standard errors in parentheses. Regressions estimated using weighted least squares using weights proportional to the average size of the 60-and-older population in each state-year combination. Year-fixed effects and county-fixed effects included for all models. DD = difference-in-differences; AAA = Area Agencies on Aging.
p < .05. **p < .01. ***p < .001.
Based on Urban Influence Code classification, Iowa has 21 metropolitan counties (treatment = 11; control = 10) and 78 nonmetropolitan counties (treatment = 73; control = 5). In columns 2 and 3 of Table 2, results indicate that the positive effect of consolidation was only experienced in nonmetropolitan counties. In these counties, consolidation led to a 2.1 percentage point increase in the proportion of older adults served. There was no detectable effect of consolidation in metropolitan counties.
Finally, the effect of consolidation across three types of services was examined: congregate meals, home delivered meals, and case management contacts (columns 4, 5, and 6 of Table 2). Results indicate that consolidation led to a statistically significant increase in the proportion of older adults who received congregate meals (1.4 percentage points). Consolidation coefficients for home-delivered meals and case management contacts were small and statistically insignificant.
Experiences and Perceptions About Consolidation Processes and Outcomes
As indicated above, representatives from all six new AAAs participated in the anonymous survey. Ten clients (six from consolidated AAAs and four from control AAAs) receiving services at four AAAs (two consolidated and two control) participated in the interviews.
Processes of consolidation was described as challenging and “incredibly time consuming” on the part of the agencies and their staff, as one staff described, “it’s been a painful process.” As they set out to restructure, all agencies operated under the mission of “do not let changes be felt by the consumer” to minimize concerns among clients regarding potential loss or reduction in the number and quality of the services they received. Thus, AAAs aimed to continue to provide quality services while undergoing a challenging restructuring processes.
There were logistical and emotional challenges associated with merging multiple agencies. Although enhanced communication among the six directors and the IDA was reported because of their need to work together to make restructuring possible, “communication among [staff in] merged regions was difficult.” “All agencies did things differently and in concert with what worked within [their] respective communities” including “different ways of distributing funds.” In terms of emotional challenges, AAA staff felt that “[s]maller regions experienced more anxiety” and showed “resistances,” and that “resistance, anger, fear due to the approaches taken by the new entity were perceived as aggressive and lacked support and care of the agency staff who were being encompassed into the larger agency.”
Perceived benefits of consolidation identified by the AAA staff include ability to “glean best practices from all areas that came together,” “funding (that) is more accessible,” and improved consistency of core programs as they are “making progress in offering more services to some regions that didn’t previously have them.” Overall, AAA staff indicated that the enhanced “collaboration with other AAAs is better and service delivery has improved,” and that “people in rural communities are better able to access the Aging Network.” Client participants also indicated “I have better access to (the) Agency compared to before” and “Agency is listening better.”
Several costs associated with consolidation were identified by the AAA staff. In terms of costs to the agencies, participants described that the size of the staff “increased initially. . . then decreased” as they observed “attrition due to retirement and resignations.” Two agencies reported that roles of each staff have expanded due to larger geographic coverage areas. In consolidated regions, agencies “continue to struggle with the large geographic area and serving clients and families in small rural areas” and stated that the “costs are so great due to travel that it is unaffordable.” One client participant observed: “restructuring put more stress on staff to cover more area with less people, especially those staff that have to go out to see clients.”
When asked about costs to clients, staff participants prefaced their responses by describing that all agencies operated under the mission, “[do] not let the changes be felt by the consumer.” However, one staff stated that “there were a number of projects that [they] had planned [for clients] but were unable to do because of the need to dedicate so much time to the [consolidation process].” Respondents also talked about adjustments that clients needed to make because of the changes in the client service system and direct service providers. For example, regarding a new centralized system that established a toll free number for clients, one staff indicated that “[clients] don’t like calling into [an] 800 number, and they are suspicious when they are from [clients’ own county] and someone from [another county] answers their phone call.” In terms of changes in direct service providers, one client talked about having to go through “3-4 case managers due to retirement and case load [since the consolidation, and that he or she] would like to have stability.” Two clients pointed out changes in meal services; one stated that meals were previously cooked on-site and tasted better, but are now delivered from other regions, and this led to several older adults losing their volunteer opportunity as cooks or meal servers; another stated that clients now have to pay higher fees to receive meals.
Was it worth doing? In response to this question, AAA staff identified several unanswered questions. As one director stated, “we had asked what the goals of the bill to redesign had hoped to achieve, and we never received an answer.” Another stated that “the dollars that were spent in the process have never been captured. I struggle to say if it was worth it without that data.” The following quote summarizes what most AAA representatives expressed: . . . if we could have the option to have never consolidated in the first place, I would be in favor of that. However, since we have. . . I would not go through all of the processes needed to change back. I would choose to not consolidate because it WAS expensive; it WAS challenging; it IS harder to serve a larger service area as one agency; and we had to spend a great deal of time and resources on items and activities that didn’t affect or impact the seniors. . . We invested a lot into the development of new agencies that could have better served our clients.
Discussion
The quantitative analysis indicates that Iowa’s 2013 consolidation of its AAAs from 13 to six had no detectable impact on the proportion of older adults served by these agencies. The treatment effect was positive, but statistically insignificant. However, the relative magnitude of the estimated effect is sizable when compared with baseline levels. Thus, consolidation did not appear to reduce the proportion of older adults served. Further analyses showed a statistically significant increase in proportion served in nonmetropolitan counties and for congregate meals (but not for home-delivered meals or case management contacts).
Findings from the qualitative analysis sheds light on this result as AAA staff discussed consciously focusing planning efforts to ensure that clients saw little or no interruption in services. This view is also corroborated by AAA clients, a majority of whom noted in their interviews that they experienced no major change in service provision due to consolidation. Furthermore, there is some indication by staff that as a result of consolidation, AAAs are now able to provide new services that were previously unavailable in some rural areas.
The IDA’s 2013 annual report indicates that concurrent with AAA consolidation, the agency also focused its efforts on expanding Aging and Disability Resource Center (ADRC) 3 services statewide (before FY2014, this service was only available in 17 of Iowa’s 99 counties; Iowa Department on Aging, 2013). The development of six ADRC networks within each AAA region in FY2014 may explain why the proportion of older adults served increased even in the control counties that were otherwise unaffected by the geographic reorganization.
Given that there were only five nonmetropolitan counties in the control group, further analyses (available upon request) demonstrated that the DD model for the subgroup of nonmetropolitan counties was mainly estimating the effect in one type of nonmetropolitan county classification: “micropolitan area adjacent to a small metro area.” 4 Subgroup analysis cannot be used to estimate the effect of consolidation on more rural areas as no relevant control counties satisfy such classifications. Thus, the results demonstrate that consolidation likely led to a positive effect on the proportion of older adults served in some nonmetropolitan counties in Iowa. It is possible that the results are primarily picking up the effect of consolidation for specific AAAs; most counties in the treatment group that were classified as “micropolitan area adjacent to a small metro area” were part of Area 6 in Figure 2.
Feedback from AAA staff on study findings indicated that the positive effect of consolidation for congregate meals may be due to a new operating model adopted by one AAA postconsolidation. This model utilized a single source vendor for the entire region to achieve economies of scale. However, some clients perceived negative changes associated with this process such as reduced quality of meals, higher costs per meal, and older adults losing volunteer opportunities as cooks and meal servers. Furthermore, the staff also noted that the effect of consolidation on case management contacts may be confounded with the state Medicaid program’s concurrent move to managed care, the process for which began in early 2015.
The quantitative approach does not examine service quality. This is a limitation of the type of annual data consistently available at the state level to evaluate such changes. Although the proportion of older adults served may not have decreased, the quality of services may have been influenced. In addition to changes in meal services discussed above, both AAA staff and clients pointed out negative consequences of consolidation. As a result of larger coverage areas, staff may be spending more time traveling and less time with clients. Previous literature has reported this as a common challenge associated with centralization of public services (Murty, 2001).
Although, for the most part, clients did not report major changes in the services they received, the AAAs reported a significant opportunity cost, in that they spent substantial amount of time and effort to the actual consolidation process thereby limiting their ability to provide direct services to clients. There were also logistical and emotional challenges associated with consolidation that led to resignation and early retirement among some staff. Overall, AAA staff struggled to state whether the outcomes of the consolidation were positive 3 years after the change.
One limitation of this study is that only agency directors were surveyed; others such as case managers, who may have been directly affected, were not surveyed. In addition, many of the directors of the 13 original AAAs were not surveyed. The research team was also unable to interview clients from all six AAAs and did not secure feedback from legislators. A final limitation is that the study did not account for fidelity of consolidation implementation across agencies. Agencies likely varied in their degree of success in working with new regions postconsolidation. This variation could have influenced the magnitude of the results. However, no process variables are available to measure this and, therefore, it remained unaccounted for in the analyses.
Conclusion
This is the first mixed-methods study to empirically evaluate the relationship between AAA consolidation and provision of HCBS to older adults. Examine over 2010-2016, there appears to be no detectable impact on the proportion of older adults served by the AAAs due to the 2013 consolidation efforts in Iowa. The effect is generally positive, but statistically insignificant, leading to the conclusion that it is unlikely that consolidation led to a reduction in the proportion of older adults served. Findings indicate positive effects of consolidation only for certain types of nonmetropolitan counties and services (congregate meals). The qualitative analysis bore out important challenges faced by AAA staff that were directly associated with the consolidation process, many of which continue to persist until now. These relate to serving a vast geographic area, increased roles of each staff, and challenging communication among new regions. It is possible that consolidation influenced the quality of services provided by AAAs: Although changes in service delivery models associated with the consolidation process led to a greater proportion of older adults served at congregate meal sites, client participants pointed out problems in meal quality and affordability.
The study also identifies key lessons learned from Iowa’s 2013 AAA consolidation. First, because consolidation was legally mandated by the legislature, it brought together all AAAs and the IDA to collaborate and share best practices, potentially leading to improved consistency of service provision across the state. Second, seeking public input and agency feedback at the initial stage was valuable as it led to a more appropriate and feasible reduction in the number of AAAs. Third, based on AAA directors’ survey responses, the consolidation process could have been made smoother and negative consequences minimized if the legislation mandating the activity had included a clearer articulation of goals and purpose behind the effort, as well as funds to account for AAA resources spent to achieve the redesign. Finally, the findings also indicate that states should make greater efforts to collect consistent, annual data on the quality of services delivered by AAAs—the availability of which will help in conducting comprehensive evaluation of such redesign strategies.
Footnotes
Acknowledgements
The authors are grateful to the Directors of Iowa’s Area Agencies on Aging and the Iowa Department on Aging for providing feedback on our findings. We also thank the Iowa Department on Aging for providing the data used in this study.
Declaration of Conflicting Interests
The author(s) declared the following potential conflicts of interest with respect to the research, authorship, and/or publication of this article: Kanika Arora, Sato Ashida, and Erin Mobley declare no conflict of interest. G. Joseph Sample discloses that he is the contracted executive director for Iowa Association of Area Agencies on Aging. His participation in the development of this work was in his capacity as a PhD candidate with Iowa State University.
Funding
The author(s) disclosed receipt of the following financial support for the research, authorship, and/or publication of this article: This work was supported by a pilot grant from University of Iowa’s Aging Mind and Brain Initiative. The University of Iowa Human Subjects Research approval was granted prior to the start of the project (201701753).
