
Abstract
The proportion of people aged 65 years and older regularly traveling in motor vehicles continues to grow worldwide. In a previous convenience sample, we observed many older people using comfort accessories when traveling in vehicles, and these may contribute to the known increased risk of injury in crashes among older people. In this study, we aimed to estimate population-level use of these devices and examine associations between demographic, health, and travel behavior factors and their use. The point estimate of self-reported use of comfort accessories was 25.7% (95% confidence interval [CI] = [19.6%, 31.9%]). Cushions on the vehicle seat were the most common type used (14.3%, 95% CI = [9.7%, 19.0%]), and increasing age, female gender, and frequent vehicle travel were significantly associated with their use. Less frequently used were seat belt padding (10.5%, 95% CI = [6.3%, 14.6%]) and back/neck supports (6.5%, 95% CI = [2.7%, 10.2%]). Back/neck and multiple area pain were significantly associated with the use of the latter.
Introduction
The proportion of drivers and passengers in motor vehicles aged 65 years and older continues to grow. Mobility is key to healthy aging and the continuing use of private motor vehicles among the older population positively reflects increasing levels of mobility. However, older occupants are at increased risk of injury in motor vehicle crashes compared to younger occupants (Cerrelli, 1998; Meuleners et al., 2006), particularly in lower severity crashes (Augenstein et al., 2005). This increased risk of injury occurs, at least in part, due to physiological body changes with aging that increase fragility (Kent et al., 2009; Li et al., 2003; Meuleners et al., 2006). Chest injuries are especially common in older people involved in crashes, and the most common source of chest injury is the seat belt (Kent et al., 2005; Zhou et al., 1996).
Seat belts are highly effective in reducing risk of death and serious injury in crashes (Elvik et al., 2009). Yet, in properly restraining a driver or a passenger, seat belts will apply a force to the occupant’s body. Seat belts are designed to apply these forces to the strongest parts of the body; the collarbone, sternum, and bony pelvis. Correct seat belt fit and positioning is therefore extremely important for optimum protection from injury in a crash.
In a recent study of a convenience sample of 380 drivers aged 75 years and older in New South Wales (NSW), Australia (Fong et al., 2016), we observed that 26% of older drivers used some form of comfort accessory such as seat belt padding, seat cushions, and lumbar support cushions. It has recently been demonstrated that seat cushions and lumbar support cushions can negatively impact crash protection by altering occupant position and lap-belt angle (Whyte et al., 2020). Our previous report (Fong et al., 2016) was the first of its kind and it is unknown whether these observations from a convenience sample collected from a limited geographical region in north-western Sydney reflect population-level behavior. Recent reports from baseline data collected in a longitudinal study of 2990 older drivers aged 65 to 79 years and vehicle technologies in the United States reported approximately 10% of their sample to be using these types of aftermarket devices (Eby et al., 2018; Zanier et al., 2019). Furthermore, because of the potential negative impact on crash protection, it is important to try to understand factors associated with the use of these devices.
The objective of this study was to estimate the use of comfort and orthopedic accessories among older drivers and passengers at a population level. We were also interested in whether demographic factors, health, and travel behaviors influenced the use of accessories.
Method
This cross-sectional study used a population-representative sampling design to carry out a randomized state-wide telephone survey in May 2018. The Edith Cowan University Survey Research Centre conducted the survey using telephone numbers randomly selected from the Australian Residential Directory database. The unit of sampling was households with a resident aged 65 years or older. Inclusion criteria required regular travel, defined as at least once a week, as a driver, or passenger in a vehicle. Our sampling plan used age (55% aged 65–74 years, 31% aged 75–84 years, and 14% aged 85 years and older) and regional (56% urban and 44% rural/remote) quotas defined by postcode to attain a NSW population-representative sample as per 2016 Australian census data for people aged 65 years and older. Participants provided verbal consent over the phone. Screening questions were used to check inclusion criteria and to satisfy age and postcode defined quotas. If a potential participant declined, or relevant age/postcode quotas were reached, the next random number was called until the required sample size and distribution were achieved. A sample size of 301 was required to obtain population estimates of comfort and orthopedic accessory use in vehicles among older people, with a 95% confidence level and 5% margin of error. The sample size calculation also took into account our previous observational study findings (Fong et al., 2016), which estimated a likely prevalence of approximately 26% for comfort accessory use during car travel.
Survey Methods
A structured questionnaire was used to collect (1) demographic information including age, gender, and country of birth; (2) relevant health issues; and (3) information on driving and traveling behaviors, including comfort accessory use when traveling in a vehicle. Health issues potentially relevant to driving and use of comfort accessories were selected in consultation with an occupational therapist and included experience of pain in the last month and incontinence. The World Health Organization Disability Assessment Schedule 2.0 (WHODAS 2.0) was also used to check that the distribution of the sample recruited reflected that of the Australian population in terms of a standardized measure of disability.
The study was approved by UNSW Human Research Ethics Committee (Project Number HC180130). All participants provided verbal consent.
Outcomes
Disability
Overall disability across the sample was assessed by the 12-item WHODAS 2.0. The WHODAS 2.0 is a generic assessment instrument that is used to produce standardized disability levels and profiles and has been validated across cultures, subgroups of the general population, and among people with various physical, mental, and chronic health conditions (Üstün, Kostanjsek, et al., 2010). The WHODAS 2.0 questions relate to functioning difficulties experienced by the respondent in six domains of life (cognition, mobility, self-care, getting along, life activities, and participation) during the previous 30 days. The simple scoring method was used to calculate a summary score for each participant. This method takes the scores assigned to each item based on the response on a scale of 1 to 5 and sums the total. This is one of the two validated methods for scoring the WHODAS 2.0, while this may limit the scores to the population being studied (i.e, simple scores cannot be compared across different population contexts, Üstün, Chatterji, et al., 2010), this was chosen to allow comparison of the study participant profile to simple WHODAS 2.0 normative scores reported for the Australian population (Üstün, Kostanjsek, et al., 2010).
Pain
The presence of pain was determined by asking “Did you experience any pain in the past month?” with the respondent asked to select “yes,” “no,” or “don’t know.” The severity of pain was measured by asking “On a scale of 0-10, with 10 being most painful, what level of pain did you experience in the last month?,” and pain location was determined through the open-ended question, “Can you describe where you experienced the pain in the last month?”
Incontinence
Questions were extracted from the Questionnaire for Urinary Incontinence Diagnosis (QUID). Survey participants were asked “Do you ever leak urine, wet yourself, or wet your pads/undergarments?” and were given the option of selecting a response from “none of the time,” “rarely,” “once in a while,” “often,” “most of the time,” and “all of the time.” The QUID has previously demonstrated acceptable psychometric properties for its use (Bradley et al., 2010).
Driving and travel behavior
Participants were asked about the frequency with which they travel in a car and their driving space. The Driving Habits Questionnaire (DHQ; Owsley et al., 1999) was used to assess whether participants found their seat belt uncomfortable, if they adjusted their car or car seat, and whether any instructions or advice had been provided to them about how to improve comfort during car travel. The DHQ has been shown to be a valid and reliable measure of self-reported, interview-based driving behavior in the community-dwelling elderly (Song et al., 2015).
Use of comfort accessories
Information on the use of comfort accessories was collected by asking “Are you using any cushions or back supports when traveling in the car?,” “Do you have padding on your seat belt when you travel in the car or other vehicles?,” and “Do you take anything into the car/vehicle to help with comfort or pain when traveling?.” If the participant responded yes to any of these questions, they were then also asked “What specific accessories, cushions or devices are you currently using?” and “Where did you purchase this/these accessories, cushions or devices?”
Statistical Methods
Variables and coding
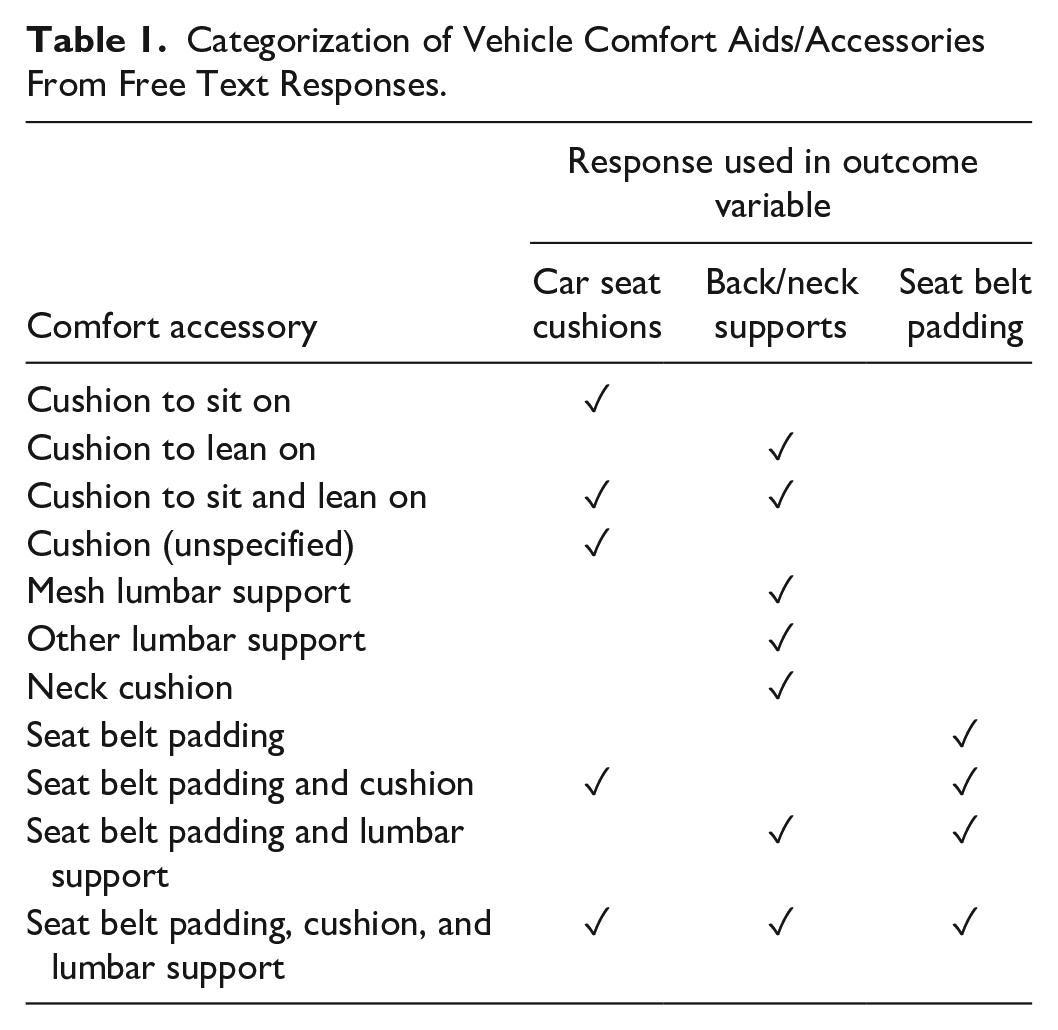
Binary (yes/no) outcomes for use were constructed for three different outcome variables describing comfort aids/accessories—seat cushions, back/neck supports, and seat belt sash padding. The responses to the open-ended question “What specific accessories, cushions or devices are you using when traveling in a vehicle?” were coded independently by a researcher and then categorized into outcome variables. The outcome categorization for the types of comfort aids/accessories reported by our sample is summarized in Table 1.
Categorization of Vehicle Comfort Aids/Accessories From Free Text Responses.
Analysis
The characteristics of the sample in terms of gender and disability were examined using PROC SURVEYFREQ (SAS, Version 9.4, 2002–2012; SAS Institute Inc., Cary, NC, USA) to account for clustering by location with and without weights included. The remainder of the analysis used weighting adjustments to ensure the age distribution of the sample matched the population of NSW residents aged 65+ years by geographical location.
Population estimates of the prevalence of comfort aid/accessory types used during travel were then calculated, along with their 95% confidence intervals (CIs) using PROC SURVEYFREQ to account for clustering by location and include the age weighting adjustment. This procedure together with PROC SURVEYMEANS was used for all remaining descriptive analyses.
PROC SURVEYLOGISTIC was used to examine associations between the use of different types of comfort aids/accessories (seat cushions, back/neck supports, and seat belt sash padding) and relevant independent variables (Table 2). Wald chi-square tests, odds ratio (OR) estimates, and 95% CIs were calculated for the logistic regression models. Interactions between independent variables were also explored. Sub-group analyses using the DOMAIN statement in PROC SURVEYLOGISTIC were used to explore any interactions identified.
Source Questions and Construction of Variables for Each Outcome. Merged Cells Indicate Where the Original Coded Data Were Collapsed Into the Constructed Variables.
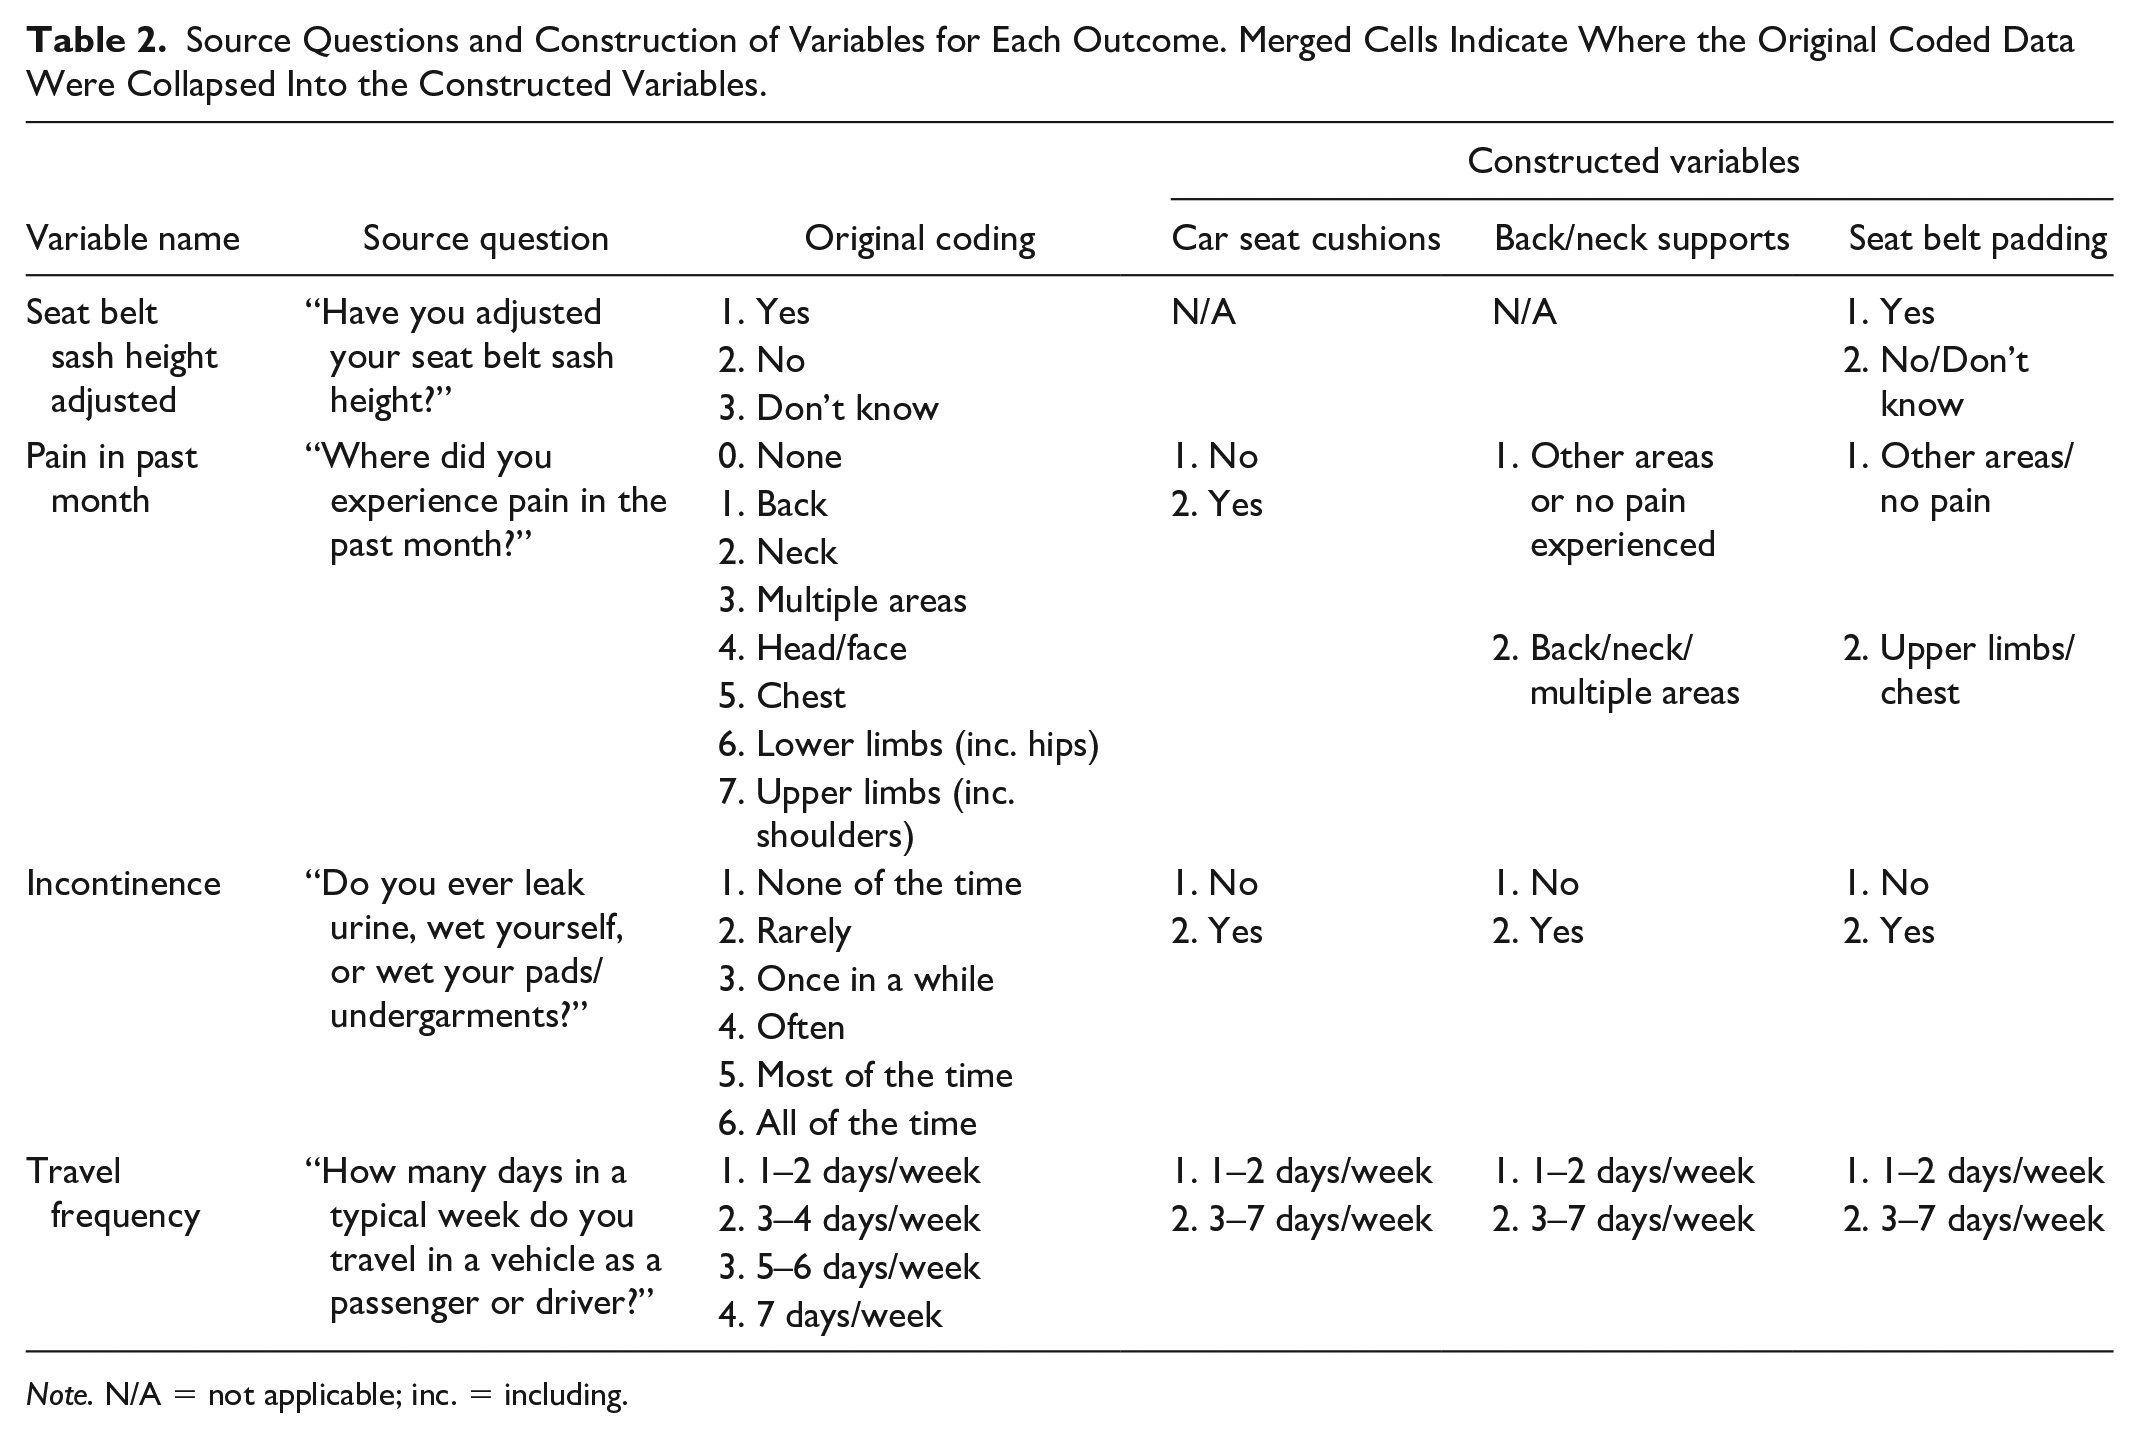
Note. N/A = not applicable; inc. = including.
Results
Sample Characteristics
Of 323 eligible participants contacted, 22 declined to participate. The final sample consisted of 301 participants aged 65 years or older. The mean age of the sample was 75.6 years (standard deviation, SD, 7.0 years) and 170 (56.5%) were female (with weighting adjustments, mean age was 75.7 years and 53.9% were female). Most participants (80.4%, weighted 80.4%) were born in Australia. The mean WHODAS 2.0 simple score for the study sample with weighting adjustment was 3.7 (95% CI = [3.0, 4.3]), 3.4 (95% CI = [2.5, 4.3]) for the 65 to 74 years group, and 4.4 (95% CI = [3.4, 5.4]) for those aged 75 years and older.
Population-Level Comfort Aid/Accessory Use in Cars
The population-level point estimate of self-reported discomfort from the seat belt was 29.4% (95% CI = [22.8%, 36.0%]). A quarter (25.7%, 95% CI = [19.6%, 31.9%]) used a comfort aid/accessory during car travel. As shown in Table 3, most used seat cushions (14.3%, 95% CI = [9.7%, 19.0%]), followed by seat belt padding (10.5%, 95% CI = [6.3%, 14.6%]), and back/neck supports (6.5%, 95% CI = [2.7%, 10.2%]). This includes a small proportion using multiple aids (3.3%, 95% CI = [1.1%, 5.6%]).
Prevalence of Comfort Accessory Use Among Older Drivers/Passengers in NSW, Australia (N = 301).
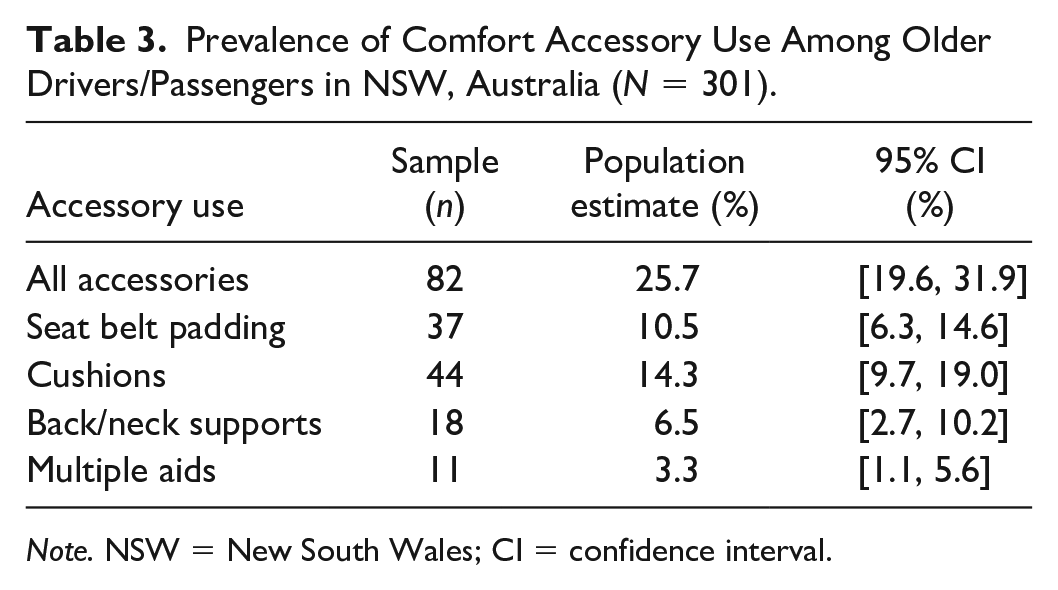
Note. NSW = New South Wales; CI = confidence interval.
Among those using a comfort accessory, almost one-third (31.5%, 95% CI = [21.0%, 42.0%]) did not know where the comfort accessory was sourced. However, many reported they had been purchased from a retail store (26.2%, 95% CI = [16.1%, 36.3%]), an automotive shop (20.6%, 95% CI = [11.3%, 29.9%]), the internet (2.6%, 95% CI = [0.0%–5.7%]), or self-made (6.4%, 95% CI = [0.1%, 12.7%]). Less than 0.1% (0.03%, 95% CI = [0.00%, 0.10%]) reported use of an accessory on the advice of a health care professional.
Population-Level Health
The population point-estimate for those aged 65+ years with self-reported pain in the last month was 51.4% (95% CI = [44.2%, 58.6%]), with the average pain level reported as 5.0 (95% CI = [4.7, 5.4]) on a scale of 0 to 10, with 10 being most painful. The most common location of pain was the back (17.3%, 95 CI = [11.8%, 22.8%]), followed by the lower limbs (16.4%, 95% CI = [11.2%, 21.7%]), multiple areas (9.6%, 95% CI = [5.7%, 13.4%]), and the upper limbs (6.4%, 95% CI = [2.7%, 10.0%]). The population point-estimate for self-reported incontinence was 42.3% (95% CI = [35.2%, 49.4%]) with 2.1% (95% CI = [0.2%, 3.9%]) reporting this was a problem “often to all of the time.”
Population-Level Travel Behavior
Vehicle travel was common with 42.2% (95% CI = [35.3%, 49.1%]) typically traveling 7 days per week, and a further 27.4% (95% CI = [20.6%, 34.1%]) traveling 5 or 6 days per week as a passenger or driver in a vehicle. Table 4 summarizes results from the Driving Space Assessment.
Driving Space Assessment Derived From the Driving Habits Questionnaire.
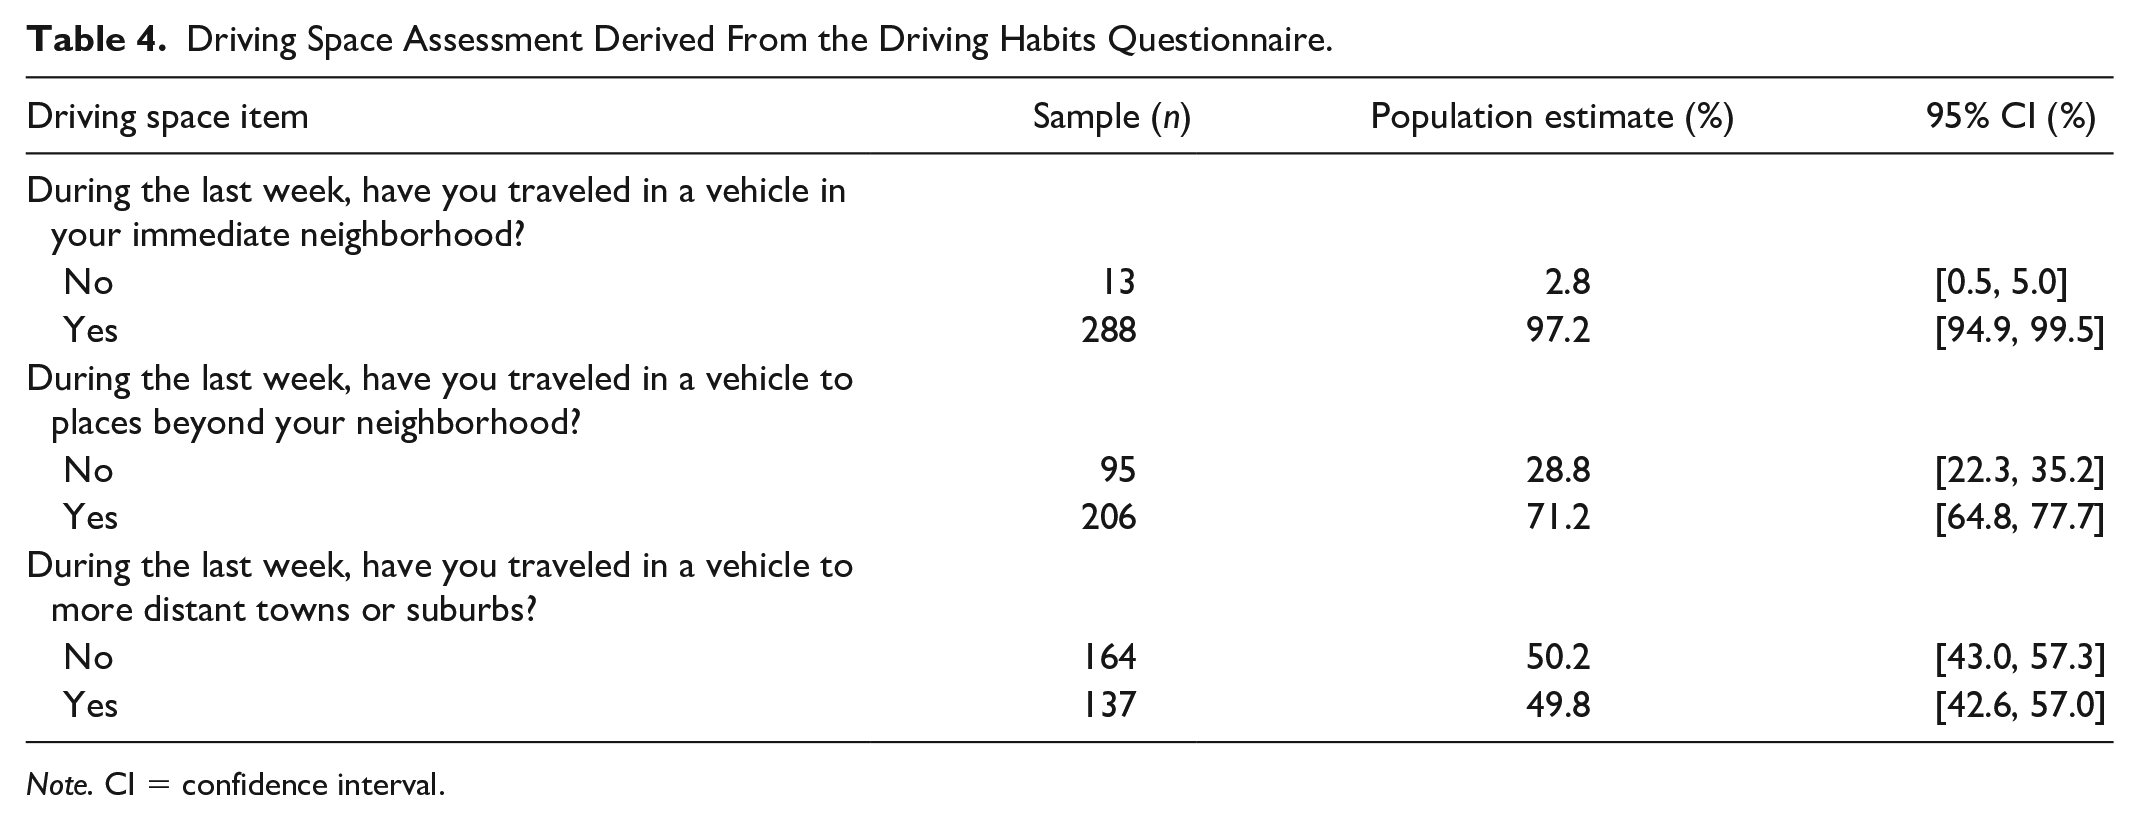
Note. CI = confidence interval.
Factors Associated With the Use of Seat Belt Padding
Table 5 summarizes the logistic regression results for seat belt padding use. Increasing age was significantly associated with the use of seat belt padding (p = .03). However, when controlling for chest/upper limb pain, gender, adjustment of seat belt sash height and travel frequency, the association was not significant. There were no significant associations found between seat belt padding use with gender, seat belt sash height adjustment, and travel frequency in the univariate or multivariate analysis. No significant interactions were identified.
Logistic Regression Model for Seat Belt Padding Use.
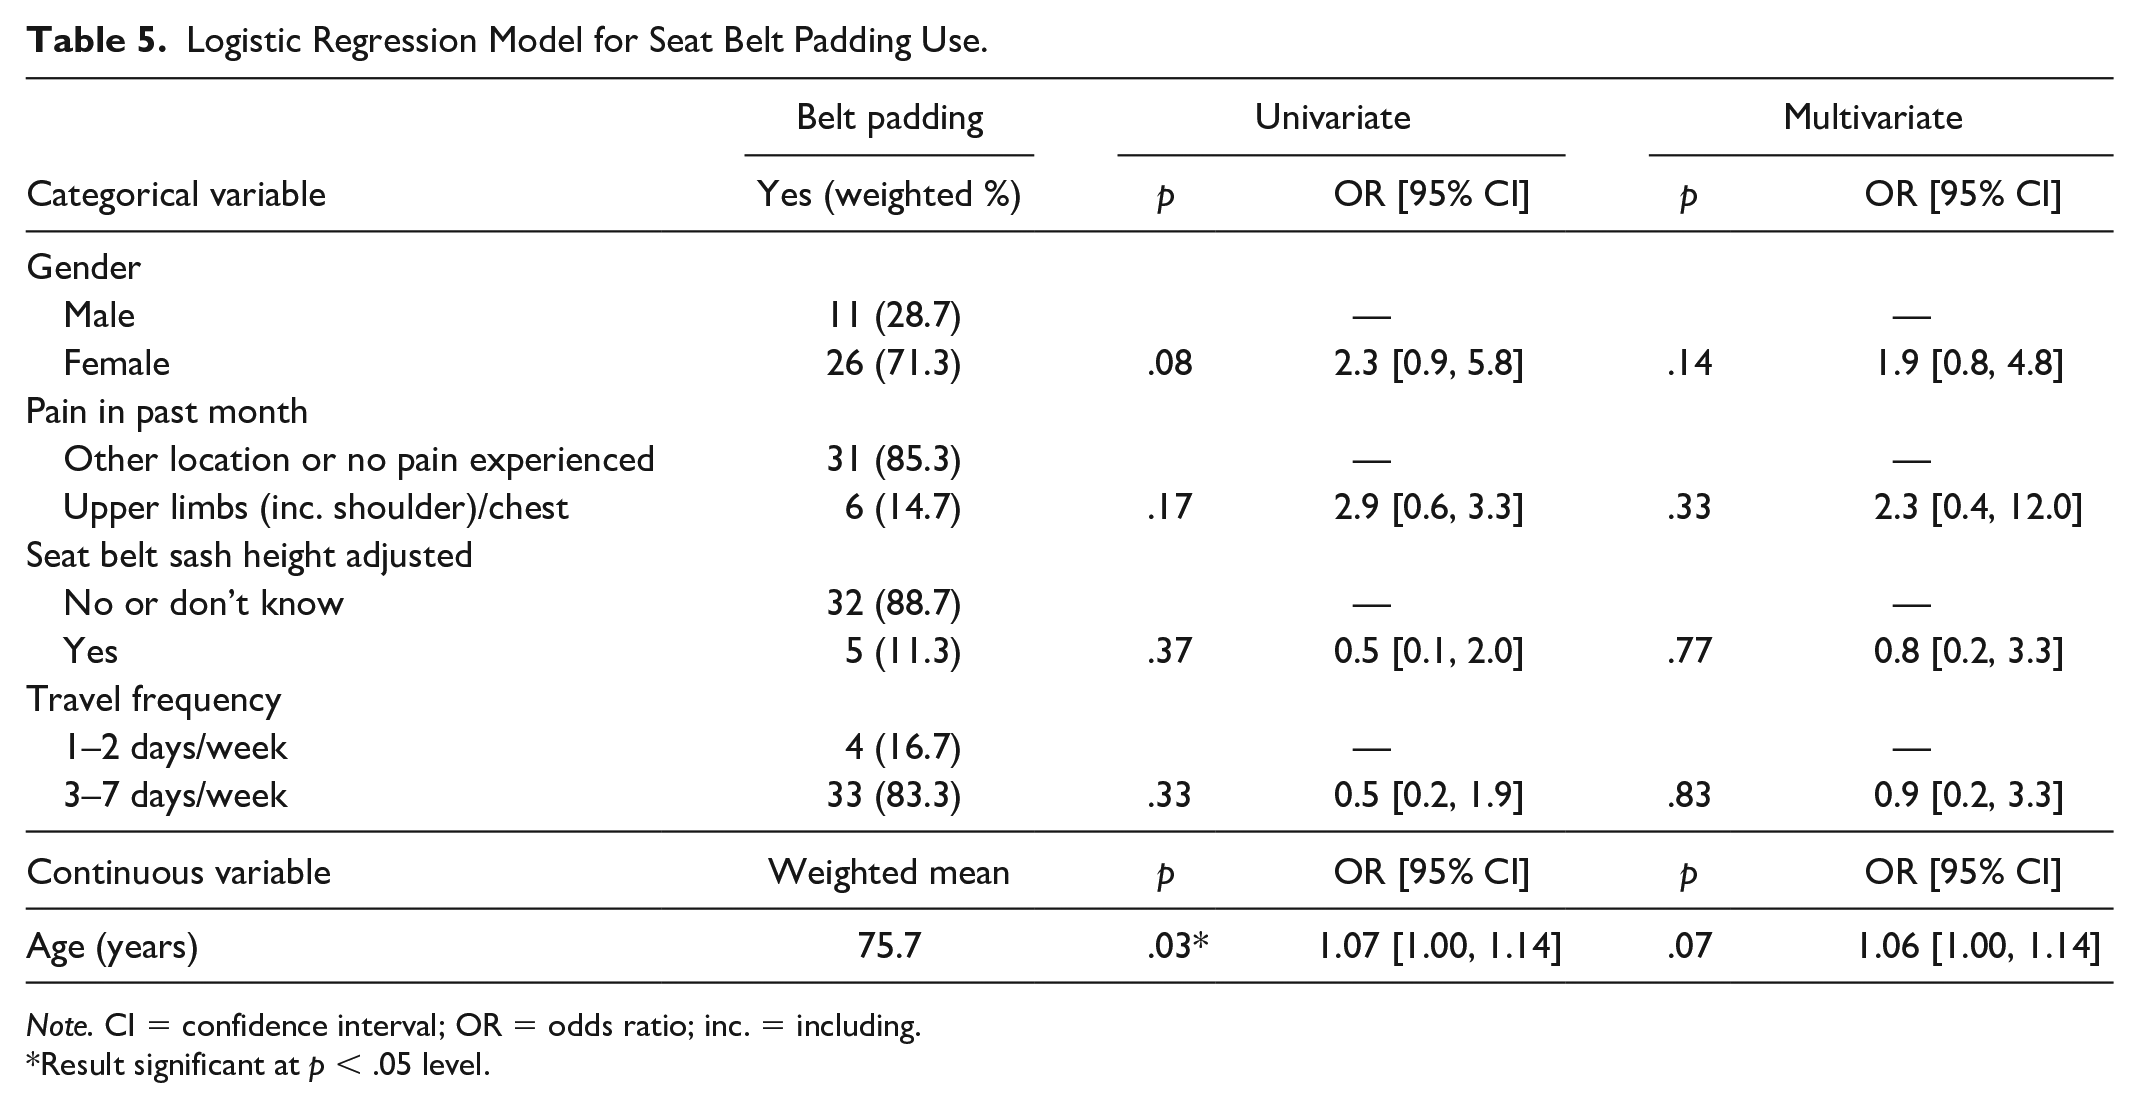
Note. CI = confidence interval; OR = odds ratio; inc. = including.
Result significant at p < .05 level.
Factors Associated With the Use of Seat Cushions
There was a significant association between car seat cushion use with gender (p < .01) and age (p < .001). Females had 3.2 times greater odds (95% CI = [1.3, 7.3]) of sitting on cushions during travel, compared to males. When controlling for incontinence, pain, travel frequency, and age, the association of gender with car seat cushion use remained significant (p < .01; OR: 3.8, 95% CI = [1.6, 9.1]). With every year increase in age, the odds of older drivers/passengers sitting on cushions during car travel increased by 11% (95% CI = [5%, 16%]). The association with age remained significant in the multivariate model (p < .001; OR: 1.13, 95% CI = [1.06, 1.19]). When controlling for gender, incontinence, pain, and age, travel frequency was also significantly associated with cushion use. Those who routinely traveled in a vehicle (3–7 days a week) had 7.3 times greater odds (95% CI = [1.2, 42.7]) of using a cushion to sit on than those who reported only traveling 1 to 2 days a week (p < .05). Table 6 displays the logistic regression results for cushion use. A significant interaction between incontinence and travel frequency was also identified (p < .0001).
Logistic Regression Model for Cushion Use.
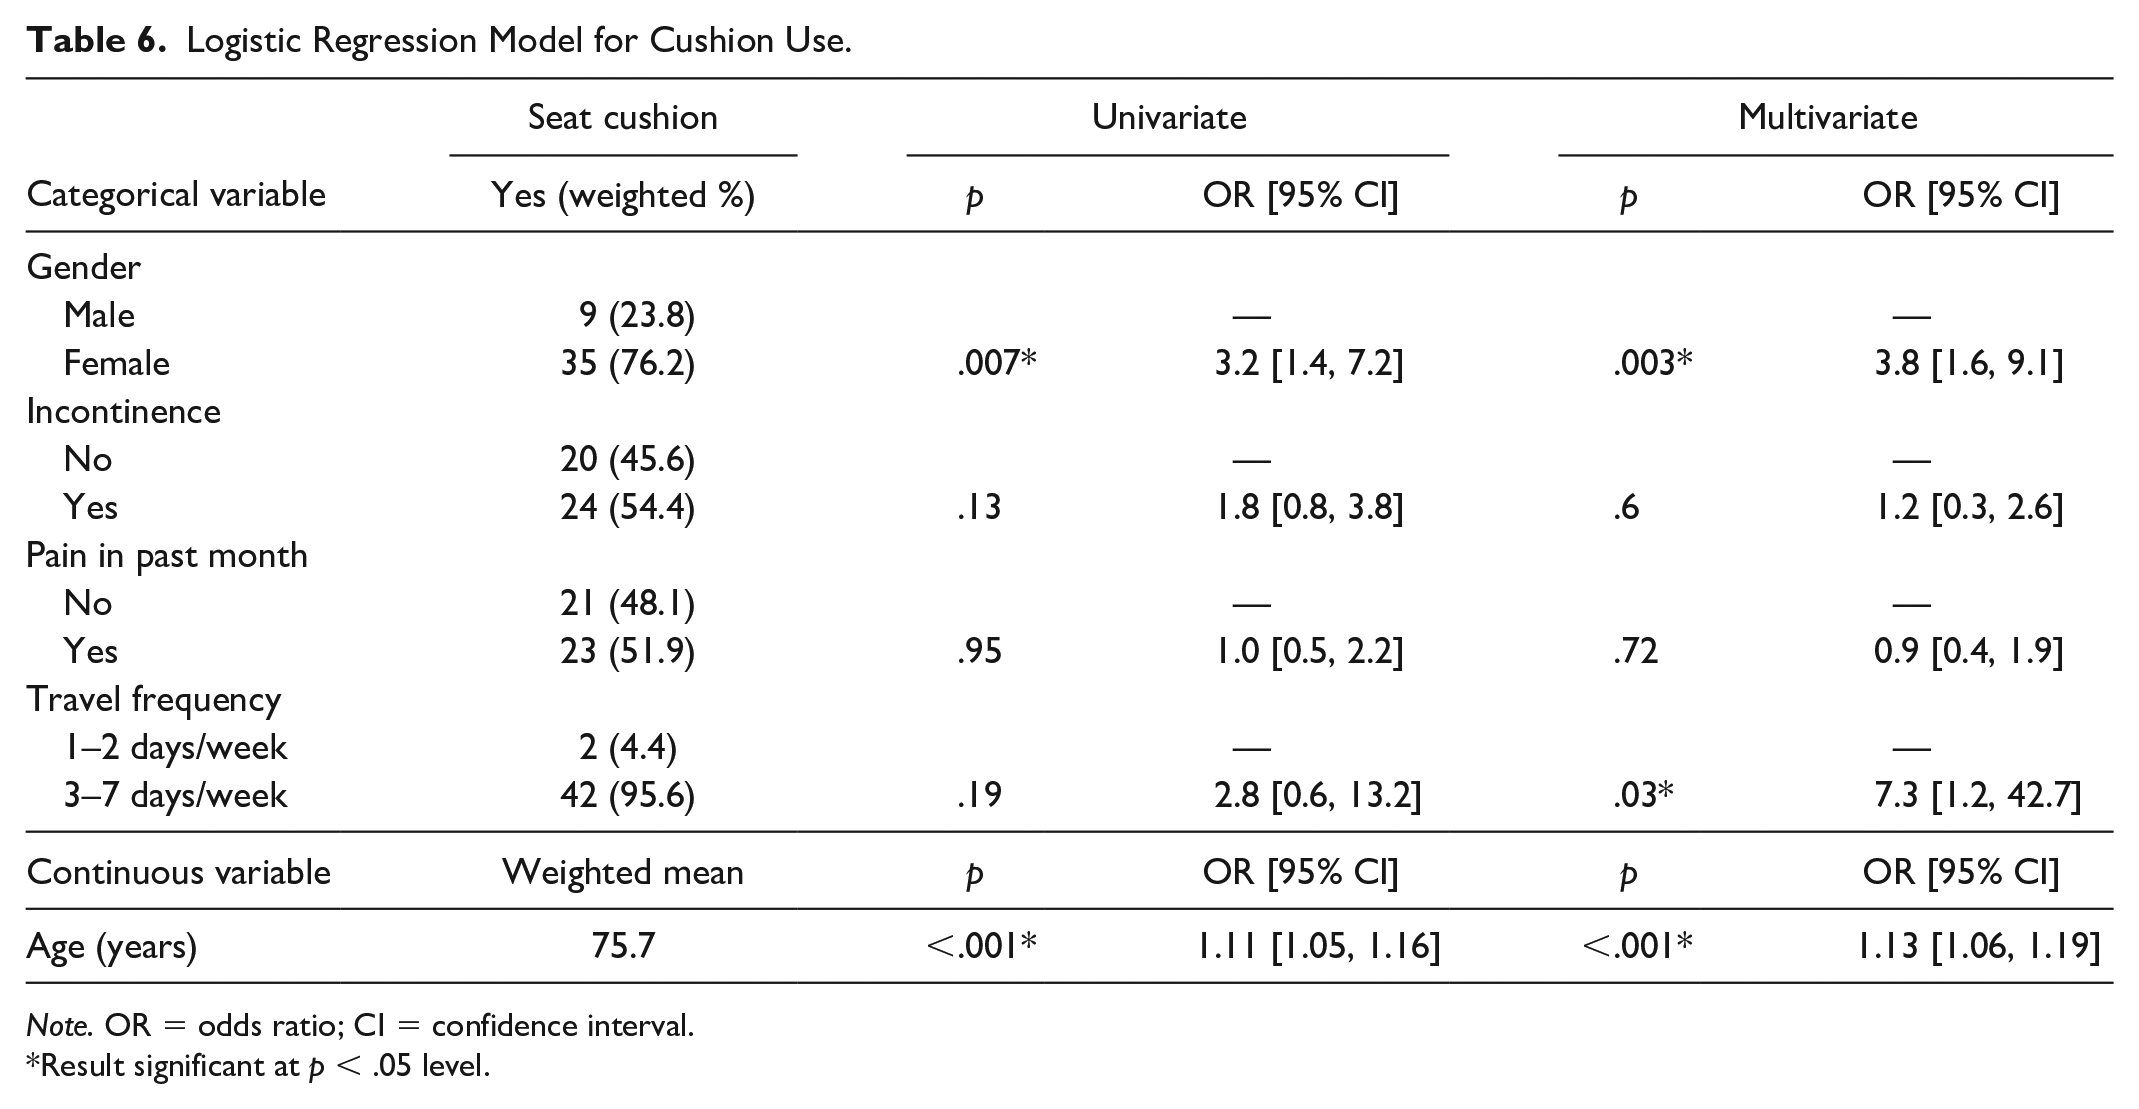
Note. OR = odds ratio; CI = confidence interval.
Result significant at p < .05 level.
A subgroup analysis by incontinence status revealed that significant associations between car seat cushion use and age and gender remained for those who reported some incontinence (age OR: 1.13, 95% CI = [1.05, 1.22]; females compared with males OR: 10.10, 95% CI = [1.69, 59.94]). However, travel frequency was no longer significant for this subgroup. For the group without incontinence, only age remained significantly associated with cushion use (OR: 1.13, 95% CI = [1.04, 1.23]). The frequency of travel could not be included in this model due to a zero-value cell as there were no people in the “no incontinence” group who used a cushion and traveled infrequently (i.e., 1–2 days a week). Therefore, among those with no incontinence, all cushion users also traveled in a vehicle 3 to 7 days a week.
Factors Associated With the Use of Neck/Back Supports
Back and neck support accessories used were modeled as the third outcome. Only univariate associations were explored due to the low frequency of positive outcomes (n = 18). There was a significant association between the use of back/neck support accessories and pain experienced in the back/neck or multiple areas (p = .002). Older drivers/passengers with back/neck or multiple areas of pain had 6.8 times the odds (95% CI = [2.0, 22.8]) of using back/neck support accessories during travel, compared to those experiencing no pain or pain in other areas. Univariate associations between back/neck support use with gender, incontinence, travel frequency, and age were not significant (Table 7).
Univariate Analyses for Back/Neck Support Use.
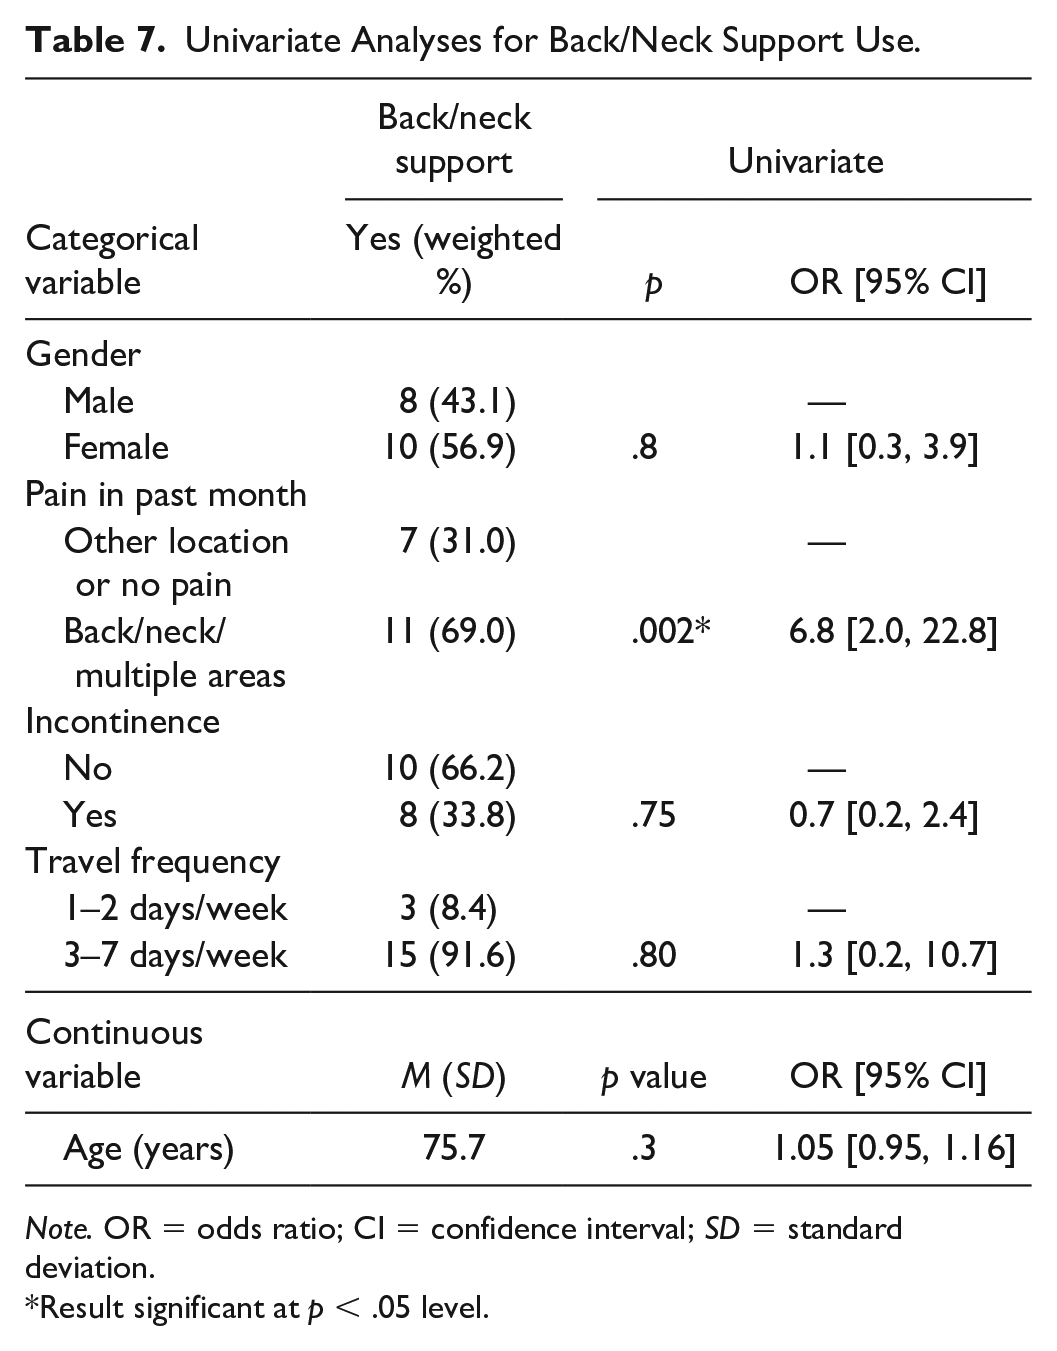
Note. OR = odds ratio; CI = confidence interval; SD = standard deviation.
Result significant at p < .05 level.
Discussion
This population-level survey confirms a relatively high rate (25.7%, 95% CI = [19.6, 31.9]) of use of comfort and orthopedic accessories among Australians aged 65 years and older when traveling in cars. The most commonly used accessory was a cushion placed on the vehicle seat, and increasing age (OR: 1.13, 95% CI = [1.06, 1.19]), female gender (OR: 3.8, 95% CI = [1.6, 9.1]) and frequent vehicle travel (OR: 7.3, 95% CI = [1.2, 42.7]) were associated with increased odds of use of this form of accessory. However, these associations varied depending on incontinence status. Among those with some incontinence, only age and female gender were significantly associated with cushion use. Conversely, all cushion users among those without incontinence were also frequent vehicle travelers, and female gender was not a factor in this group.
The use of padding on the seat belt was the second most common form of accessory, but the use of these devices does not appear to be related to demographics, health, or travel behavior. Intuitively, the use of these devices might be due to discomfort that occurs when the seat belt rubs against the neck. We previously identified seat belt discomfort among older drivers as more likely with shorter stature (Fong et al., 2016); however, we did not examine the role of discomfort or stature in use of comfort accessories in this study. Items placed behind the driver/passenger for back/neck support were the least commonly used accessory, and pain in the back, neck, and/or multiple areas significantly increased the odds of use of these accessory types (OR: 6.8, 95% CI = [2.0, 22.8]).
The estimated incidence of comfort aid/accessory use in this population-level sample of Australians aged 65 years and older was similar to that seen in our earlier convenience sample of drivers aged 75 years and older, where 26% of the sample were observed to use some form of accessory. We constructed our current sample to represent older drivers by gender, age, and geographical distribution and used weighting adjustments to ensure our data matched population age distribution by location. While we did not adjust for disability, we measured disability across our sample using WHODAS 2.0. Comparing our weighting-adjusted sample with WHODAS 2.0 normative data from a population-level survey in Australia in 2009 (Üstün, Kostanjsek, et al., 2010), our sample also closely represents the general Australian population in this regard. In our weighting-adjusted sample, the WHODAS mean for 65 to 74 years was 3.4 and for 75+ years was 4.4 compared with normative data means for 65 to 74 years of 3.7 (SD = 5.5) and for 75+ years of 5.7 (SD = 7.1). Our gender distribution also closely matched the overall NSW population (53.9% female in our weighting-adjusted sample and 53.6% in the general population).
The incidence of reported use of accessories appears higher than that reported from baseline data collected in a large longitudinal cohort study of older drivers in the United States. In that study, it appears that approximately 10% were using some form of seat cushion, 2% were using some form of seat belt padding, and <1% were using an “upper torso support” which may be equivalent to what we have called lumbar/back supports (Zanier et al., 2019). These differences may be due to the criteria used to construct the cohort sample in that study as the study is limited to drivers, a specific age group, and as noted by the authors (Eby et al., 2018), the inclusion criteria may have excluded participants with “significant disabilities.” Alternatively, the differences in proportion of older people using these devices between Australian and the US may simply reflect differences in population behavior and/or vehicle fleets.
Given recent reports that some types of accessories can have negative impact on crash protection (Whyte et al., 2020), it is concerning that one in four older people in NSW Australia may be using some form of accessory when they travel in a car. It is currently unknown if any of the accessories being used by older people in cars provide any benefit in terms of orthopedic support or increased comfort. If there are situations when accessories are beneficial, there is a need for clear guidance on the appropriate design of such accessories to ensure no negative impact on crash protection. This is an area of enquiry requiring further attention. It is interesting to note that <1% of those using accessories indicated that accessory use had been suggested by a health care professional. This is a similar finding to that reported by Eby et al. (2018) in looking at vehicle adaptions more broadly where the authors reported that overwhelmingly people making adaptions were not working with professionals in making these adaptions. While the results of this study provide some insight into who may be more likely to use cushions placed on the seat and indicate that recent experience of pain increases the odds of use of some type of accessories (back/neck supports), further insight into the reasons older people are choosing specific types of accessories is needed.
However, the findings from this study do indicate that there are likely to be different reasons people use the different types of accessories. In our previous work, we identified that use of any type of accessory was more likely reported by drivers who also reported discomfort with the seat belt (Coxon et al., 2014; Fong et al., 2016), and we also previously reported increased odds of reporting seat belt discomfort with female gender and shorter stature (Coxon et al., 2014; Fong et al., 2016). The use of seat cushions may reflect an attempt to correct discomfort introduced by a poor match between the anthropometry of shorter, older adults (and females) and the geometry of the seat belt. However, to date, there has been no work that has explicitly asked people why they choose to use these devices. Comfort issues underlying the use of these devices require further investigation and attention to potential in-vehicle seat and seat belt adjustments that could rectify such problems in modern vehicles. Ultimately, the priority is to ensure comfort and safe mobility for people traveling in cars.
For all types of accessories placed on the vehicle seat, including lumbar and back supports, we previously examined the associations between use of these accessories and functional co-morbidities using the Functional Comorbidities Index (FCI) using a mediation analysis and found a significant relationship between an increased FCI score and accessory use that was not mediated by reported discomfort (Brown et al., 2017). Together with the current findings it would seem pain and possibly health conditions like incontinence may also contribute to at least some of this seat cushion use and might explain the previously identified relationship between FCI and accessory use.
There was a high incidence of pain overall in this population-level sample of older Australians aged 65 years and older, with participants commonly reporting the back and multiple regions as sources of this pain. The significant association between pain in these regions and use of back/neck supports suggest that this an area where future research might be targeted.
It is important to note that we were unable to collect information about the types of vehicles, and inherent differences in vehicle seat designs in which the participants traveled and used different forms of accessory, and so the impact of vehicle and/or design on the findings of this study remains unknown. Given the high prevalence of back pain, and low use of lumbar supports, it is possible that seat design may be a mediator of lumbar support use. We also did not attempt to collect granular sociodemographic data such as level of education or annual income. It is possible that these types of demographic factors might be associated with the use of accessories and this should be explored in future studies. Travel behavior was measured in terms of driving space and number of days in a typical week during which the participant traveled in car. It is possible that absolute time spent in a car may be an influencing factor, but these data were not collected.
This work has focused on older people given the increased risk of injury in crashes (Cerrelli, 1998; Meuleners et al., 2006) and need to ensure optimum protection from existing technologies like seat belts. However, there have also been no studies examining discomfort and/or accessory use in younger drivers and vehicle passengers, so it is unknown if this accessory use issue is specific to the older population or if it is more widespread.
As with any research study, there are a number of potential limitations to keep in mind. The population-representative sample construction method used relies on the assumption that all possible members of a population have an equal probability of being included in the sample. The use of random digit dialing overcomes issues of non-listed numbers, but there may be some households without phones. Another potential source of bias in this sample method is non-response among eligible people invited to participate; however, the participation rate was extremely high at 93.2% in this study providing confidence that a representative sample was achieved.
The other main limitations are the reliance on self-report and the potential for social desirability bias. However, the close concordance with observed accessory use in the convenience sample provides some confidence that this likely had little impact here. Similarly, we relied on self-reported measures of health and travel behaviors.
The strength of this work is the attempt to collect a population-level sample and the close resemblance of this sample to population WHODAS data, as well as the fact that this work is the first to examine relationships between potentially relevant aspects of health and travel behavior and the use of different types of comfort and orthopedic accessories in cars. The findings of this study identified women and those experiencing incontinence and pain (particularly in the back, neck, and across multiple regions) as the priority population for further study and potential interventions.
Going forward, we aim to use these findings to examine the physical characteristics of the types of comfort aids used and link these with the impact on crash protection using crash testing and also to explore any potential benefit from clinical interventions. Ultimately, our objective is to establish guidelines for the design of comfort aids for use in vehicles which are compatible with optimal crash protection and include the provision of these guidelines in the general care of those in need or at most risk.
Footnotes
Declaration of Conflicting Interests
The author(s) declared no potential conflicts of interest with respect to the research, authorship, and/or publication of this article.
Funding
The author(s) disclosed receipt of the following financial support for the research, authorship, and/or publication of this article: This study was funded by a Ramaciotti Foundation Health Investment Grant.