



Abstract
Although living arrangements of American adults have changed significantly over the past decades, we know little about changes in the association between living arrangements and health. This study uses pooled data from 1997 to 2018 National Health Interview Survey to examine trends in living arrangements and health among middle-aged (ages 40–64) and older adults (ages 65–84). The results show that increasing share of middle-aged and older adults are living with persons other than their spouses or cohabiting partners, and this living arrangement is increasingly associated with poor health. Co-residence with persons other than spouses or cohabiting partners is particularly related to serious psychological distress among older adult women. Living alone in midlife is increasingly associated with poor health, but there has been little change in health of older adults living alone. The findings call for targeted policies and programs to address the needs of middle-aged and older adults in diverse living arrangements.
Introduction
Following decades of health improvements, midlife mortality and morbidity reversed course at the turn of the 21st century (Case & Deaton, 2015). A recent study (Lamidi, 2021) highlights the role of union status in self-rated health trends in midlife. The findings suggest that recent health decline in midlife was confined to unmarried adults. Trends in health disparities by union status represents an important area of research, but studies of health differentials across union statuses fail to account for the household environment in which people live. Analysis of trends in health by union status assumes similarities in people’s experiences across married-couple households. However, a growing body of research shows that beyond union status, living arrangements matter to health (Henning-Smith, 2016; Henning-Smith & Gonzales, 2020; Hughes & Waite, 2002). Married persons living in complex households show poorer physical and psychological wellbeing than those living with spouse only (Hughes & Waite, 2002). As American adults increasingly share their homes with other persons, a concept known as “doubling up,” “shared living,” or “household sharing” (Fry, 2018; Mykyta & Macartney, 2012), it is important to understand how the health of adults in various living arrangements has changed in recent decades.
Although a number of studies have examined health implications of shifting living arrangements of older adults in other contexts (Shaw et al., 2020), analyses of trends in health in relation to changing living arrangements of American adults are sparse. The present study fills this gap by analyzing recent trends in physical and mental health of middle-aged and older adults across four living arrangements—living with spouse/cohabiting partner only (reference), living alone, living with spouse/cohabiting partner and other people, and living with other people only. Previous analyses have shown continued health improvements among older adults in the U.S. (Case & Deaton, 2015), but recent changes in family experiences of elderly Americans suggest disparities in health trends by living arrangements.
Changing Living Arrangements and Health in Midlife and in Later Life
A growing body of literature indicates that living arrangements are significantly related to the physical and mental health of older adult populations (Henning-Smith, 2016; Henning-Smith & Gonzales, 2020; Weissman & Russell, 2018). For instance, compared to older adults co-residing with their spouses (or cohabiting partners), elderly persons living with other people, related or unrelated, are more likely to report fair or poor self-rated health, serious psychological distress, need for help with activities of daily living (ADLs), and they have significantly lower quality of life (Henning-Smith, 2016; Weissman & Russell, 2018). The link between co-residence with other persons and poorer health seems particularly strong among older adult women (Henning-Smith, 2016).
Living alone, one of the two more common living arrangements in the U.S., also predicts poorer health among some middle-aged and older adults. Research (mostly cross-sectional) suggests older adults living alone fare worse than those living with just their spouses/cohabiting partners on a number of health indicators, including psychological distress, quality of life, and mortality (Henning-Smith, 2016; Shaw et al., 2020; Weissman & Russell, 2018). Living alone is associated with significantly worse self-rated health in midlife, but significantly better self-rated health among older adults (Henning-Smith & Gonzales, 2020; Weissman & Russell, 2018).
Research has identified a wide range of demographic, health-related, economic, and familial factors that predict preferences for diverse living arrangements across cultures (Lai, 2005). But living arrangements are also important to health because of their links to health-related factors such as living conditions, patterns of social interactions, access to social support and economic resources, as well as caregiving needs and responsibilities (Cohen, 2004; Greenfield & Russell, 2011; Hughes & Waite, 2002). Though a preferred and often beneficial choice of living arrangement among some older adults (Klinenberg, 2013), solo living is a major risk factor for social isolation and poverty (Greenfield & Russell, 2011). Relative to those living with spouses/partners only, older adults living alone tend to be poorer (Henning-smith, 2016; Weissman & Russell, 2018). Solo dwellers are also increasingly more likely to be divorced than to be widowed (Wu, 2017), suggesting that poor socioeconomic status and negative life events constrain some middle-aged and older adults to live alone. Living with others, as in married-couple households, provides potential access to social capital, economic resources, and social support (Cohen, 2004). However, living with others could also be indicative of poor socioeconomic and health status or a potential source of strain due to caregiving responsibilities and inter-household conflict (Henning-smith, 2016; Hughes & Waite, 2002).
In recent decades, there have been notable changes in living arrangements of middle-aged and older Americans. The rise in living alone in midlife and in later years has been widely documented (Klinenberg, 2013; Reher & Requena, 2020). Complex households are also on the rise. The share of young adults aged 18–34 living with their own parent(s) or their partner’s/spouse’s parent(s) increased from 29% in 2007 to 33% in 2018 (Payne, 2019). Similarly, the share of U.S. adults living in shared households increased from 27% in 2004 to 32% in 2017 (Fry, 2018). Increases in young adult parental co-residence is part of growing multigenerational households in recent decades, a trend that has been linked to recent retreat from marriage and declining economic opportunities among young adults (Taylor et al., 2010). Yet, more adults live in shared households than in multigenerational households (Fry, 2018).
Changes in living arrangements may be linked to changes in family experiences over time. Research shows median age at first marriage is at a record high level (Ruggles, 2016), and cohabitation is increasingly replacing remarriage after divorce or widowhood in later life (Brown & Wright, 2017). Increasing share of never-married adults coincides with rising rates of divorce among middle-aged and older adults (Brown & Wright, 2017). Marriage decline means decreasing share of adults living with spouse/cohabiting partner, while growing shared living suggests increasing share of adults living with other persons. Given changing family structures and norms surrounding different living arrangements, we investigate changing health patterns across living arrangements. The nuanced relationship between each living arrangement and health is beyond the scope of this study.
Changing Sociodemographic Characteristics and Family Experiences of Middle-Aged and Older Adults in the U.S.: Implications for Living Arrangements and Health Trends
Recent demographic changes and shifts in family behaviors suggest changing composition of persons living in different arrangements in the U.S., particularly in terms of race/ethnicity and socioeconomic status. At the population level, today’s middle-aged and older adult populations are more racially/ethnically diverse than previous cohorts (US Census Bureau, 2021), and living arrangements vary by race/ethnicity (Reher & Requena, 2020). Racial/ethnic minorities are far more likely than whites to live in multigenerational households (Taylor et al., 2010), but living alone is more common among whites (Reher & Requena, 2020). Marriage decline and rising divorce rates have been more pronounced among racial/ethnic minorities than among whites (Raley et al., 2015). The above trends suggest shifting racial/ethnic composition of married-couple and single households.
Further, compared to previous generations, recent cohorts of middle-aged and older adults are more educated and are staying in the labor force longer (Bloome & Western, 2011). However, the past few decades were characterized by growing socioeconomic and social inequalities in the U.S. (Bloome & Western, 2011; Cherlin, 2014; Ruggles, 2016). Over this period, employment opportunities available to men and less-educated adults shrunk, even as wages declined (Cherlin, 2014; Ruggles, 2016). Meanwhile, middle-aged and older adult households in the top income quintile recorded gains in household income and wealth (Government Accountability Office, 2019).
Growing economic and social inequalities, as well as cultural changes of the past decades, have arguably brought about divergent patterns of union formation, union dissolution, and therefore, living arrangements across socioeconomic spectrum (Cherlin, 2014; Smock & Schwartz, 2020). College-educated American adults are increasingly more likely, than less-educated ones, to form stable marital unions (Smock & Schwartz, 2020). As marriage becomes more selective of highly educated and white Americans (Cherlin, 2014; Ruggles, 2016), middle-aged and older adults in married-couple households may be increasingly more socioeconomically advantaged, relative to those in other living arrangements. On the other hand, socioeconomically disadvantaged adults may have become more represented among adults living with persons other than their spouses/cohabiting partners. Older adults with greater income and wealth are more likely to pursue independent living because they have the ability to afford homes based on local housing markets (Mutchler & Burr, 2003; Mutchler et al., 2017). Limited economic resources, higher cost of living, and housing crises decrease the likelihood of living alone (Mutchler & Burr, 2003) and may result in more economically disadvantaged older adults living with others.
In light of changing living arrangements and socioeconomic characteristics of adults in different living arrangements, we investigate changes in the association between living arrangements and health among middle-aged and older adults in the U.S. It is important to note that changing sociodemographic characteristics of U.S. adults and the associated changes in living arrangements largely reflect cultural changes of the past several decades, particularly increasing acceptance of diverse family arrangements, as well as shifts in the economy (Cherlin, 2014).
The Present Study
The primary goal of this study is to examine trends in health by living arrangements among middle-aged and older adults. We assessed trends in three health outcomes—self-rated health, ADL limitations, and psychological distress—between 1997 and 2018. Considering differences by gender and age group, in the association between living arrangements and health (Henning-Smith & Gonzales, 2020; Weissman & Russell, 2018), we stratified all our analyses by gender and by age group.
Method
Data and sample
We used data from the 1997 to 2018 National Health Interview Survey (NHIS). We accessed the integrated NHIS data through the Minnesota Population Center as part of the Integrated Public Use Microdata Series (IPUMS) (Lynn et al., 2019). The general design of the NHIS has remained mostly the same over the years, but a recent redesign (2016) eliminated most oversampling by race/ethnicity among adults under the age of 65; oversampling of black, Hispanic, and Asian older adults continued till 2018. More detailed information about the complex design and sampling procedures of the NHIS are available through IPUMS.
The NHIS samples civilian noninstitutionalized persons living in the U.S., excluding individuals living in long-term care facilities and other institutionalized persons. The survey, which is conducted yearly by the National Center for Health Statistics (NCHS), covers a wide range of health topics. NHIS also includes information about respondents’ household composition and union status which we used to determine the living arrangements of adults in this study. Through personal household interviews, the NHIS collects information about sociodemographic characteristics, general health, and functional limitations among all household members. Therefore, our analyses of self-rated health and limitation with ADLs are based on data collected from all household members as part of the family core interviews. Additional questions, including questions about psychological distress, are asked of one sampled adult person per household.
Descriptive Statistics of Variables Included in the Analysis.
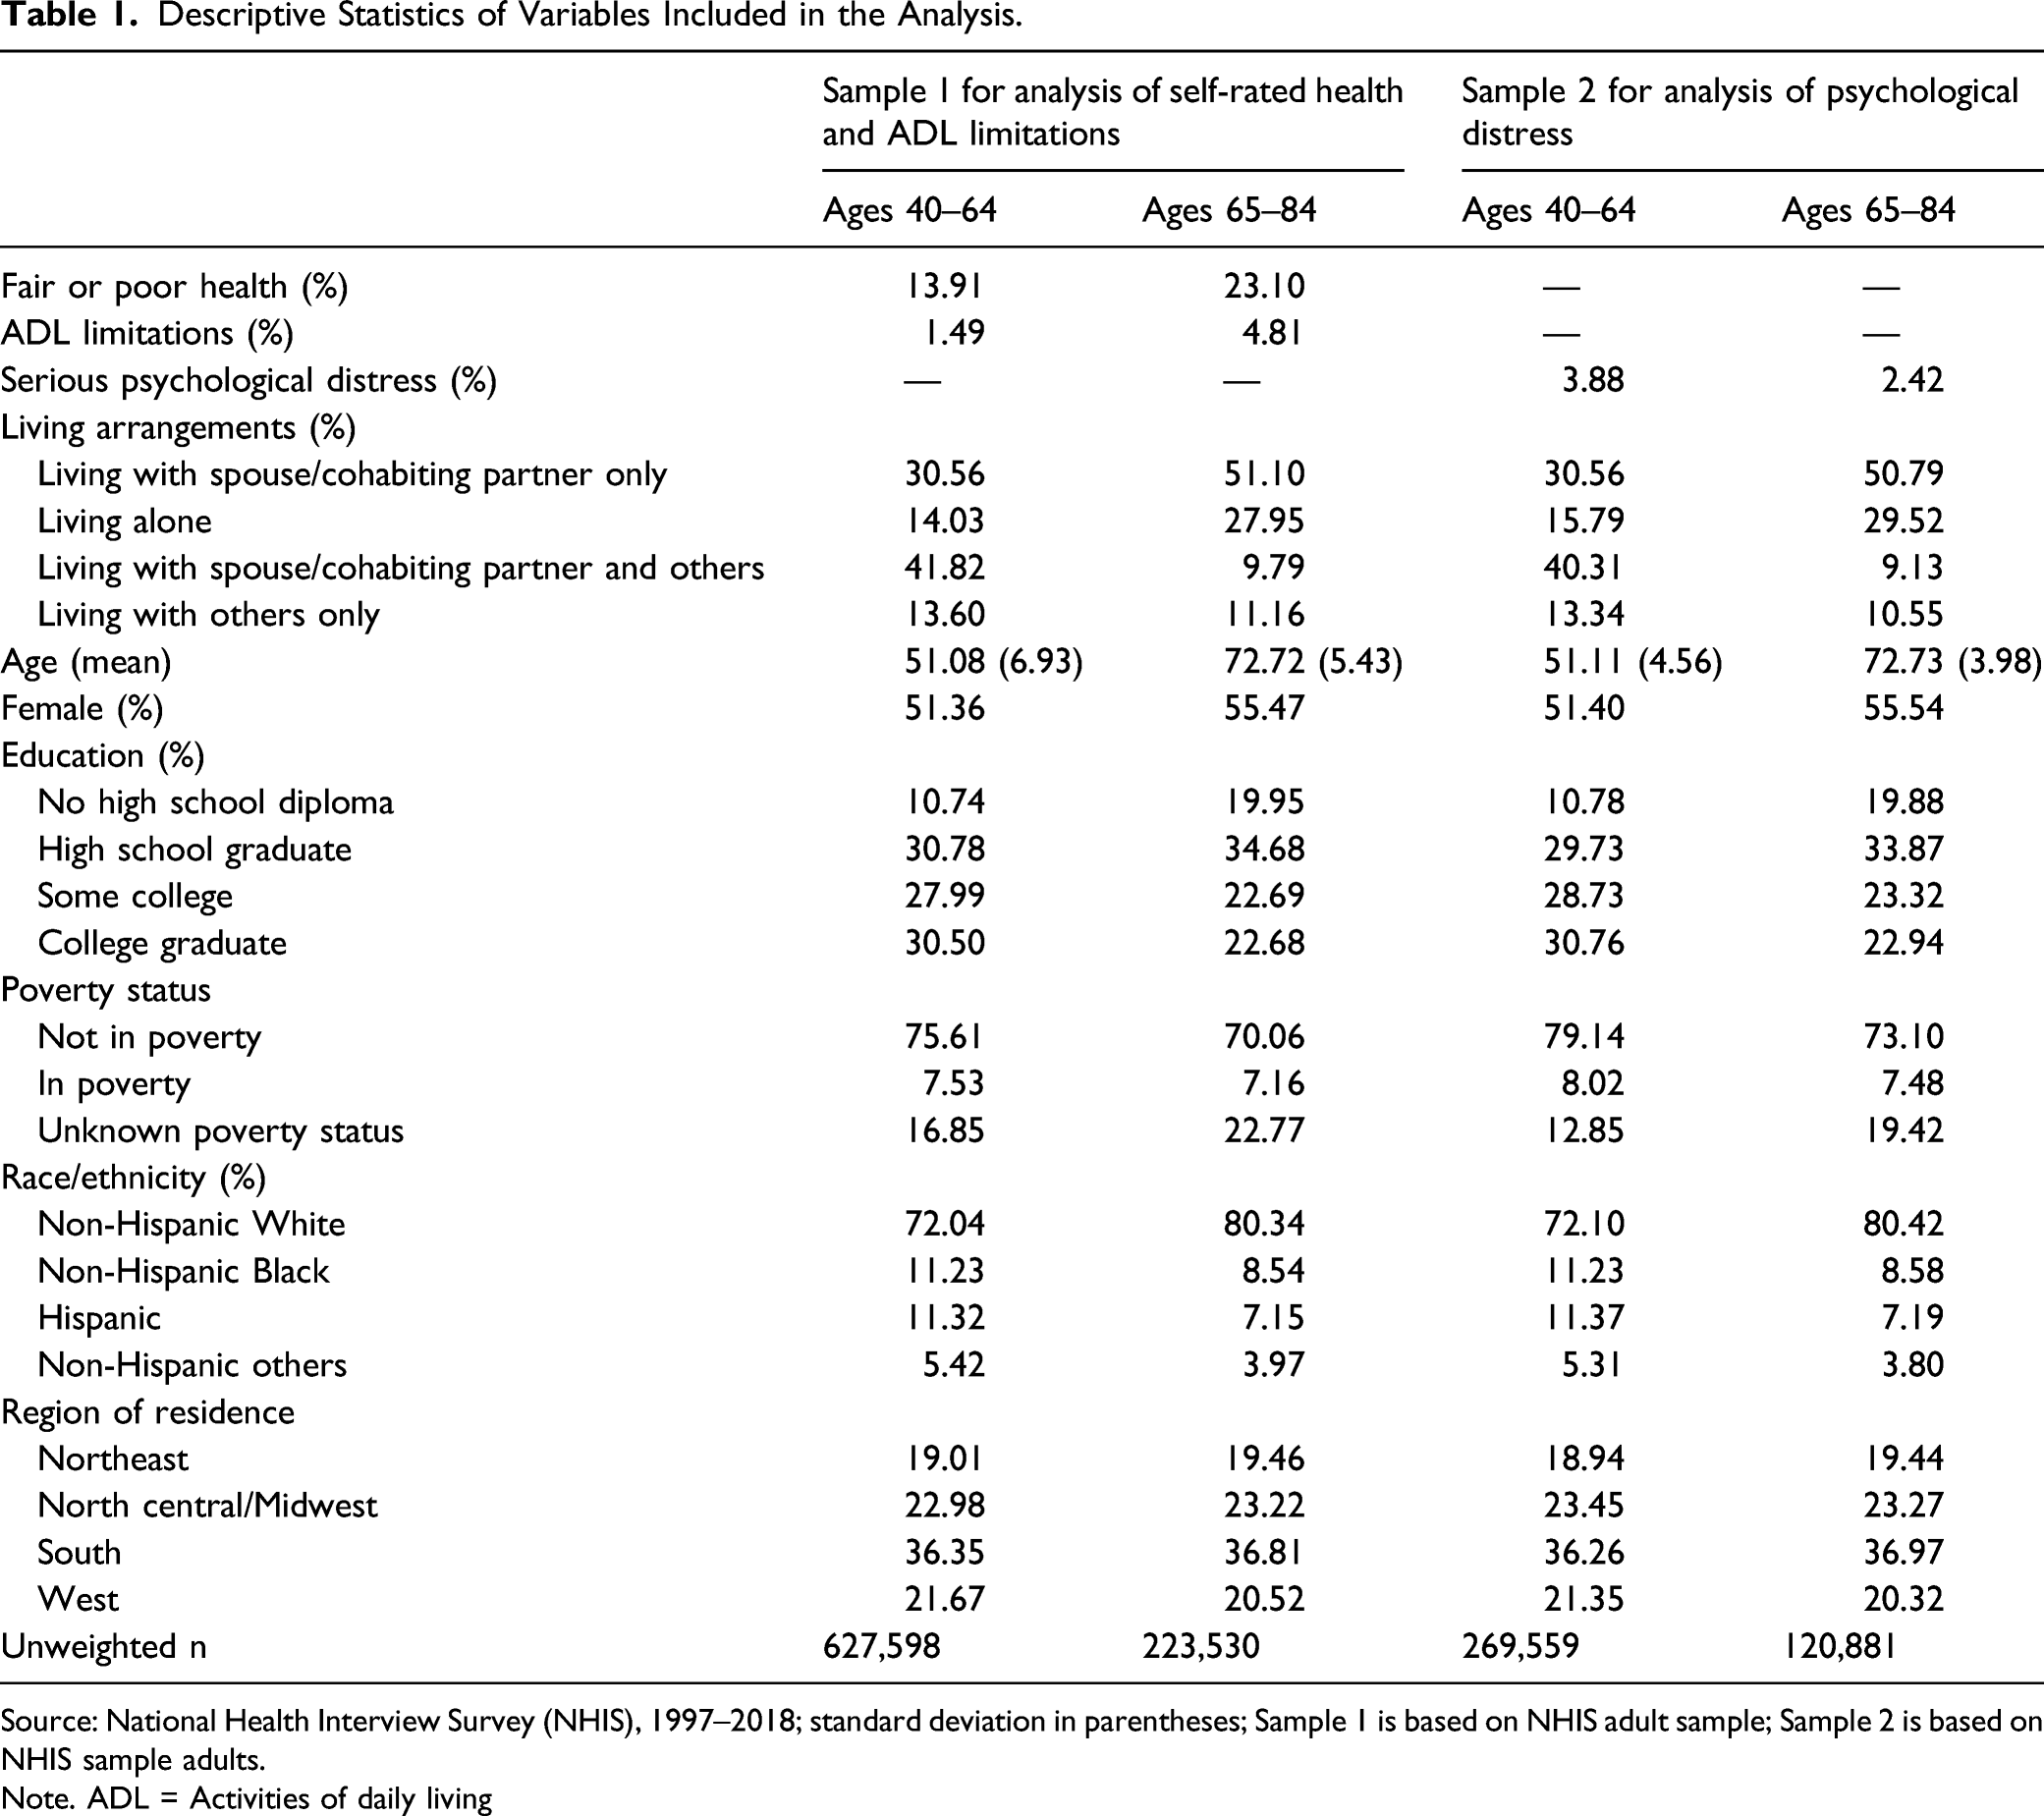
Source: National Health Interview Survey (NHIS), 1997–2018; standard deviation in parentheses; Sample 1 is based on NHIS adult sample; Sample 2 is based on NHIS sample adults.
Note. ADL = Activities of daily living
Dependent Variables
We analyzed trends in self-rated health, ADL limitations, and serious psychological distress. Respondents rated their health as “excellent, very good, good, fair or poor.” Consistent with prior research, we dichotomized self-rated health, with a value of “0” indicating excellent/very good/good health, and “1” fair/poor health. Respondents also indicated whether they needed the help of another person “with personal care needs, such as eating, bathing, dressing, or getting around inside the house” (ADLs). A value of “0” indicates needing help with ADLs, and “1” not reporting such need. We measured psychological distress using the widely used Kessler 6 (K6) scale (Kessler et al., 2002). Sample adult persons reported how often they experienced, over a 30-day recall period, the following: (1) felt that everything was an effort, (2) felt hopeless, (3) felt nervous, (4) felt restless or fidgety, (5) felt sad, and (6) felt worthless. Responses range from “none of the time” (0), to “all of the time” (4). The sum of responses to the six items ranges from 0 to 24. We measured serious psychological distress as having a score of 13 or higher on the Kessler scale.
Independent Variables
The main independent variables are trend and living arrangement. The trend indicator is based on survey year. We assessed health trends over five survey periods—1997–1999 (reference), 2000–2004, 2005–2009, 2010–2014, and 2015–2018. We adopted categorical measure of year because of some nonlinear trends in psychological distress (shown graphically), both in midlife and among older adults. Living arrangement is measured in four categories, based on union status and household composition. These are: living with spouse/cohabiting partner only (reference), living alone, living with spouse/cohabiting partner and other people, and living with other people only (i.e., no spouse/cohabiting partner in the household). Living with others encompasses living with young or adult children, sibling, grandparent, other family members, and nonrelatives. We could not separate co-residence with spouses/cohabiting partners because of sample limitations.
Other Covariates
We controlled for key sociodemographic characteristics that are related to living arrangements and health (Henning-Smith, 2016; Henning-Smith & Gonzales, 2020; Weissman & Russell, 2018). Age is measured in continuous year, and it ranges from 40 to 64 for middle-aged adults, and 65 to 84 for older adults. Education is measured in four categories: no high school diploma, high school graduate, some college, and college graduate (reference). Respondents with family income at or above the U.S. Census Bureau’s poverty thresholds were considered not in poverty (reference), while those with family income below those poverty thresholds were categorized as being in poverty. We included an additional category to account for respondents with missing information on poverty status. Race/ethnicity includes non-Hispanic white (reference), non-Hispanic black, Hispanic, and non-Hispanic others. The NHIS samples respondents from across the four regions of the country—the Northeast (reference), Northcentral/Midwest, South, and West.
Analysis
We examined changes in living arrangements and health among middle-aged (40–64) and older (65–84) adults in the U.S. Our descriptive analysis explored changes in living arrangements and health between 1997–1999 and 2015–2018. Next, we assessed trends in health of middle-aged and older adults in a series of logistic regression models predicting the odds of reporting fair or poor health, need for help with ADLs, and serious psychological distress. Each logistic regression model includes controls for age, education, poverty status, race/ethnicity, and region of residence. We estimated separate models for each age group (40–64 and 65–84) and gender category (men and women). Significant interaction terms between indicators of year and living arrangements in the logistic regression models indicate significant differences in self-rated health trends across living arrangements. For ease of interpretation, we generated and graphed predicted probabilities of each health outcome, and by living arrangement, over the study period. All the analyses are weighted to account for the complex survey design of the NHIS.
Results
Table 1 describes the sample characteristics, separately for middle-aged and older adults. We presented the sample characteristics for the analysis of psychological distress separately because questions about psychological distress were only asked among NHIS sample adults. Larger shares of older adults reported fair or poor health and ADL limitations, but serious psychological distress was more prevalent in midlife. Most respondents lived with their spouses/cohabiting partners, with or without other persons in the household. Older adults having no co-residential partners were more likely to live solo than with other persons, but living with other people was nearly as common as solo living around midlife. On average, the middle-aged and older adult samples were aged 51 and 73, respectively. The younger sample appears economically advantaged (comprises larger shares of college-educated respondents and those living above poverty), but the older adult sample has a smaller share of minoritized racial/ethnic group members.
Changes in living arrangements and health of older adults in the U.S.

Source: IPUMS Health Surveys: National Health Interview Survey (NHIS) 1997–2018.
aIndicates significant difference in value (for each period and for the same gender group) between a living arrangement and living with spouse/cohabiting partner only.
bIndicates significant difference in value between 1997–1999 and 2015–2018.
Changes in the three health indicators examined in this study indicate worsening health in midlife. Across living arrangements, larger shares of middle-aged adults reported fair or poor health, limitations with activities of daily living, and serious psychological distress in 2015–2018 than in 1997–1999. Changes in self-rated health and ADL limitations were most pronounced among middle-aged adults living alone. Increases in the share reporting fair or poor health were also notable and statistically significant among middle-aged men (a 19% increase) and women (a 15% increase) living with others only. Between 1997–1999 and 2015–2018, reports of serious psychological distress increased significantly among middle-aged men and women living alone or with spouse/cohabiting partners only, and among middle-aged men living with others only. Changes in serious psychological distress in midlife was most pronounced among middle-aged men living with spouses/cohabiting partners only and among middle-aged women living with others only (Table 2).
Changes in health among older adults are presented in Panels 3 and 4 of Table 2. Except for older adult men living with others only, the share of older adult men and women reporting fair or poor health declined over the study period, suggesting improved health in later life. The decline in fair or poor self-rated health in later life was most pronounced among adults living with their spouses/cohabiting partners only. Serious psychological distress also declined (nonsignificantly) among older adults co-residing with spouses/cohabiting partners only, and among older adult men living alone. There were increased reports of serious psychological distress among older adult men and women co-residing with their spouses/cohabiting partners and other persons, and among older adult women living with others only. Activity limitations increased among older adults living alone (Table 2).
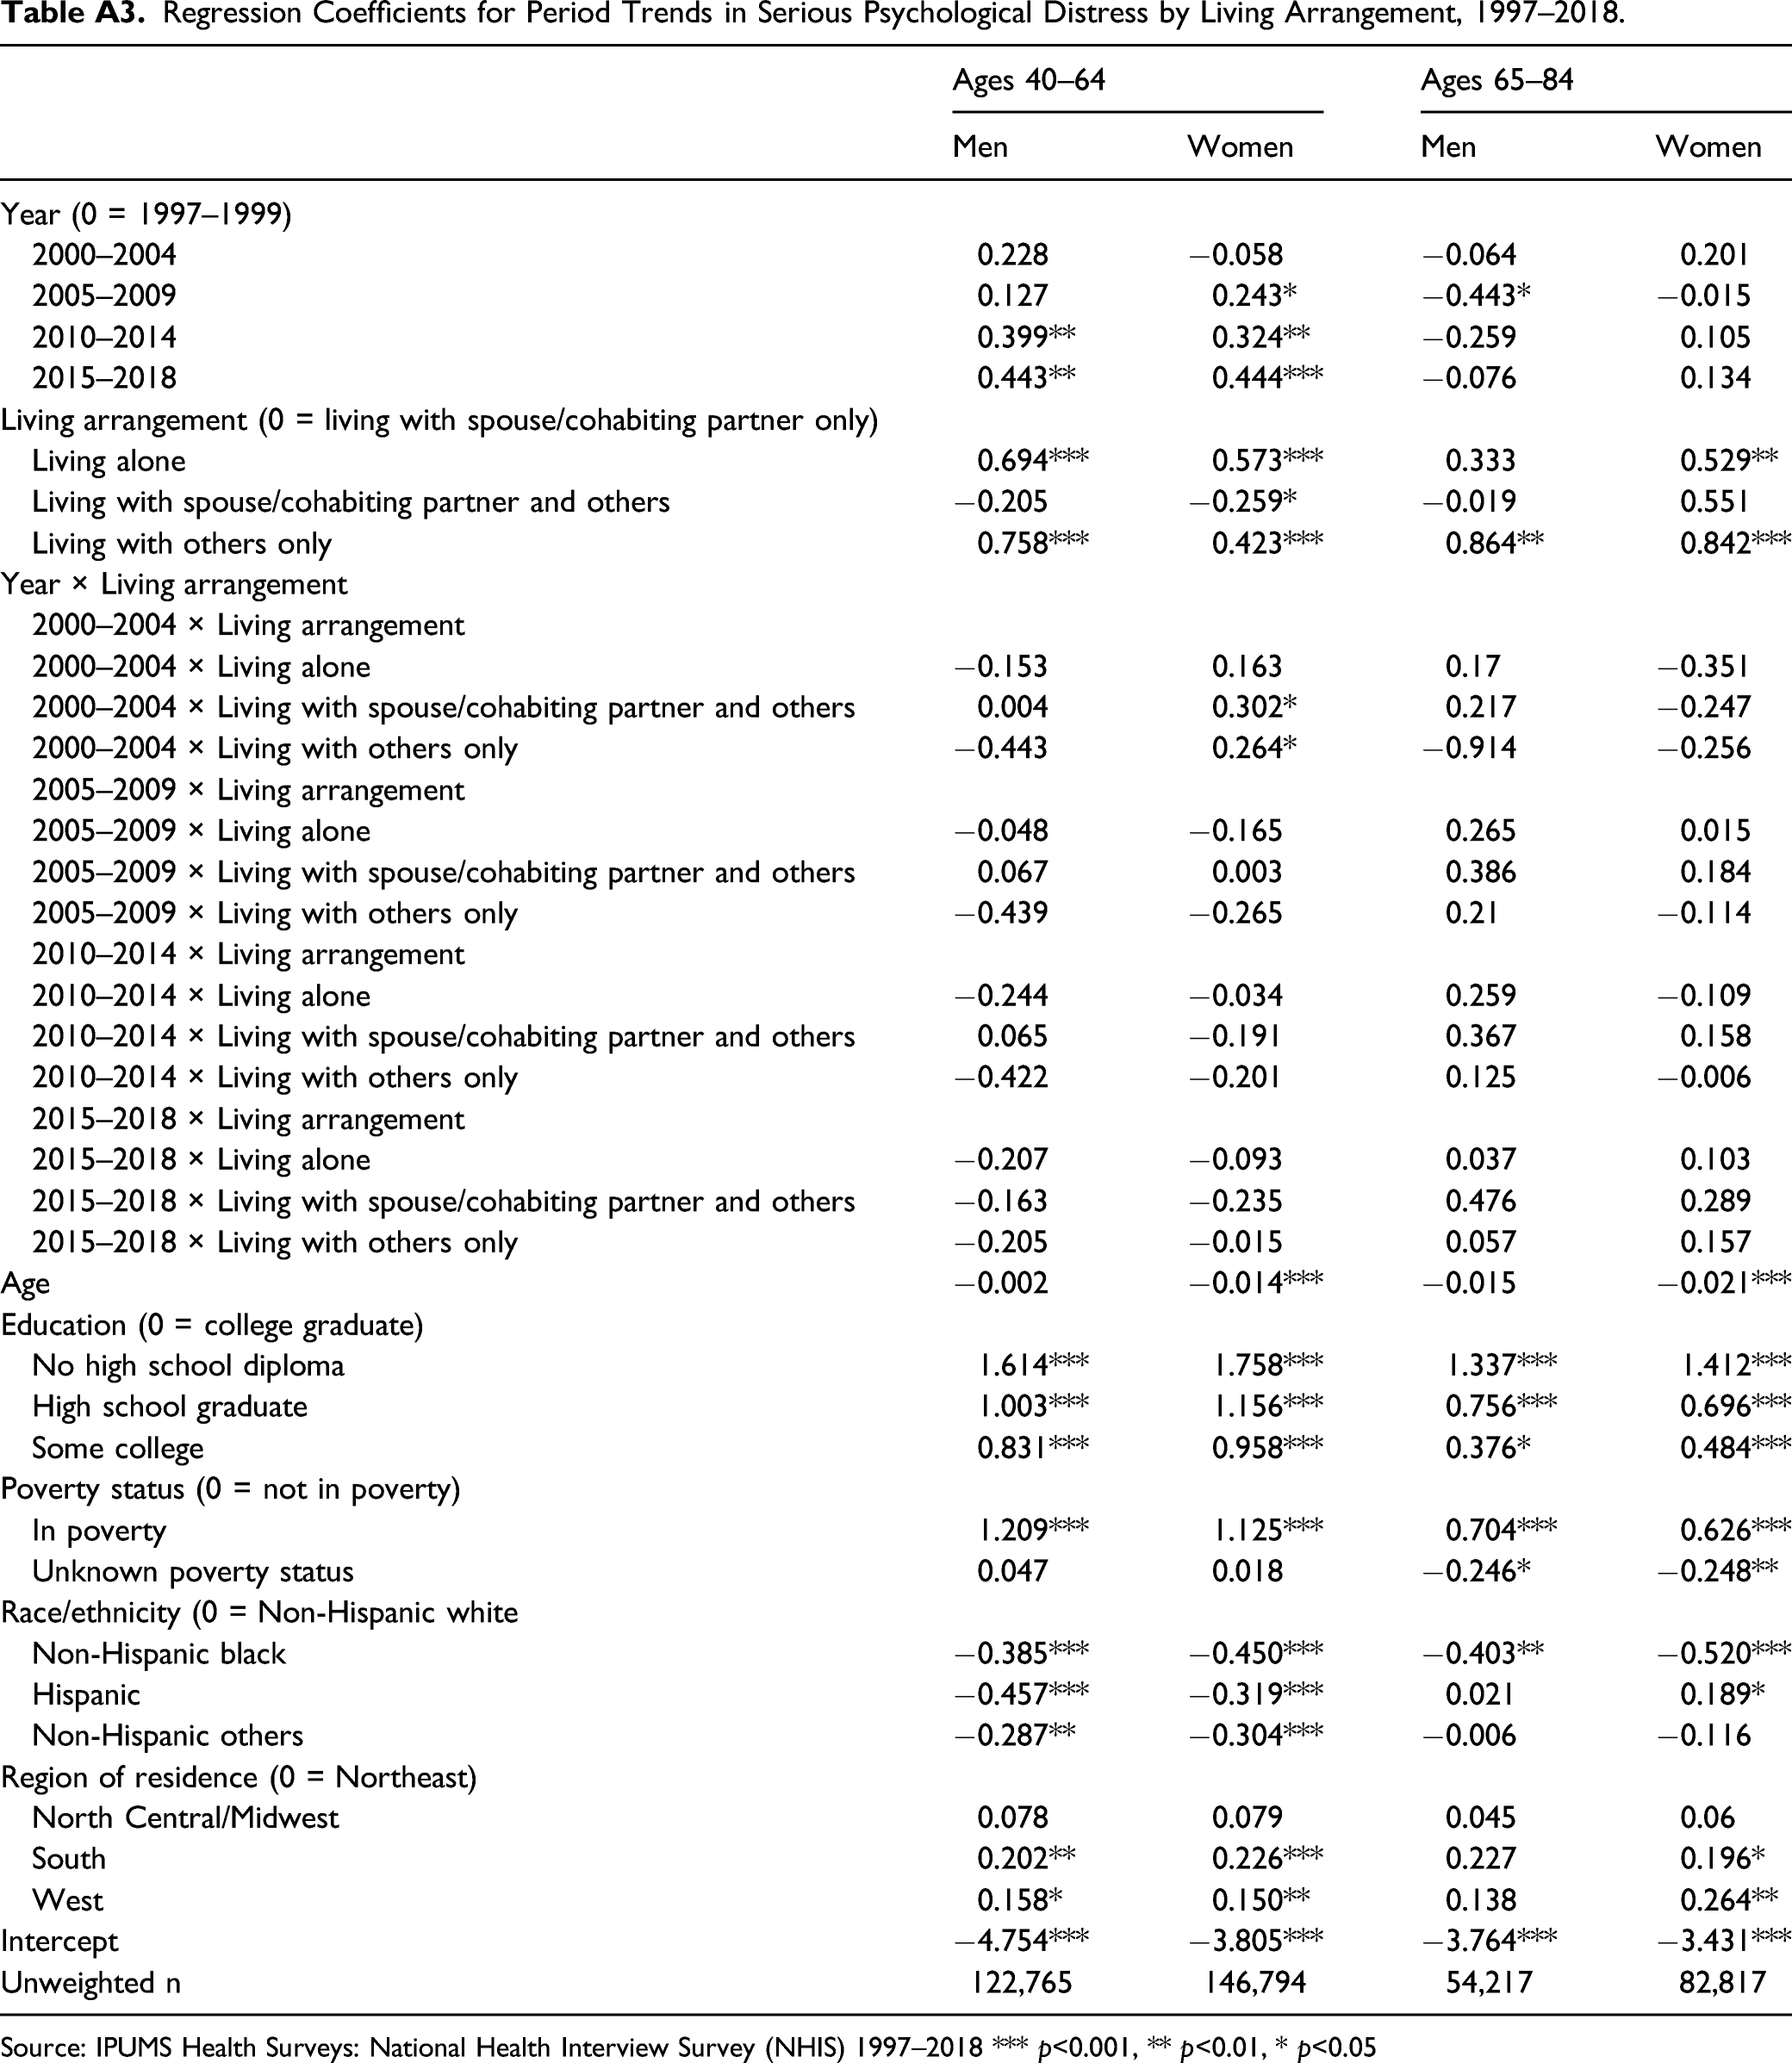
Tables A1, A2, and A3 in Appendix A present coefficients from logistic regression models predicting the odds of reporting fair or poor health, ADL limitations, and serious psychological distress, respectively. Interpretations of the main effects of year and the interaction terms depend on the reference categories for both measures. Significant interaction terms indicate that changes in reports on a health outcome over the study period were significantly different across living arrangements. For ease of interpretation, we generated predicted probabilities of reporting fair or poor health, ADL limitations, and serious psychological distress based on the regression coefficients in Tables A1, A2, and A3, respectively (Appendix A).
Figure 1 presents changes in predicted probabilities of fair or poor self-rated health in midlife by living arrangement. Irrespective of their living arrangements, middle-aged adults showed significant
1
increases in the probability of fair or poor self-rated health over the study period. Among men, the increased report of fair or poor health was most pronounced among middle-aged men living with others only. Middle-aged women living alone had the greatest increase (23%) in the probability of fair or poor health between 1997–1999 and 2015–2018. Adjusted predicted probabilities of fair/poor health, adults aged 40–64.
We present the predicted probabilities showing self-rated health trends across living arrangements in later life in Figure 2. Based on the results, co-residence with just one’s spouse/cohabiting partner is increasingly associated with better self-rated health in later life. Older adult men and women living with just their spouses/cohabiting partners reported 8% and 17% decline, respectively, in the probability of fair or poor self-rated health. The probability of fair or poor health also declined slightly among older adult women living alone. Conversely, older adults who lived with persons other than their spouses/cohabiting partners (i.e., living with others only), had nonsignificant increased probability of fair or poor health over time. The increased probability of fair or poor health among older adults living with others only was particularly notable among men, a 20% increase (Figure 2). Adjusted predicted probabilities of fair/poor health, adults aged 65–84.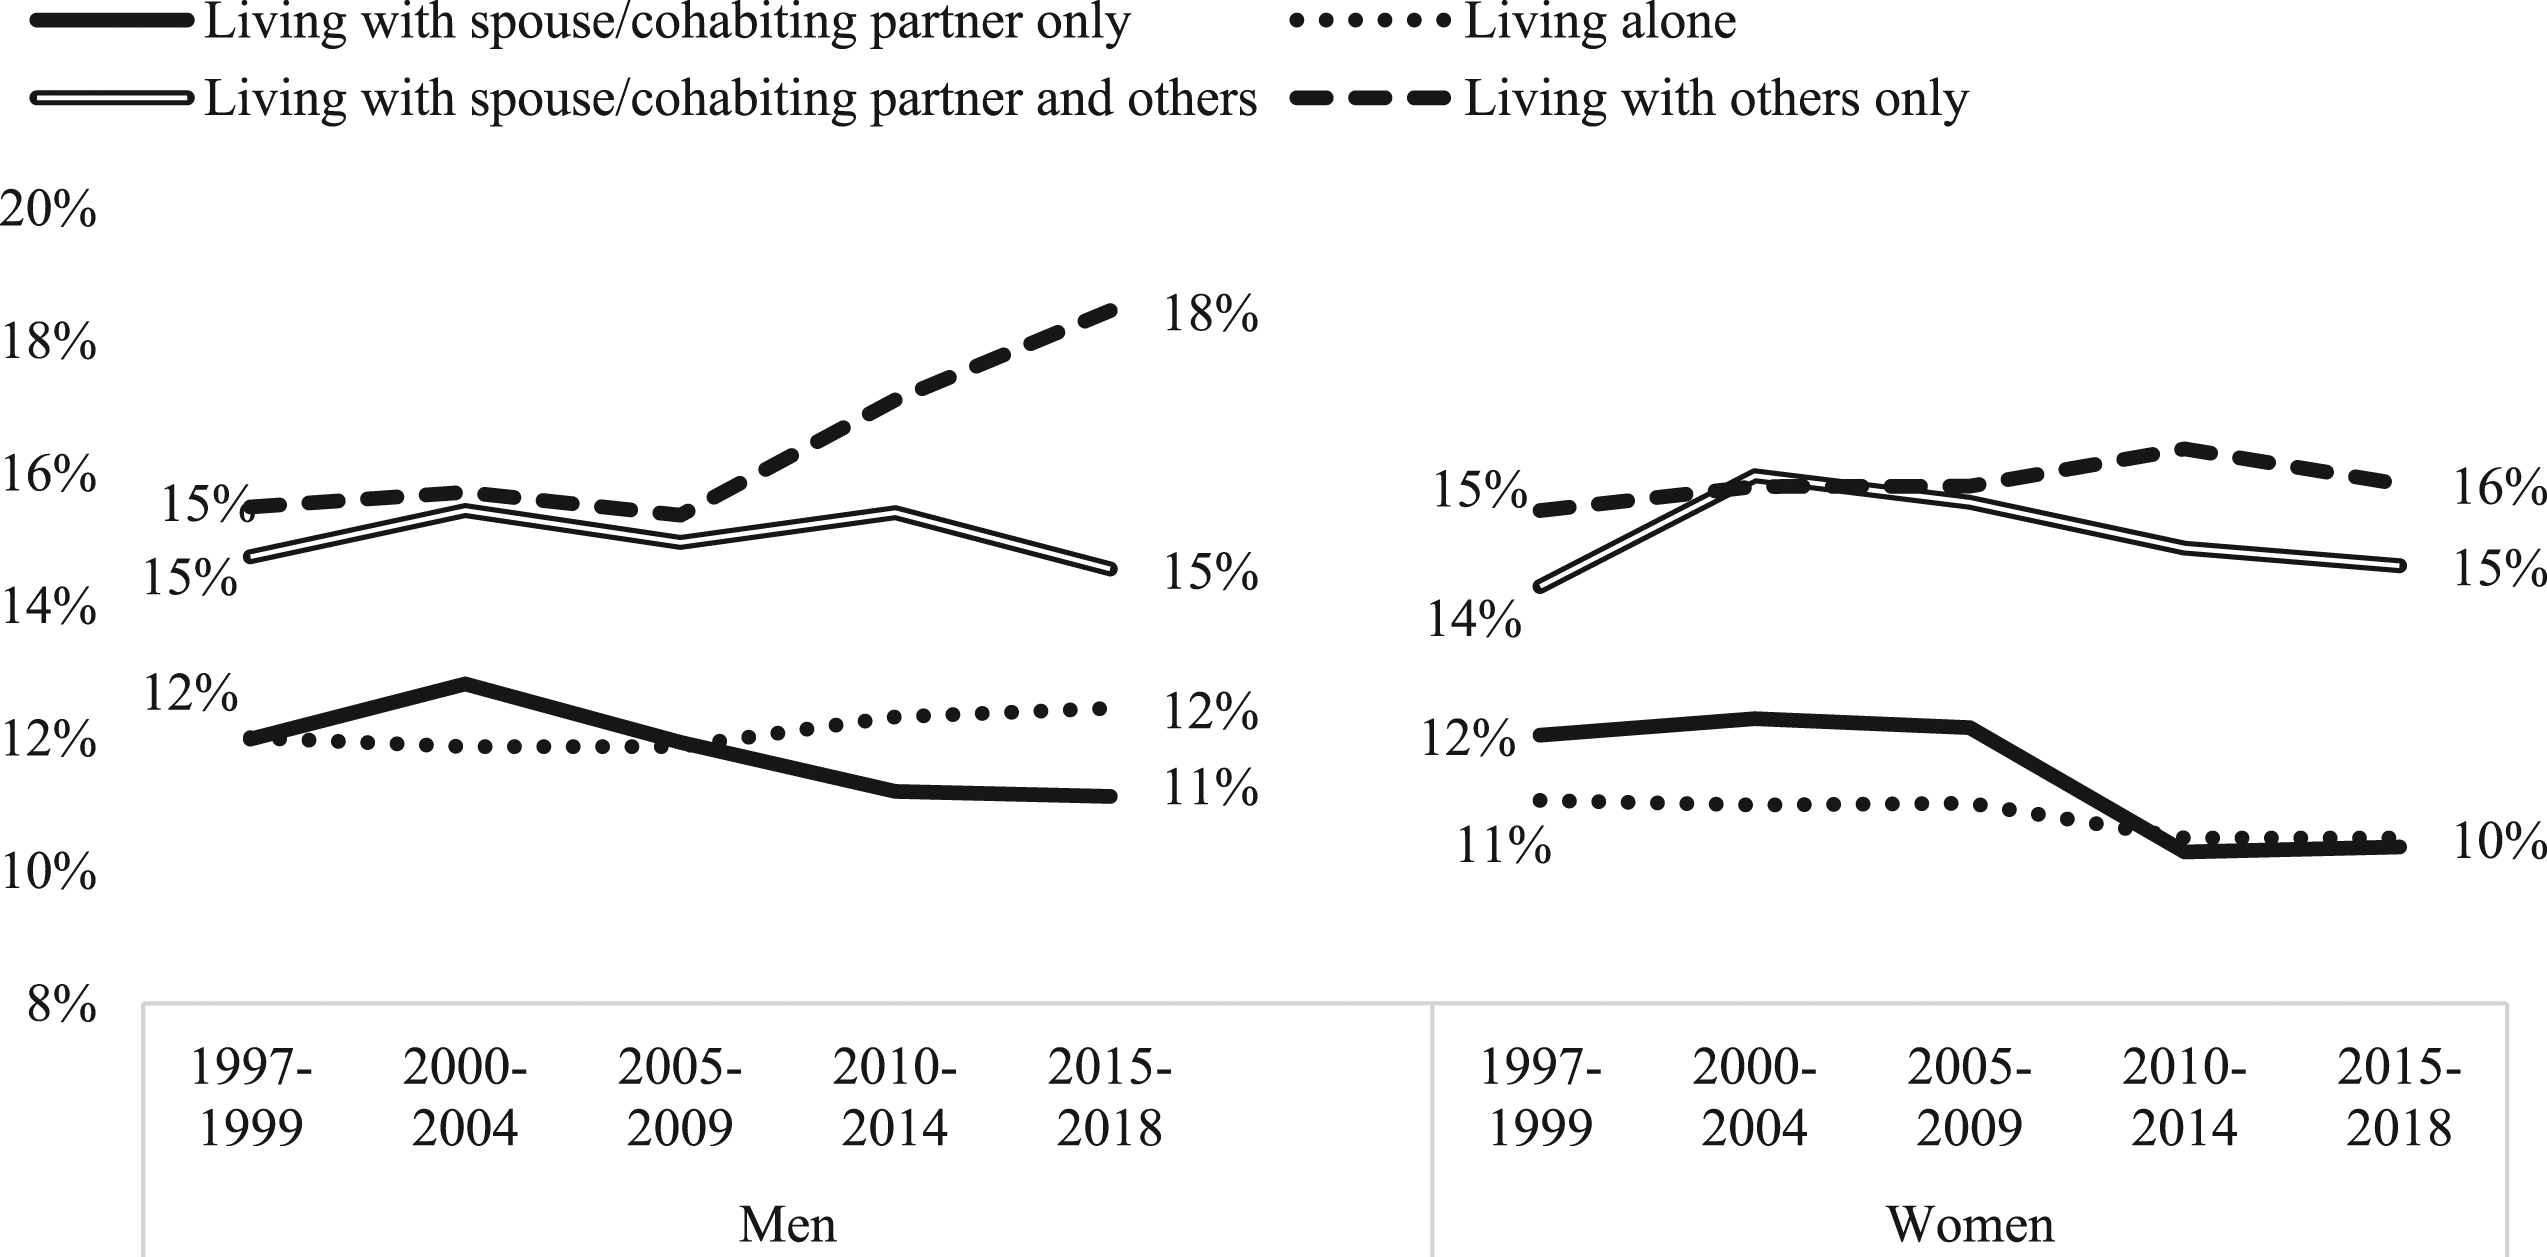
Trends in activity limitations among middle-aged adults (Figure 3), mirror the trends in self-rated health reported above. The probability of reporting limitations with activities of daily living increased significantly across living arrangements, but the increases were greater among middle-aged men and women who lived alone (Figure 3). Trends in activity limitations for older adults are shown in Figure 4. Based on the results, the probability of reporting need for help with ADLs remained mostly stable across all categories of living arrangements except solo living. Older adult women who lived alone had significant increases in the probability of reporting activity limitations over time (Figure 4). Adjusted predicted probabilities of activities of daily living limitations, adults aged 40–64. Adjusted predicted probabilities of activities of daily living limitations, adults aged 65–84.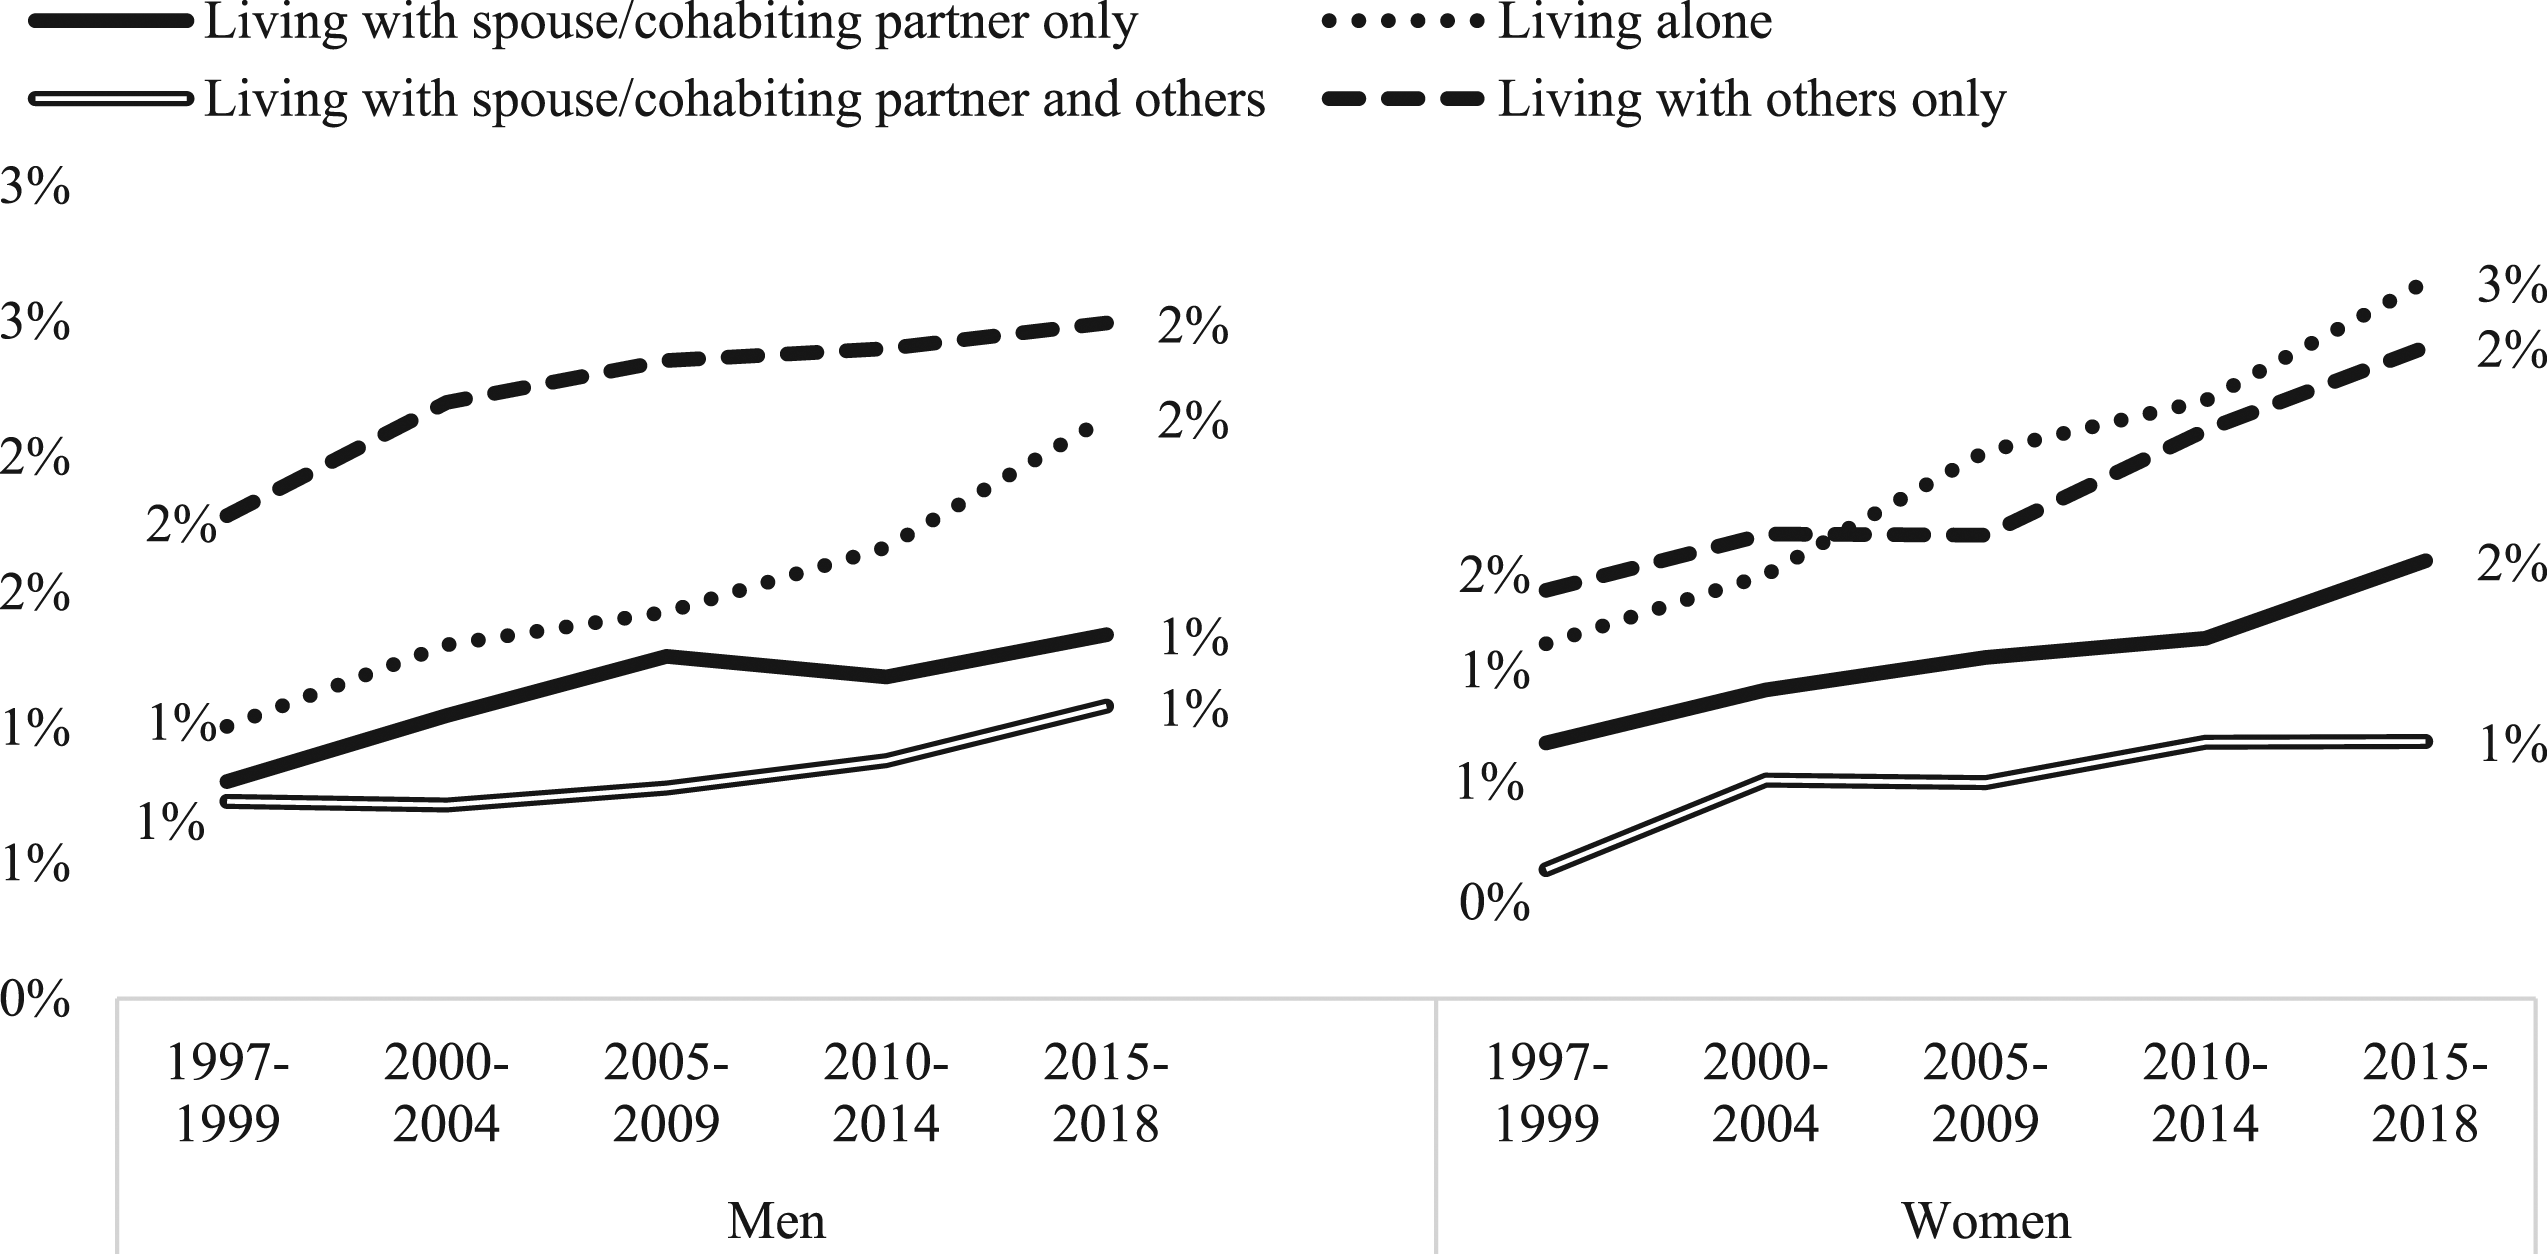
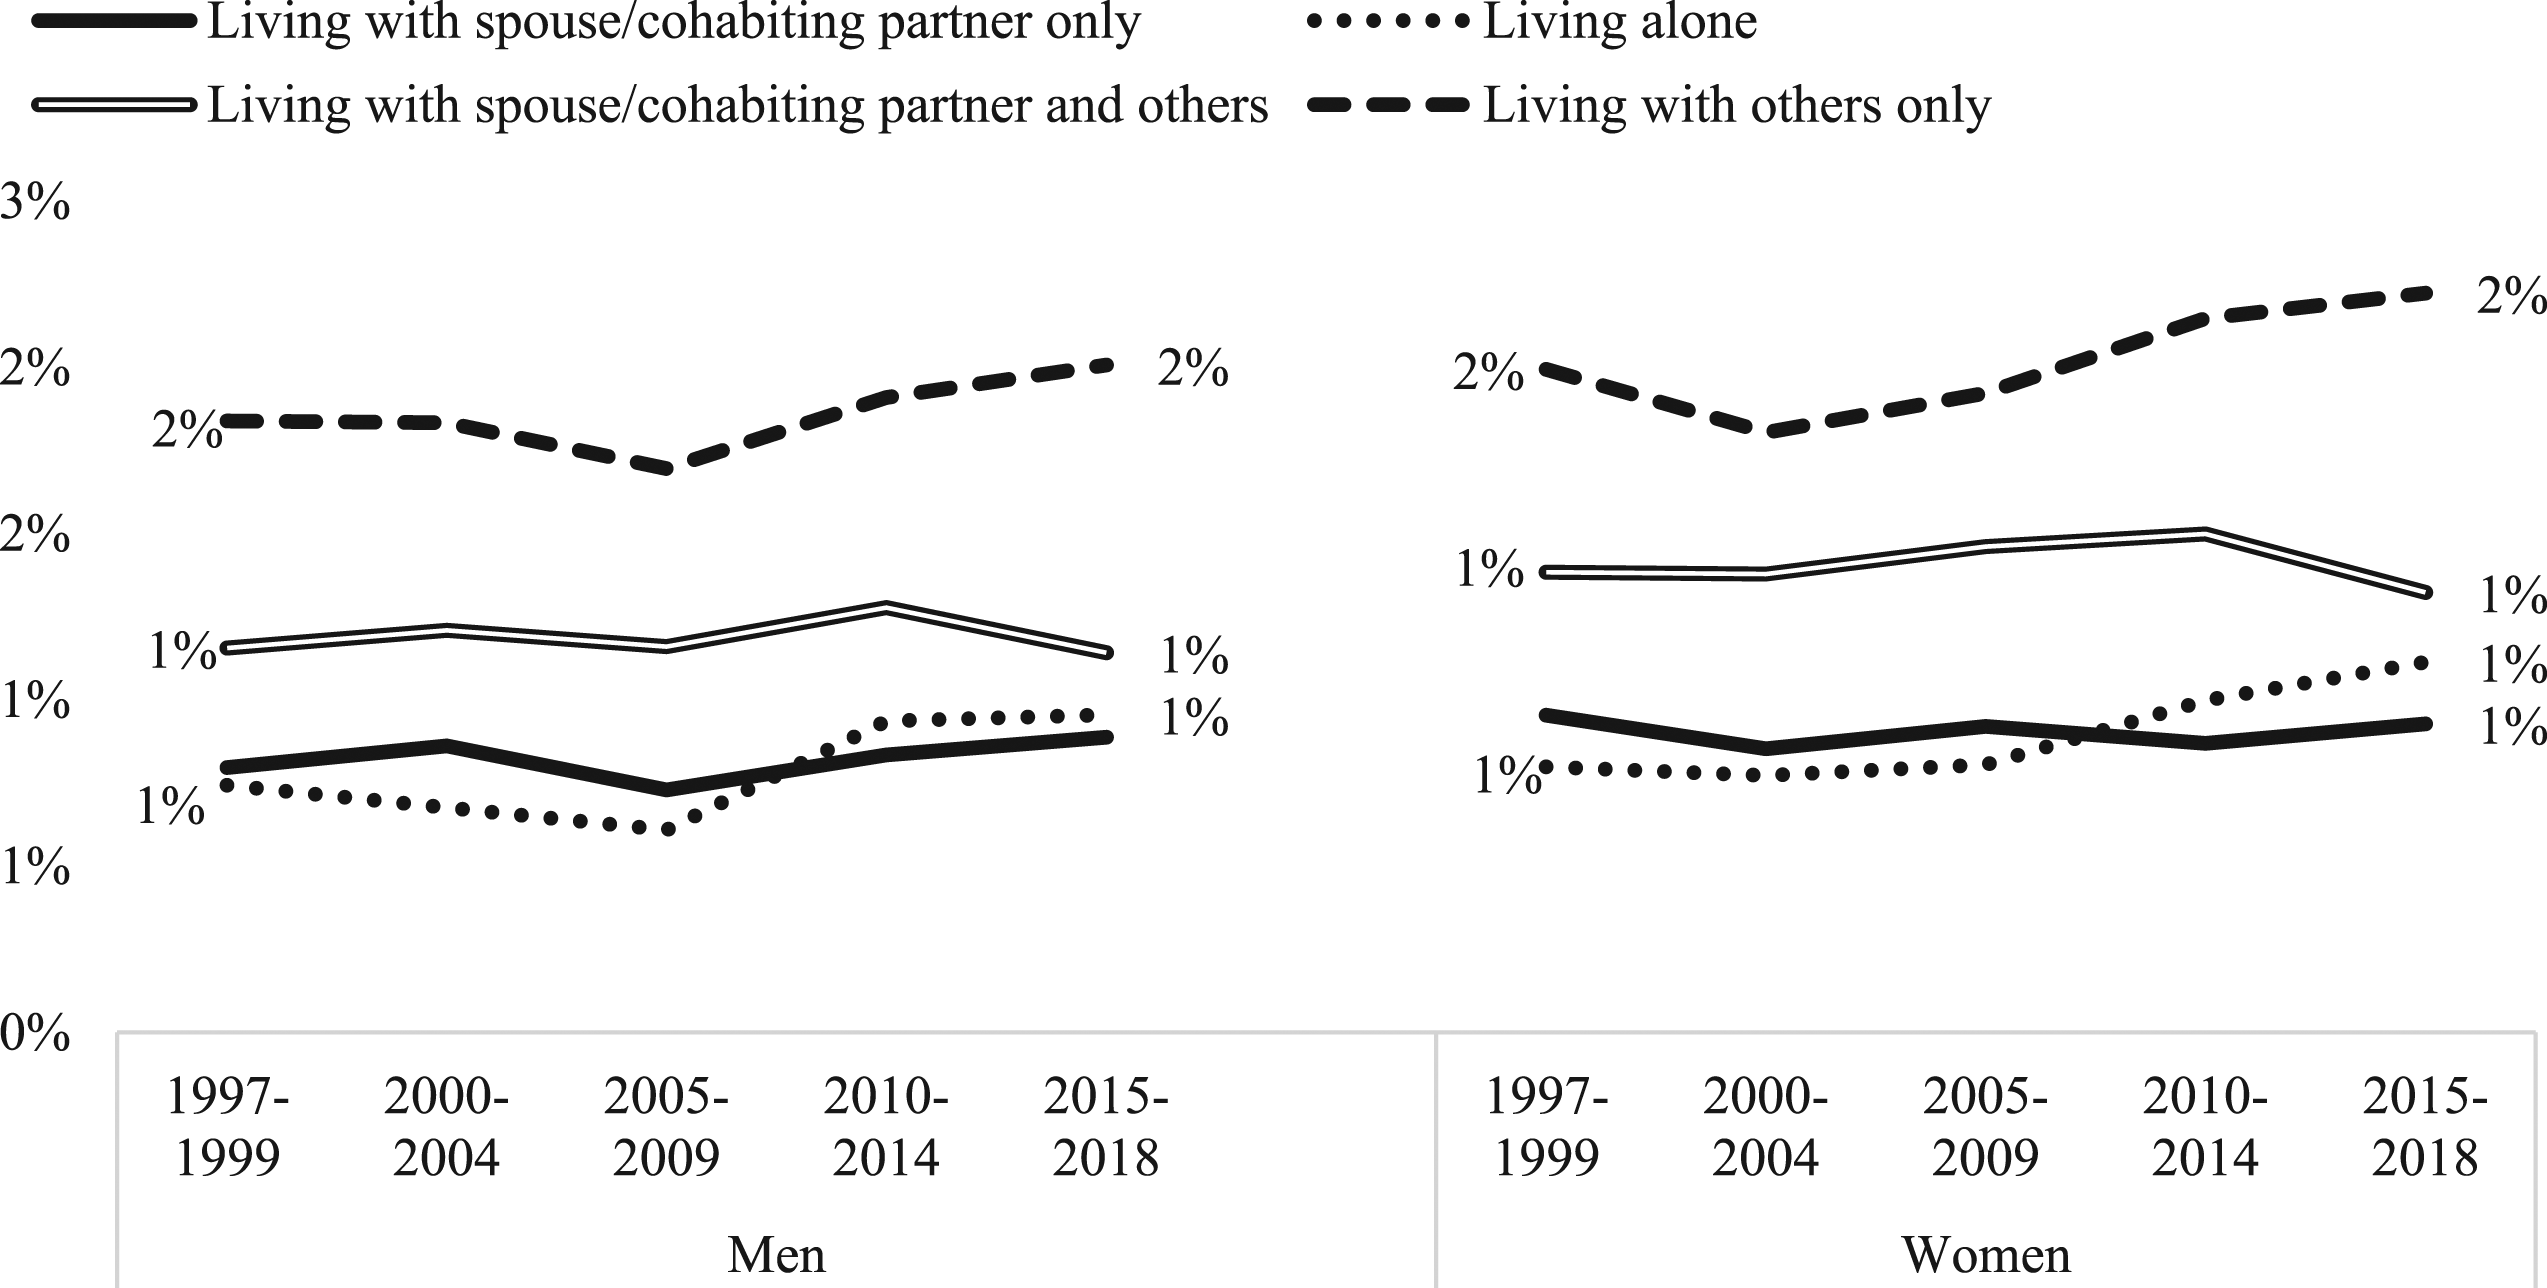
Figure 5 presents trends in the adjusted predicted probabilities of reporting serious psychological distress in midlife. The results showed that except for middle-aged men living with their spouses/cohabiting partners and other persons, middle-aged men and women in various living arrangements had increased likelihood of reporting serious psychological distress over time. For women, the increased reports of serious psychological distress in midlife were statistically significant across living arrangements; only middle-aged men co-residing with spouses/cohabiting partners only showed significant increased probability of serious psychological distress over time (Figure 5). Adjusted predicted probabilities of serious psychological distress, adults aged 40–64.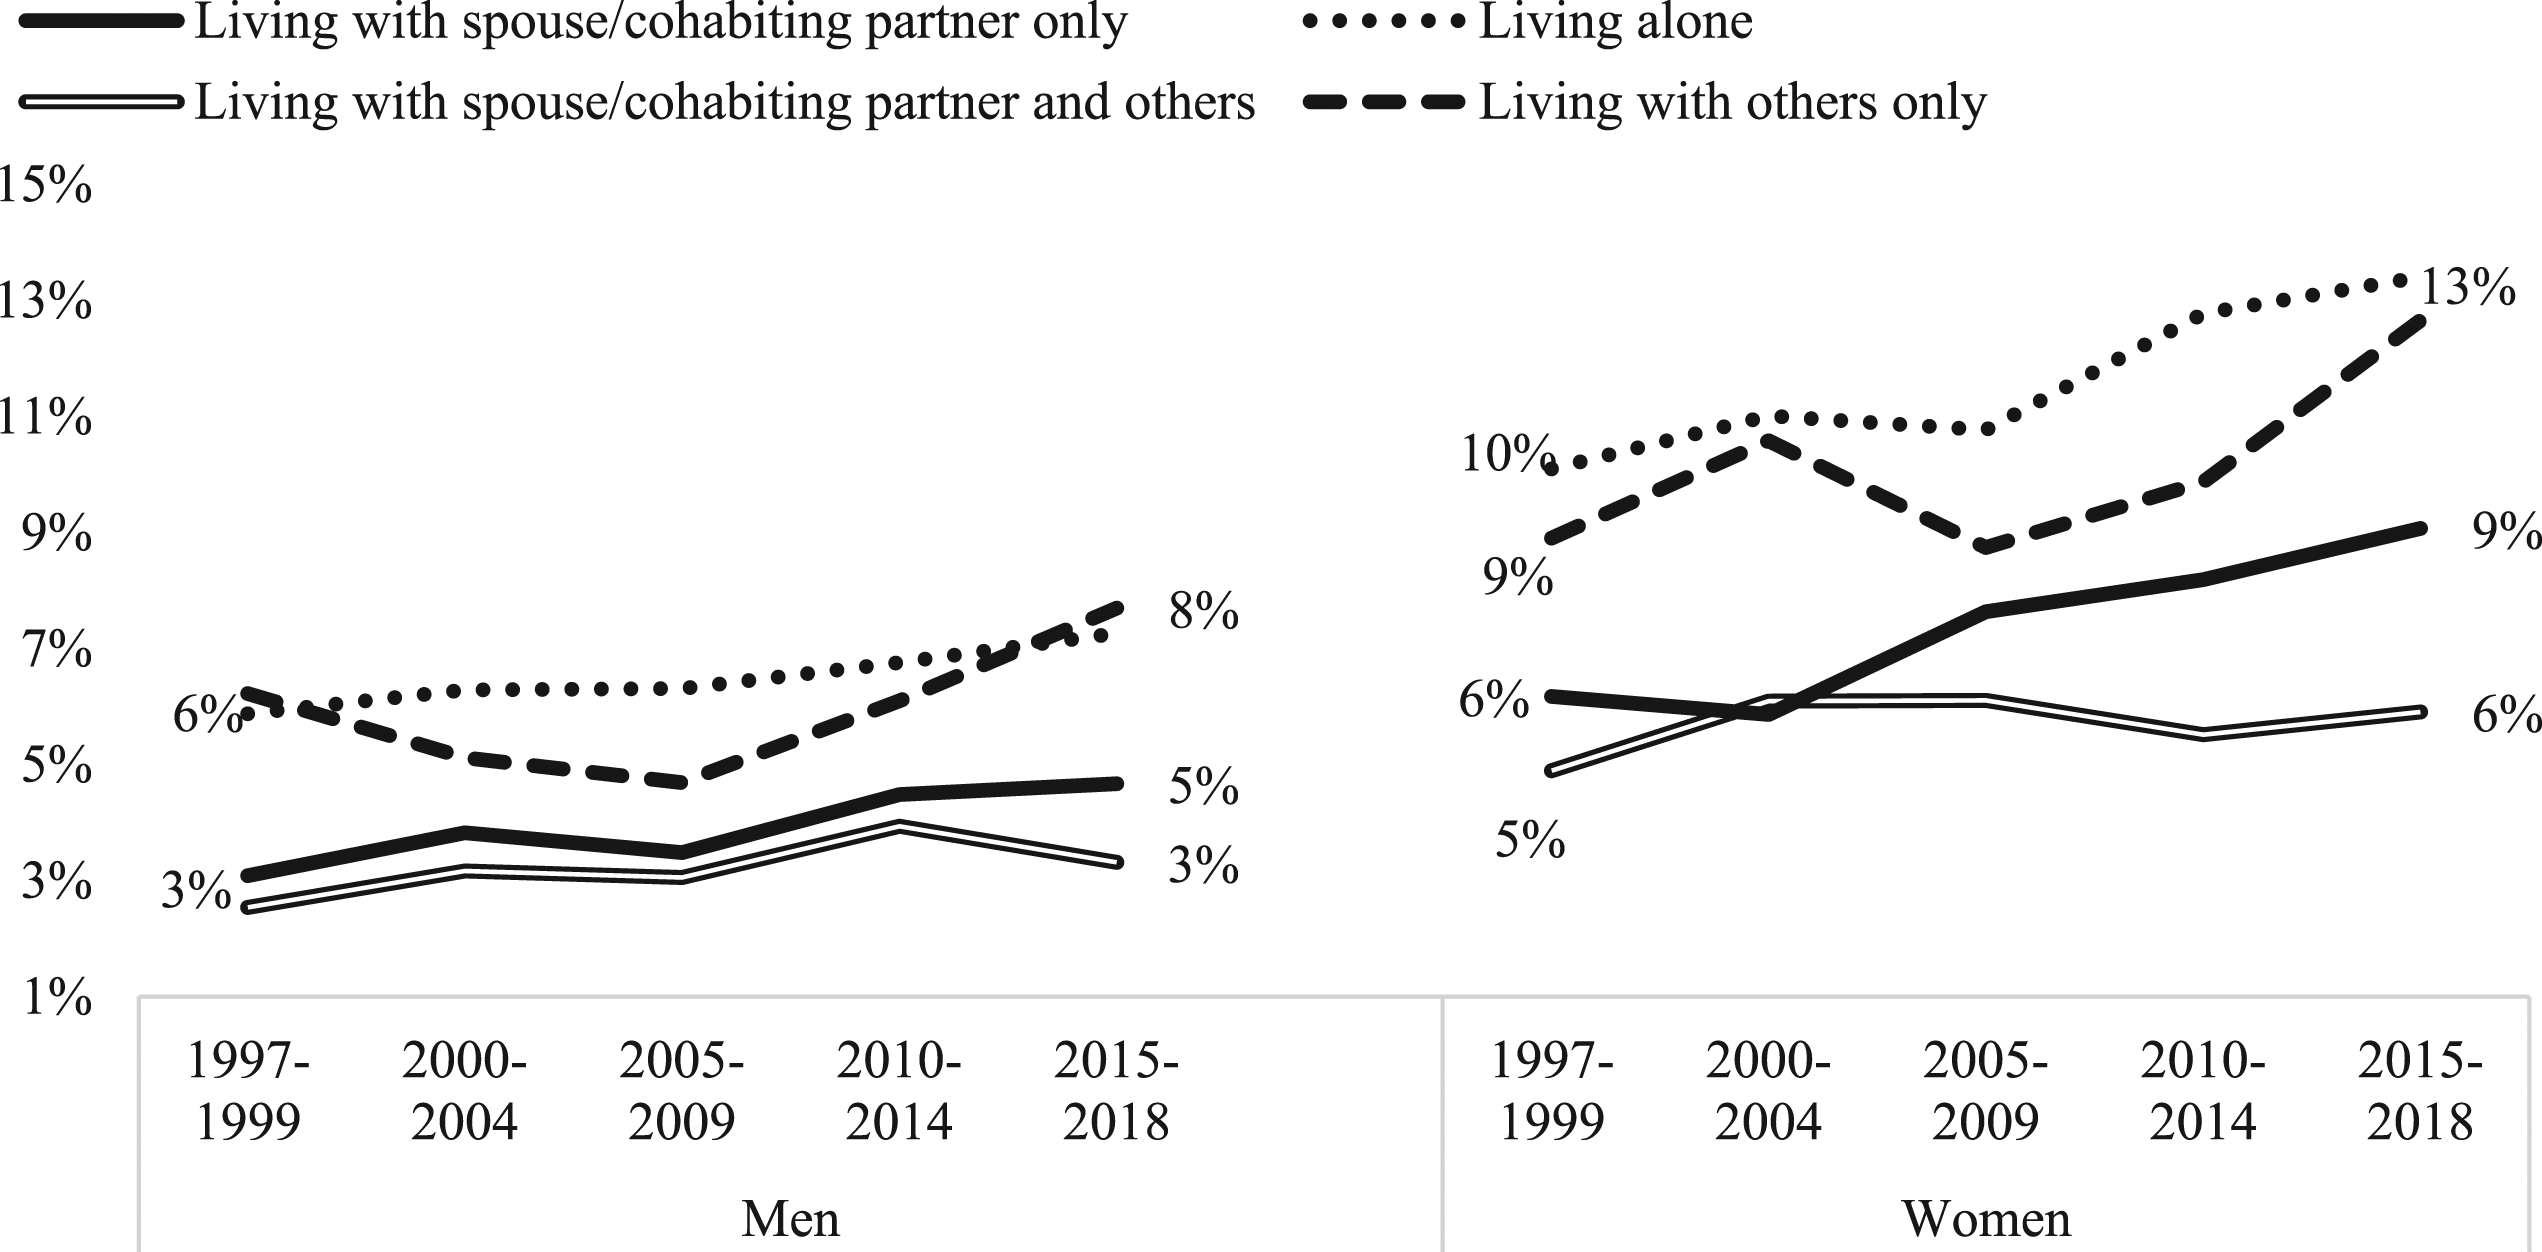
Trends in reports of psychological distress in later life are presented in Figure 6. Between 1997–1999 and 2015–2018, older adult men who lived with just their spouses/cohabiting partners and those living with others only had stable reports of serious psychological distress. The probability of reporting serious psychological distress declined among older adult men living solo but those living with spouses/cohabiting partners and other persons saw a 50% increase in the probability of serious psychological distress. Older adult women in all living situations had nonsignificant increased reports of serious psychological distress over the study period (Figure 6). The increased probability of serious psychological distress is more pronounced among older adult women who lived with other people, with or without their spouses/cohabiting partners. Adjusted predicted probabilities of serious psychological distress, adults aged 65–84.
Discussion
Social and economic changes of the past few decades have altered family experiences and living arrangements of adults in the U.S. There have also been shifts in the sociodemographic composition of adults in various living arrangements. Given growing research showing significant relationships between living arrangements and health (Henning-Smith & Gonzales, 2020; Weissman & Russell, 2018), this study examines health implications of changing living arrangements in midlife and in later years. In line with the marriage decline and the increased divorce in midlife, dwindling shares of middle-aged adults live with their spouses/cohabiting partners only. Conversely, living alone increased over time, particularly among middle-aged men. Rise in shared living in midlife appear limited to unpartnered adults. The share of middle-aged adults living with other persons only increased over time, but the share of middle-aged adults living with spouse/cohabiting partners and other people either declined or remained stable over time. This observed shift may be due to disadvantaged unpartnered middle-aged adults taking care of their children and/or aging parents, or doubling up.
Changes in living arrangements in later life differ by gender. Rise in solo living among older adult men continued two decades into the 21st century, but the share of older adult women living alone declined in recent decades. Also, perhaps reflecting the narrowing gender gap in life expectancy among older adults (Sundberg et al., 2018), an increasing share of older adult women live with their spouses/cohabiting partners. In spite of these changes, solo living remained more common and co-residence with spouse/cohabiting partner remained less common among older adult women than among men. Partnered older adults are increasingly sharing their homes with other persons.
We add to existing literature on health declines in midlife by showing worsening self-assessed physical and mental health across living arrangements over the past two decades (Case & Deaton, 2015). We, however, showed greater health declines among middle-aged adults living solo or with other persons only (no spouse/cohabiting partner). This is in line with research showing more pronounced self-rated health decline among unpartnered adults in recent years (see Lamidi, 2021).
The two living arrangements preferred by American adults (living alone and living with spouse/cohabiting partner only) are increasingly associated with better self-rated health and declining reports of limitations with activities of daily living among older Americans. Self-rated health and functional limitations have either improved or remained stable across the two living arrangements. Conversely, older adults living with others only, particularly older adult men, reported self-rated health declines over the study period. Co-residence with other persons is also associated with worsening psychological wellbeing among older adults, particularly women. Older adult women living with other persons, with or without their spouses/cohabiting partners, had heightened probability of psychological distress over the study period. On the other hand, older adults living with spouse/cohabiting partner only had stably low reports of serious psychological distress over time.
Limitations with activities of daily living in later life have changed little over time. Net of controls for sociodemographic changes, only living alone was significantly associated with worsening limitations with activities of daily living, and only among older adult women. Even so, changes in predicted probability of ADL limitations among older adults living alone were modest at best.
This study fills an important gap in the literature on living arrangements and health among middle-aged and older Americans. While the focus on multiple health outcomes gives a more comprehensive overview of health of middle-aged and older adults over time, capturing the different dimensions of health across the life course can be challenging, particularly considering differences by age group in the experiences and reports of symptoms (Malkin et al., 2019). Future research should explore trends in wider range of health outcomes, analyzing multiple indicators of physical health, mental wellbeing, physical functioning. It is also important to examine racial/ethnic and educational differences in trends in living arrangements and health.
National Health Interview Survey samples only noninstitutionalized populations. Given the research showing declining share of older adults in nursing homes (Feng et al., 2011), any potential bias from the exclusion of institutionalized adults is likely minimal as institutionalized persons represent a relatively small share (<5%) of older adult populations (Feng et al., 2011). Also, since institutionalization is more prevalent among the “oldest-old” adults (aged 85+) (Harris-Kojetin et al., 2019), excluding them from the analysis helps to minimize any potential bias from focusing on noninstitutionalized population. It is, however, unclear how the self-rated trends in this age group compare to the trends in younger ages. Future studies should explore self-rated health trends among adults aged 85 and older.
Due to data limitations, we were unable to adequately explore mechanisms underlying the trends presented in this study. Our multivariate analyses accounted for changing sociodemographic characteristics such as age, education, poverty status, and race/ethnicity. However, future studies need to explore changing patterns of interactions, access to resources (including social support and social capital), and demands associated with different living arrangements. Future research should use qualitative and mixed methods approach to examine reasons for the trends observed and to better narrate the health status of middle aged and older adults. Additionally, researchers should consider longitudinal data analytic techniques to disentangle the causal link between changing living arrangements and health. Changes in living arrangements and health of American adults may be influenced by factors (e.g., cultural shifts and economic changes) unaccounted for in this study. Adults in each living arrangement are a heterogenous group, and economic and sociocultural factors influencing preferences for various living arrangements may also be related to health (Lai, 2005).
Conclusion
Worsening health in midlife cuts across living arrangements, but rates of decline were higher in some living arrangements, specifically living alone and living with other persons only. While the preferred living arrangements for most U.S. adults are living alone or with a spouse/cohabiting partner only, increasing share of middle-aged and older adults are living with other people, with or without their spouses/cohabiting partners, and this arrangement is increasingly associated with poor health. These findings call for targeted policies and programs to address the needs of middle-aged and older adults in diverse living arrangements. Specifically, “aging in place” policies should consider the growing health deficits associated with co-residence with other people in later life, particularly among women. Providing flexible and affordable housing options, personal care services, and other supports will assist a broad range of community-dwelling adults.
Footnotes
Declaration of Conflicting Interests
The author(s) declared no potential conflicts of interest with respect to the research, authorship, and/or publication of this article.
Funding
The author(s) received no financial support for the research, authorship, and/or publication of this article.

Note
Appendix A
Regression Coefficients for Period Trends in Serious Psychological Distress by Living Arrangement, 1997–2018.
| Ages 40–64 | Ages 65–84 | |||
|---|---|---|---|---|
| Men | Women | Men | Women | |
| Year (0 = 1997–1999) | ||||
| 2000–2004 | 0.228 | −0.058 | −0.064 | 0.201 |
| 2005–2009 | 0.127 | 0.243* | −0.443* | −0.015 |
| 2010–2014 | 0.399** | 0.324** | −0.259 | 0.105 |
| 2015–2018 | 0.443** | 0.444*** | −0.076 | 0.134 |
| Living arrangement (0 = living with spouse/cohabiting partner only) | ||||
| Living alone | 0.694*** | 0.573*** | 0.333 | 0.529** |
| Living with spouse/cohabiting partner and others | −0.205 | −0.259* | −0.019 | 0.551 |
| Living with others only | 0.758*** | 0.423*** | 0.864** | 0.842*** |
| Year × Living arrangement | ||||
| 2000–2004 × Living arrangement | ||||
| 2000–2004 × Living alone | −0.153 | 0.163 | 0.17 | −0.351 |
| 2000–2004 × Living with spouse/cohabiting partner and others | 0.004 | 0.302* | 0.217 | −0.247 |
| 2000–2004 × Living with others only | −0.443 | 0.264* | −0.914 | −0.256 |
| 2005–2009 × Living arrangement | ||||
| 2005–2009 × Living alone | −0.048 | −0.165 | 0.265 | 0.015 |
| 2005–2009 × Living with spouse/cohabiting partner and others | 0.067 | 0.003 | 0.386 | 0.184 |
| 2005–2009 × Living with others only | −0.439 | −0.265 | 0.21 | −0.114 |
| 2010–2014 × Living arrangement | ||||
| 2010–2014 × Living alone | −0.244 | −0.034 | 0.259 | −0.109 |
| 2010–2014 × Living with spouse/cohabiting partner and others | 0.065 | −0.191 | 0.367 | 0.158 |
| 2010–2014 × Living with others only | −0.422 | −0.201 | 0.125 | −0.006 |
| 2015–2018 × Living arrangement | ||||
| 2015–2018 × Living alone | −0.207 | −0.093 | 0.037 | 0.103 |
| 2015–2018 × Living with spouse/cohabiting partner and others | −0.163 | −0.235 | 0.476 | 0.289 |
| 2015–2018 × Living with others only | −0.205 | −0.015 | 0.057 | 0.157 |
| Age | −0.002 | −0.014*** | −0.015 | −0.021*** |
| Education (0 = college graduate) | ||||
| No high school diploma | 1.614*** | 1.758*** | 1.337*** | 1.412*** |
| High school graduate | 1.003*** | 1.156*** | 0.756*** | 0.696*** |
| Some college | 0.831*** | 0.958*** | 0.376* | 0.484*** |
| Poverty status (0 = not in poverty) | ||||
| In poverty | 1.209*** | 1.125*** | 0.704*** | 0.626*** |
| Unknown poverty status | 0.047 | 0.018 | −0.246* | −0.248** |
| Race/ethnicity (0 = Non-Hispanic white | ||||
| Non-Hispanic black | −0.385*** | −0.450*** | −0.403** | −0.520*** |
| Hispanic | −0.457*** | −0.319*** | 0.021 | 0.189* |
| Non-Hispanic others | −0.287** | −0.304*** | −0.006 | −0.116 |
| Region of residence (0 = Northeast) | ||||
| North Central/Midwest | 0.078 | 0.079 | 0.045 | 0.06 |
| South | 0.202** | 0.226*** | 0.227 | 0.196* |
| West | 0.158* | 0.150** | 0.138 | 0.264** |
| Intercept | −4.754*** | −3.805*** | −3.764*** | −3.431*** |
| Unweighted n | 122,765 | 146,794 | 54,217 | 82,817 |
Source: IPUMS Health Surveys: National Health Interview Survey (NHIS) 1997–2018 *** p<0.001, ** p<0.01, * p<0.05