
Abstract
This study examined whether certified nurse aide (CNA) retention was positively related to nursing home (NH) resident care experiences at the organizational-level. The 2017 Ohio Biennial Survey of Long-Term Care Facilities and the 2017 Ohio Nursing Home Resident Satisfaction Survey provided the key variables. Quartiles of CNA retention (0–48%, 49–60%, 61–72%, 73–100%) were created from the analysis sample (N = 667). Regression analyses clustered NHs within counties and controlled for structural characteristics, financial resources, empowered managers, resilience, quality of work-life, resident, and community characteristics. NHs in Quartile 3 of CNA retention had higher environment scores by 1.36 percentage points compared to Quartile 1 (p < .05). NHs in Quartile 4 had lower facility culture scores by 1.31 percentage points than NHs in Quartiles 1–3 (p < .05); this pattern repeated when Quartiles 3 and 4 were compared on other outcomes. Future research should explore NHs with very high CNA retention to improve understanding of the measure.
• The study tested whether a positive relationship exists between CNA retention and resident care experiences at the facility-level, finding weak and inconsistent support for the hypothesis. • This is the first study to use the 2017 Ohio Nursing Home Resident Satisfaction Survey data as a measure of quality. • The analysis used several organizational control variables that had not been included in prior research on CNA retention. • This study revealed that other exogenous factors are related to better resident care experiences including greater social worker and registered nurse staffing, culture change adoption, and dementia case-mix.
• The current study demonstrated that the relationship between retention and quality is complex and that much more information about workers is required to understand what retention means in practice. • The conceptual framework used in this study should be further developed and tested to understand the interrelationships between exogenous factors, retention, and resident care experiences. • Future studies should use individual-level data to examine how CNA retention within a unit-month affects resident care experiences, well-being, and health outcomes, namely, in dementia special care units.What this paper adds
Applications of study findings
Introduction
The COVID-19 pandemic exposed the staffing challenges in U.S. nursing homes (NHs) to the public. In particular, the worsening shortage of staff, namely, certified nursing assistants (CNAs) directly affects the provision of efficient, person-centered, safe care (AHCA & NCAL, 2021; Denny-Brown et al., 2020). Access to care diminishes and risk of burnout increases when retention is low, seen in 58% of NHs limiting admissions since June 2021 and in 99% asking current workers for overtime/extra shifts (AHCA & NCAL, 2021). In practice, a low retention rate signifies a nursing home was unable to retain most of its starting CNAs over a year (Huang & Bowblis, 2020). While the concepts of retention and turnover communicate how stable a workforce is, retention is an important and understudied measure of the consistency of the team rather than focusing on those who left.
Low retention persists for many and multiple reasons: low wages, inadequate benefits, social stigma, heavy workloads, job dissatisfaction, lack of career advancement and empowerment, administrator and director of nursing turnover, lack of good basic supervision, being the primary breadwinner, and is associated with for-profit status and chain affiliation (Bishop et al., 2008; Booi et al., 2021; Dill et al., 2013; Kennedy et al., 2020, 2022). Often CNAs feel invisible, disrespected, and excluded from the health care team (Booi et al., 2021). According to PHI (2021), CNAs in the U.S. are most likely to be women (91%) of color (58%) with a high school education or less (51%). Over one-in-five are immigrants (21%), 31% have children under 18, and 34% use any public assistance like Medicaid for healthcare. The national median personal earnings were $24,200 (PHI, 2021).
In 2004, retention of CNAs was 64.5% nationally (Donoghue, 2010). Yet, during 2016, the national retention rate declined to 53.2%; while most CNAs remained in their jobs, about 47% left their jobs that year (Castle et al., 2020). This level of departure places a heavy burden on NHs to recruit, train, and onboard new CNAs, as well as on retained CNAs to manage an increased workload during the waiting period (Bryant, 2017).
Higher retention of CNAs can positively affect quality because there are fewer vacancies (which allows more time to care), enhanced familiarity with residents’ preferences, and better care with consistent assignment and a well-trained team (Bowers et al., 2000). In fact, seven studies have demonstrated higher CNA retention correlates with better NH resident outcomes, including social engagement and lower pain, pressure ulcer, and restraint use (Barry et al., 2005; Bishop et al., 2008; Castle, 2021; Castle et al., 2020; Castle & Engberg, 2007, 2008; Kimmey & Stearns, 2015). However, this body of work has defined quality according to NH or surveyor data, such as deficiencies and Minimum Data Set quality measures.
The purpose of this study was to examine how retention of CNAs in NHs is associated with quality using a consumer-derived measure. This study tested whether a positive relationship exists between retention and resident care experiences at the facility-level. This is the first study to use the 2017 Ohio Nursing Home Resident Satisfaction Survey data as a measure of quality for research, which is an important extension of its use online for comparing nursing homes. This study also significantly contributes to the literature by using an annual measure of CNA retention that was created from items in the 2017 Ohio Biennial Survey. In addition, the analysis used several organizational control variables that had not been included in prior research on CNA retention.
Conceptual Framework
In trying to understand whether retention affects resident care experiences, it is helpful to think about the NH factors that affect CNA retention and quality of care (see Figure 1). The Empowerment Pyramid of Person-Centered Care (PCC) is a theory about the necessary elements for CNAs to deliver “the best of what is” that informs this study’s conceptual framing (Caspar et al., 2020, p. 17). Based on an ethnography that included observations and interviews in three Canadian NHs, their model shows empowered leadership is the foundation of PCC, which creates an environment of trust and supportive team members. Responsive leadership behaviors of recognition and respect motivate CNAs to be more responsive to residents, families, and other team members. Despite challenges like inadequate supplies and processing grief, the team has resilience to coordinate resident care. Quality of work-life, defined as “the favourableness or unfavourableness of a job environment for the people working in an organization,” builds from resilience and precedes PCC (Casper et al., 2020, p. 20). In this study, measures were available for three of the organizational factors in the theory (Empowered Managers, Resilience, Quality of Work-Life) and were not available for Trust and Supportive Team Members. Conceptual framework. Note. This figure conveys the relationship between the multifactorial concepts of structural characteristics, financial resources, empowered managers, resilience, quality of work-life, facility-level resident characteristics, and community-level characteristics with retention and the resident care experience. The concepts of empowered managers, resilience, and quality of work-life are from the Empowerment Pyramid for Person-Centered Care by Caspar and colleagues (2020).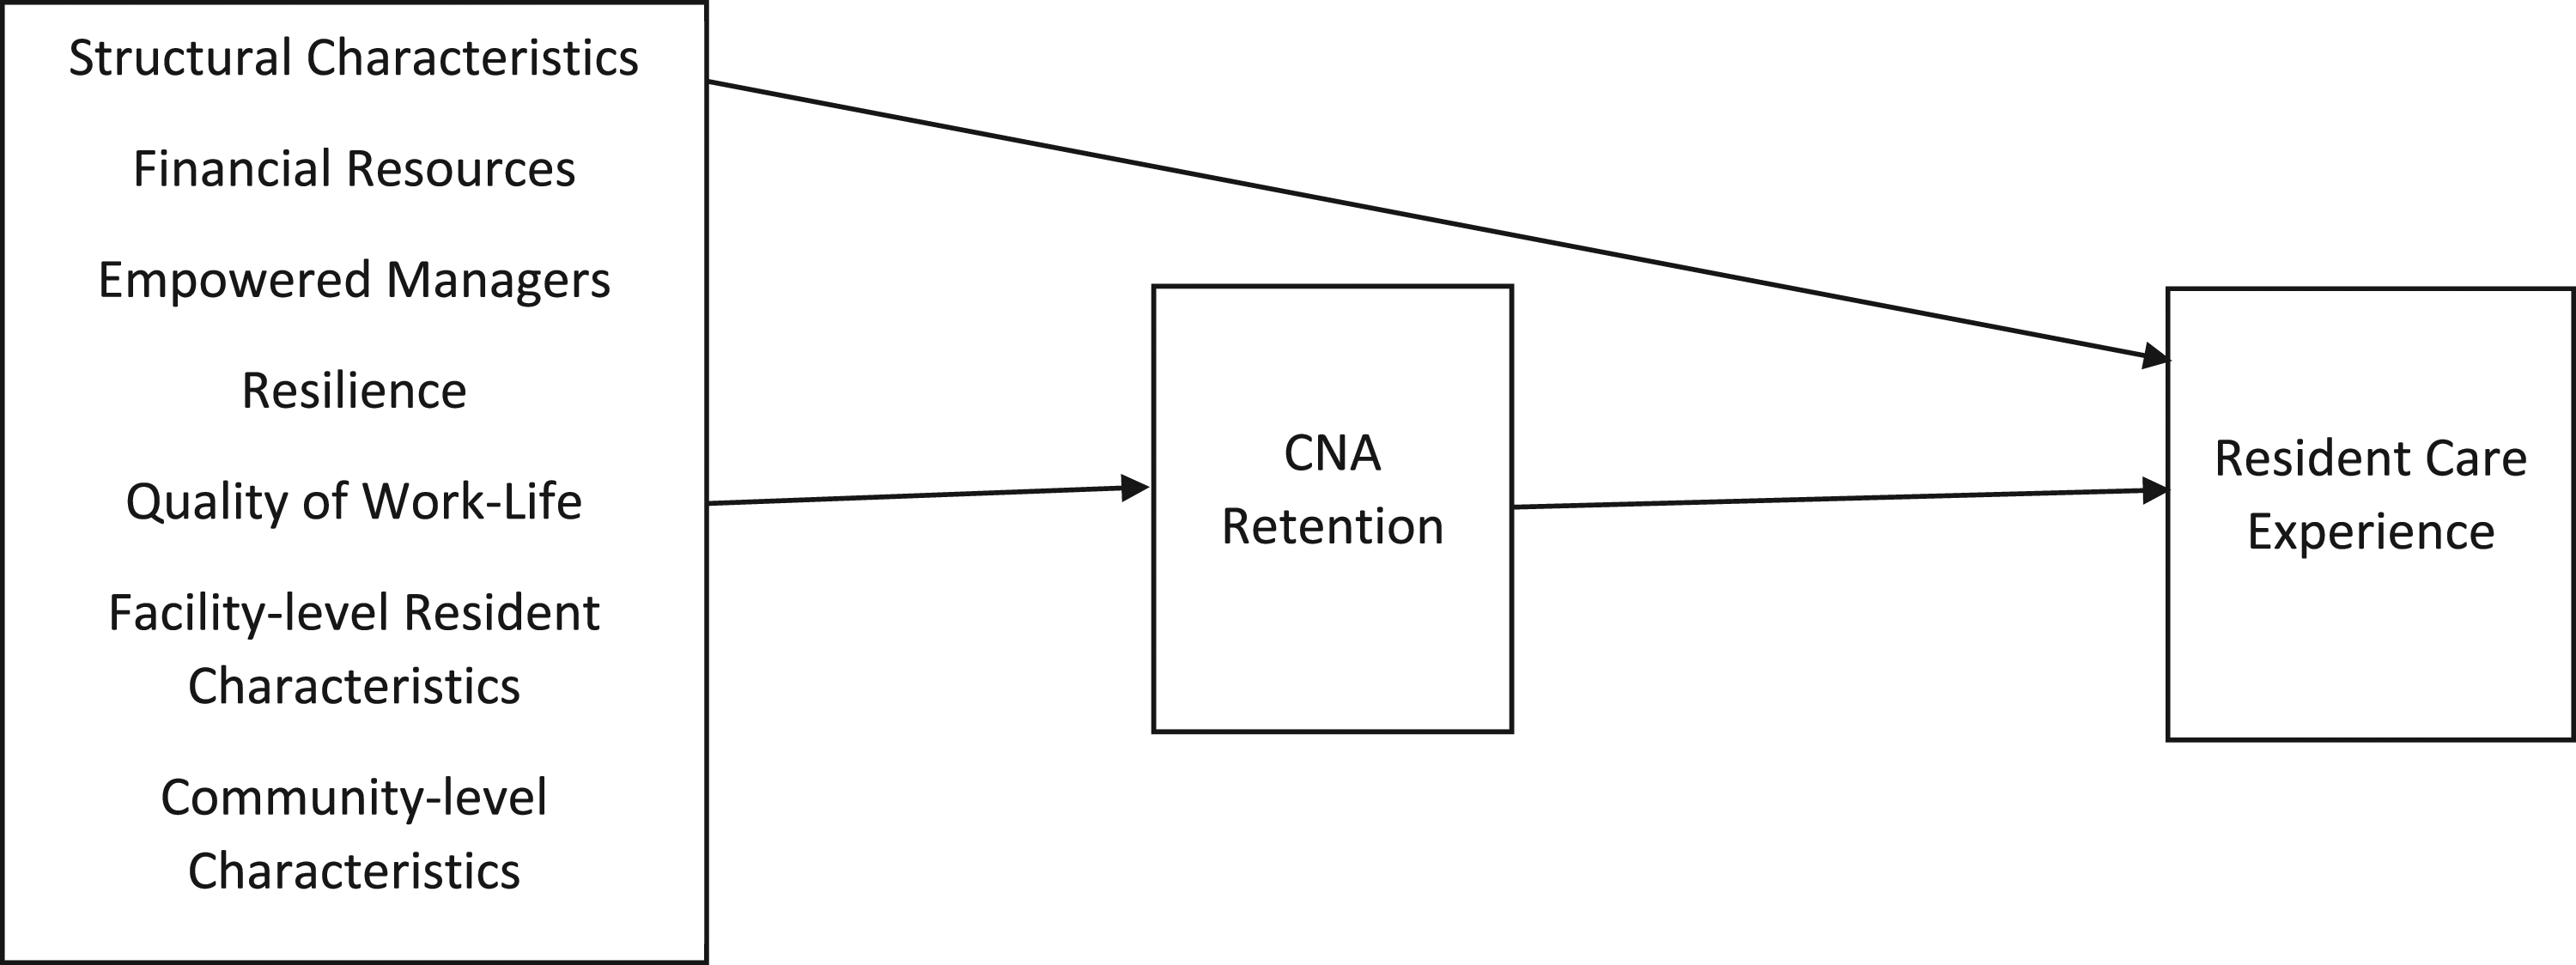
Prior research has also shown that other concepts are associated with retention and quality, including structural characteristics (e.g., nonprofit status), financial resources (e.g., Medicaid per diem rates), NH-level resident characteristics (e.g., % dementia), and community-level characteristics (e.g., micropolitan statistical area) (Kennedy et al., 2020, 2022). As such, Figure 1 makes explicit the relationships tested in this study, between seven multifactorial concepts, retention, and resident care experiences. However, there are intermediary factors between the seven concepts and retention which are not captured in this conceptual model but are important to acknowledge for future research. For example, job satisfaction is an expected outcome of a high-quality job that is related to pay, empowerment, supportive supervision, and lower intent to quit (Bethell et al., 2018; Choi & Johantgen, 2012; Kostiwa & Meeks, 2009).
Methods
Data Sources and Measures
This study was conducted using a unique data set of Ohio NHs from 2017 that comprised data merged from eight sources. Specifically, the Ohio Biennial Survey of Long-Term Care Facilities (Biennial Survey), the Ohio Medicaid Cost Reports (MCR), and the Ohio Nursing Home Resident Satisfaction Survey (RSS) were the state-level data sources used. These were merged with national data sets: Certification and Survey Provider Enhanced Reports (CASPER), LTCFocus, RUCA, Payroll Based Journal (PBJ) Public Use Files, and Area Health Resource File (AHRF).
The 2017 Biennial Survey, conducted by the Scripps Gerontology Center at Miami University, is a longitudinal survey of every Ohio NH and recorded a response rate of 94% (Applebaum et al., 2020). The Biennial Survey, which was in its thirteenth wave, is updated each version based on input from key stakeholders in government and industry. The Ohio Medicaid Cost Reports (MCR) is required by all facilities who receive Medicaid funding. It includes facility self-reported data on ownership, facility size, occupancy, and payer mix.
The RSS involved structured, in-person interviews of Ohio’s NH residents between August and December 2017 by Vital Research, a survey research firm (Vital Research, 2018a; 2018b). The purpose of the survey was to measure the resident experience of living in the NH across seven domains to acknowledge resident perspectives, assist facilities with targeted quality improvement, and obtain information to share with consumers on ltc.ohio.gov (Vital Research, 2018a; 2018b). Residents within facilities were randomly sampled by their length-of-stay in proportion to the resident census. Interviews were complete once enough residents were interviewed to meet the predetermined margin of error (+/− 10%).
All but three of the 966 NHs participated in the RSS, producing a 99.7% facility response rate (n = 963); out of this total, two NHs did not meet the margin of error. On average, trained interviewers completed 24 interviews per NH, though this varied by the facility size (range: 5–35). Sample sizes are appropriate according to a developed method because the facilities are small (Noble et al., 2006). The facility’s resident census determined the number of interviews necessary; for example, facilities with 5–10 residents needed 5 interviews and those with 92–111 residents required 27 interviews to meet the margin of error (Vital Research, 2018b). The NH resident response rate was 69% (n = 23,154) among the 33,457 residents asked to be interviewed (Vital Research, 2018a). Incomplete interviews occurred for 632 residents due to refusals (n = 130), inability to respond (n = 322), fatigue (n = 134), clinical care (n = 19), and other (n = 34), such that a total of 22,522 residents completed interviews (97% of initiated). Of these, 19,127 were long-term residents, reflecting 2.2 years as the average length-of-stay.
The RSS has reported high reliability and validity (Straker et al., 2007). Response categories were simplified to Yes-No and a Do not Know option for ease-of-use. The 2017 survey underwent additional testing prior to implementation (e.g., focus groups, expert feedback) (Straker et al., 2016; Vital Research, 2018a). The short and computer-assisted survey (10 minutes on average) facilitated data collection and accuracy, while the quality assurance plan, including interviewer training and monitoring, protected the data’s validity (Vital Research, 2018a). Importantly, residents with dementia completed interviews. All residents were approached to participate, and only residents who were comatose, in isolation, or whose legal representative did not approve were excluded. No cognitive impairment (CI) data was collected. Interviews started upon the resident identifying themselves, and they were stopped if a resident did not respond verbally or nonverbally to 4 consecutive survey questions. Interviewer training included this protocol to manage interviews with cognitively impaired residents (Dr. Jane Straker & Muriel Wheatley, personal communication, February 23, 2022). Only 1% of interviews involved assistance where a family member, volunteer, guardian, or other person was present.
The CASPER data, the federal snapshot of NHs at the time of annual survey (once every 9–15 months), provides some facility-level controls. CASPER contains aggregated information about NHs (structural and staffing characteristics) and their residents (e.g., functional impairment, medical conditions) as collected by the regulatory body for NHs, Centers for Medicare & Medicaid Services. Brown University’s LTCFocus dataset provides resident-aggregated data of demographics of the nation’s NHs; it is used in this study to control for age and gender. LTCFocus is sponsored by the National Institute on Aging (1P01AG027296) through a cooperative agreement with the Brown University School of Public Health. The PBJ data provides greater accuracy in measuring the number of hours per day CNAs, LPNs, and RNs (both employed and contract) provided care throughout the year compared to CASPER. RUCA version 2.0 provides granularity to the urban-rural dichotomy based on 2004 zip codes. For this study, it is used to separate rural into two categories of large rural city/town and small and isolated small rural town. Finally, the AHRF provides information on local marketplace competition such as the unemployment rate, home health agencies, and population age 65 and older.
To construct the analytic sample, which has a unit of observation of the NH, facilities were selected from the 748 non hospital-based NHs that completed the Biennial Survey (N = 841) and could be merged with other data sources. This sample represents facilities that provided a full-year Medicaid Cost Report (360+ days, N = 855). 1 From this source data, the analytic sample then included facilities that had complete data about CNA retention, covariates, and dependent variables. This resulted in a final analytic sample of 667 NHs, representing more than 70% of facilities operating in 2017.
The Measurement of Retention
The CNA retention rate is calculated from the 2017 Biennial Survey. The question asked: Of the CNAs employed during the first payroll period of 2017, how many of the same CNAs were employed during the last payroll period of 2017?
Four CNA retention groups were created using the quartiles from the 667 facilities in the analytic sample. The first quartile retained between 0% and 48% of its CNAs (N = 170, average = 37.21%). The second quartile retained between 49% and 60% (N = 166, average = 55.48%). The third quartile was between 61% and 72% (N = 168, average = 66.67%), and the top quartile retained between 73% and 100% (N = 163, average = 84.32%). The final regression models include three dummy variables for these quartiles and exclude quartile 1 as the reference category.
For sensitivity analyses, alternative measures of retention were used. These specifications of retention included the following: as a continuous variable and as dummy variables defined at the median (61%+) and defined above the 75th percentile (73%+).
Dependent Variable: Resident Care Experience
The resident care experience is a measure of NH quality of care and quality of life because it incorporates questions fitting to those areas. For example, residents were asked about timeliness and gentleness of care, therapy services, and fulfillment of care preferences, as well as privacy, dignity, and meaningful activity. The scores can take on values from 0% to 100% with higher values representing better resident care experiences.
Vital Research (2018a) calculated the overall and domain average scores used in this analysis. The overall resident care experience average score was calculated by averaging the positive responses to all survey items for all residents (Vital Research, 2018a). In contrast, the domain average scores were calculated by averaging the domain scores for all residents who provided a valid response to at least N-2 items in a domain. Do not know/not applicable/no response was coded as missing.
Facility domain scores of the resident care experience included seven distinct areas based on a unique set of questions (see Supplementary Table 4a). These domains included: Moving In, Care and Services, Environment, Caregivers, Facility Culture, Spending Time, and Meals and Dining.
Control Variables
It is necessary to control for factors that could explain the association between retention and resident experiences. Prior research has shown staffing levels and stable, supportive leadership are relevant. Additionally, high retention could result from a lack of available jobs in the community measured by high unemployment rates, industry employers, and the scale of need in the community (number of beds & population 65+). Besides these, there are many factors that could explain why a nursing home has high CNA retention.
The control variables included in this study are listed below according to the following concepts from Figure 1: structural characteristics, financial resources, empowered managers, resilience, quality of work-life, facility-level resident characteristics, and community-level characteristics. Structural factors include measures of facility size, ownership, chain affiliation, continuing care retirement community, non-owner-operated, percent private rooms, dementia special care unit, and change in ownership or operator. Financial resources variables include occupancy rate, payer mix, and per diem rates for Medicare and Medicaid.
Empowered managers were measured by stable leadership in the administrator and director of nursing (DON) and the administrator knowing most CNAs’ names. Resilience factors consist of staffing levels: the hours per resident per day (HPRD) for employed and contract CNAs, LPNs, and RNs (from PBJ PUFs). HPRDs are also included for the professional social worker, paraprofessional social services staff, and activities staff (from CASPER). NHs that conduct memorials upon resident death was considered a resilience attribute that would help staff cope with grief.
Quality of work-life consists of variables that indicate the NH provides CNAs with empowerment, consistent assignment, cross training, involvement in care plan meetings, choosing residents to care for, belonging to a union, and adopting culture change. Quality of work-life also includes financial retention strategies, such as the NH offers multiple wage incentives (e.g., merit increase, longevity bonus), tuition reimbursement, a retirement plan, paid sick time and paid vacation, and health insurance. Resident activities and the care planning process were also conceptualized as part of quality of work-life. CNAs have identified resident activities as an important part of their work environment, well-being, and job satisfaction, such that an ideal NH should offer “more choices and variety in activities” (Holmberg et al., 2013, p. 4).
Facility-level resident characteristics of age and gender are controlled for, as well as their level of need measured by the Acuindex, and comorbidities such as dementia, psychiatric illness, intellectual disability, and depressive symptoms. Community-level characteristics include the county-level unemployment rate for ages 16+, as well as the supply of NHs, residential care facilities (RCFs), and home health agencies by county that are competing for CNAs. The number of NH beds and RCF rooms/units were specified, as well as the estimated population 65+ in 2017. Finally, the location of the nursing home was specified (e.g., large rural, small isolated rural city/town).
Analysis Plan
First, descriptive statistics were run on all variables, and bivariate tests were conducted to assess the retention-quality relationship. Next, multivariate linear regression analyses controlled for all covariates previously described. The regression analyses clustered facilities within counties using Proc Surveyreg and the cluster command in SAS Version 9.7. To compare among the retention quartiles (Q2 vs. Q3, Q2 vs. Q4, Q3 vs. Q4), F tests were conducted using Proc Reg to determine if they were different from each other. Retention was also compared to Cycle 1 survey deficiencies to examine whether facilities with more deficiencies inflated their retention. To screen out potentially dubious cases, a supplementary analysis excluded government facilities, those who changed ownership and/or operator, those with 2 or more administrator and DON turnovers, and with Medicare or Medicaid rates and enrollments below 2 standard deviations from the means (see Supplementary Table 3a).
Results
Summary Statistics on Key Independent Variables Comparing Ohio Freestanding Nursing Homes and the Analytic Sample.
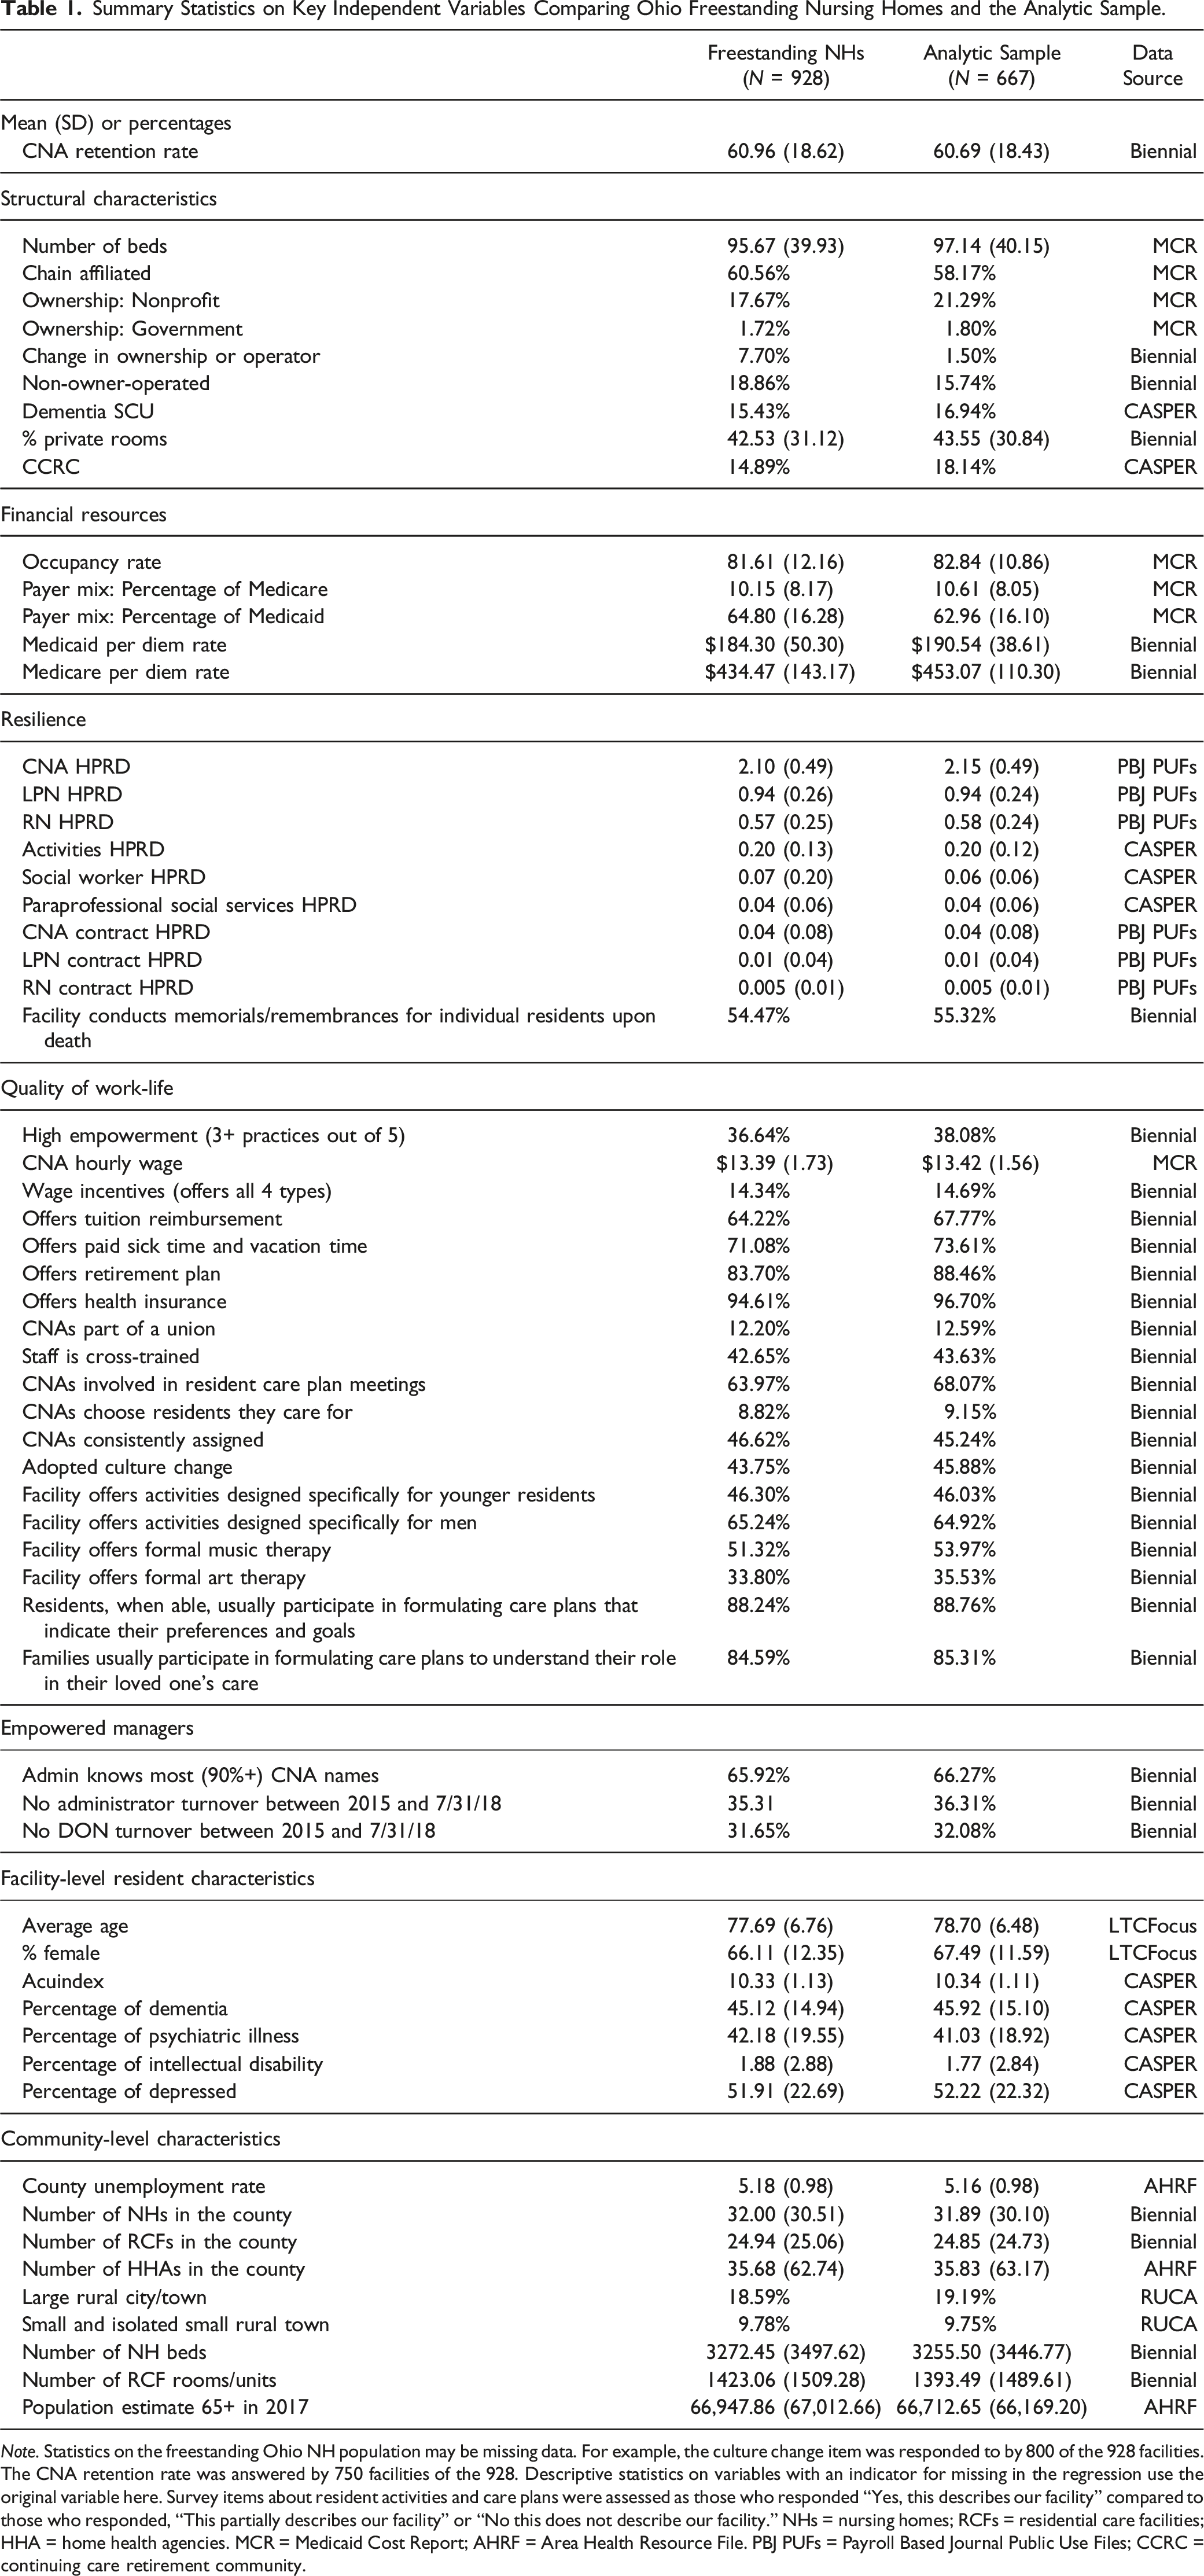
Note. Statistics on the freestanding Ohio NH population may be missing data. For example, the culture change item was responded to by 800 of the 928 facilities. The CNA retention rate was answered by 750 facilities of the 928. Descriptive statistics on variables with an indicator for missing in the regression use the original variable here. Survey items about resident activities and care plans were assessed as those who responded “Yes, this describes our facility” compared to those who responded, “This partially describes our facility” or “No this does not describe our facility.” NHs = nursing homes; RCFs = residential care facilities; HHA = home health agencies. MCR = Medicaid Cost Report; AHRF = Area Health Resource File. PBJ PUFs = Payroll Based Journal Public Use Files; CCRC = continuing care retirement community.
Thirty-six percent of NHs experienced stable leadership (no turnover) of the administrator and 32% in the DON position between 2015 and July 31, 2018. The HPRDs provided by CNAs, LPNs, and RNs were 2.15, 0.94, and 0.58 on average. By comparison, the hours provided to residents by activities staff, social workers, and paraprofessional social services were 0.2, 0.06, and 0.04 each day.
Figure 2 shows the average resident care experience scores by retention quartile. An ANOVA with a Tukey post hoc test (F = 4.61, p = .0033) showed that Quartile 3 CNA retention NHs had significantly higher overall resident care experience scores compared to Quartile 1 by a difference of 2.43; Quartile 3 had higher overall scores by 1.8 on average than Quartile 4 (p < .05). In addition, Quartile 3 had significantly higher scores on spending time, caregivers, environment, and facility culture compared to Quartile 1. Quartile 3 also had higher spending time scores than Quartile 2. Note. Resident Care Experience Scores by CNA Retention Quartiles. Note: An ANOVA with a Tukey post hoc test (F = 4.61, p = .0033) showed that Quartile 3 CNA retention NHs had significantly higher overall resident care experience scores compared to Quartile 1 by a difference of 2.43; Quartile 3 was also significantly different on this score from Quartile 4 by 1.80 (p < .05). Quartile 3 had significantly higher scores on spending time, caregivers, environment, and facility culture compared to Quartile 1. Quartile 3 also had higher spending time scores than Quartile 2. *Indicates a difference exists between two groups without controlling for other factors, p < .05.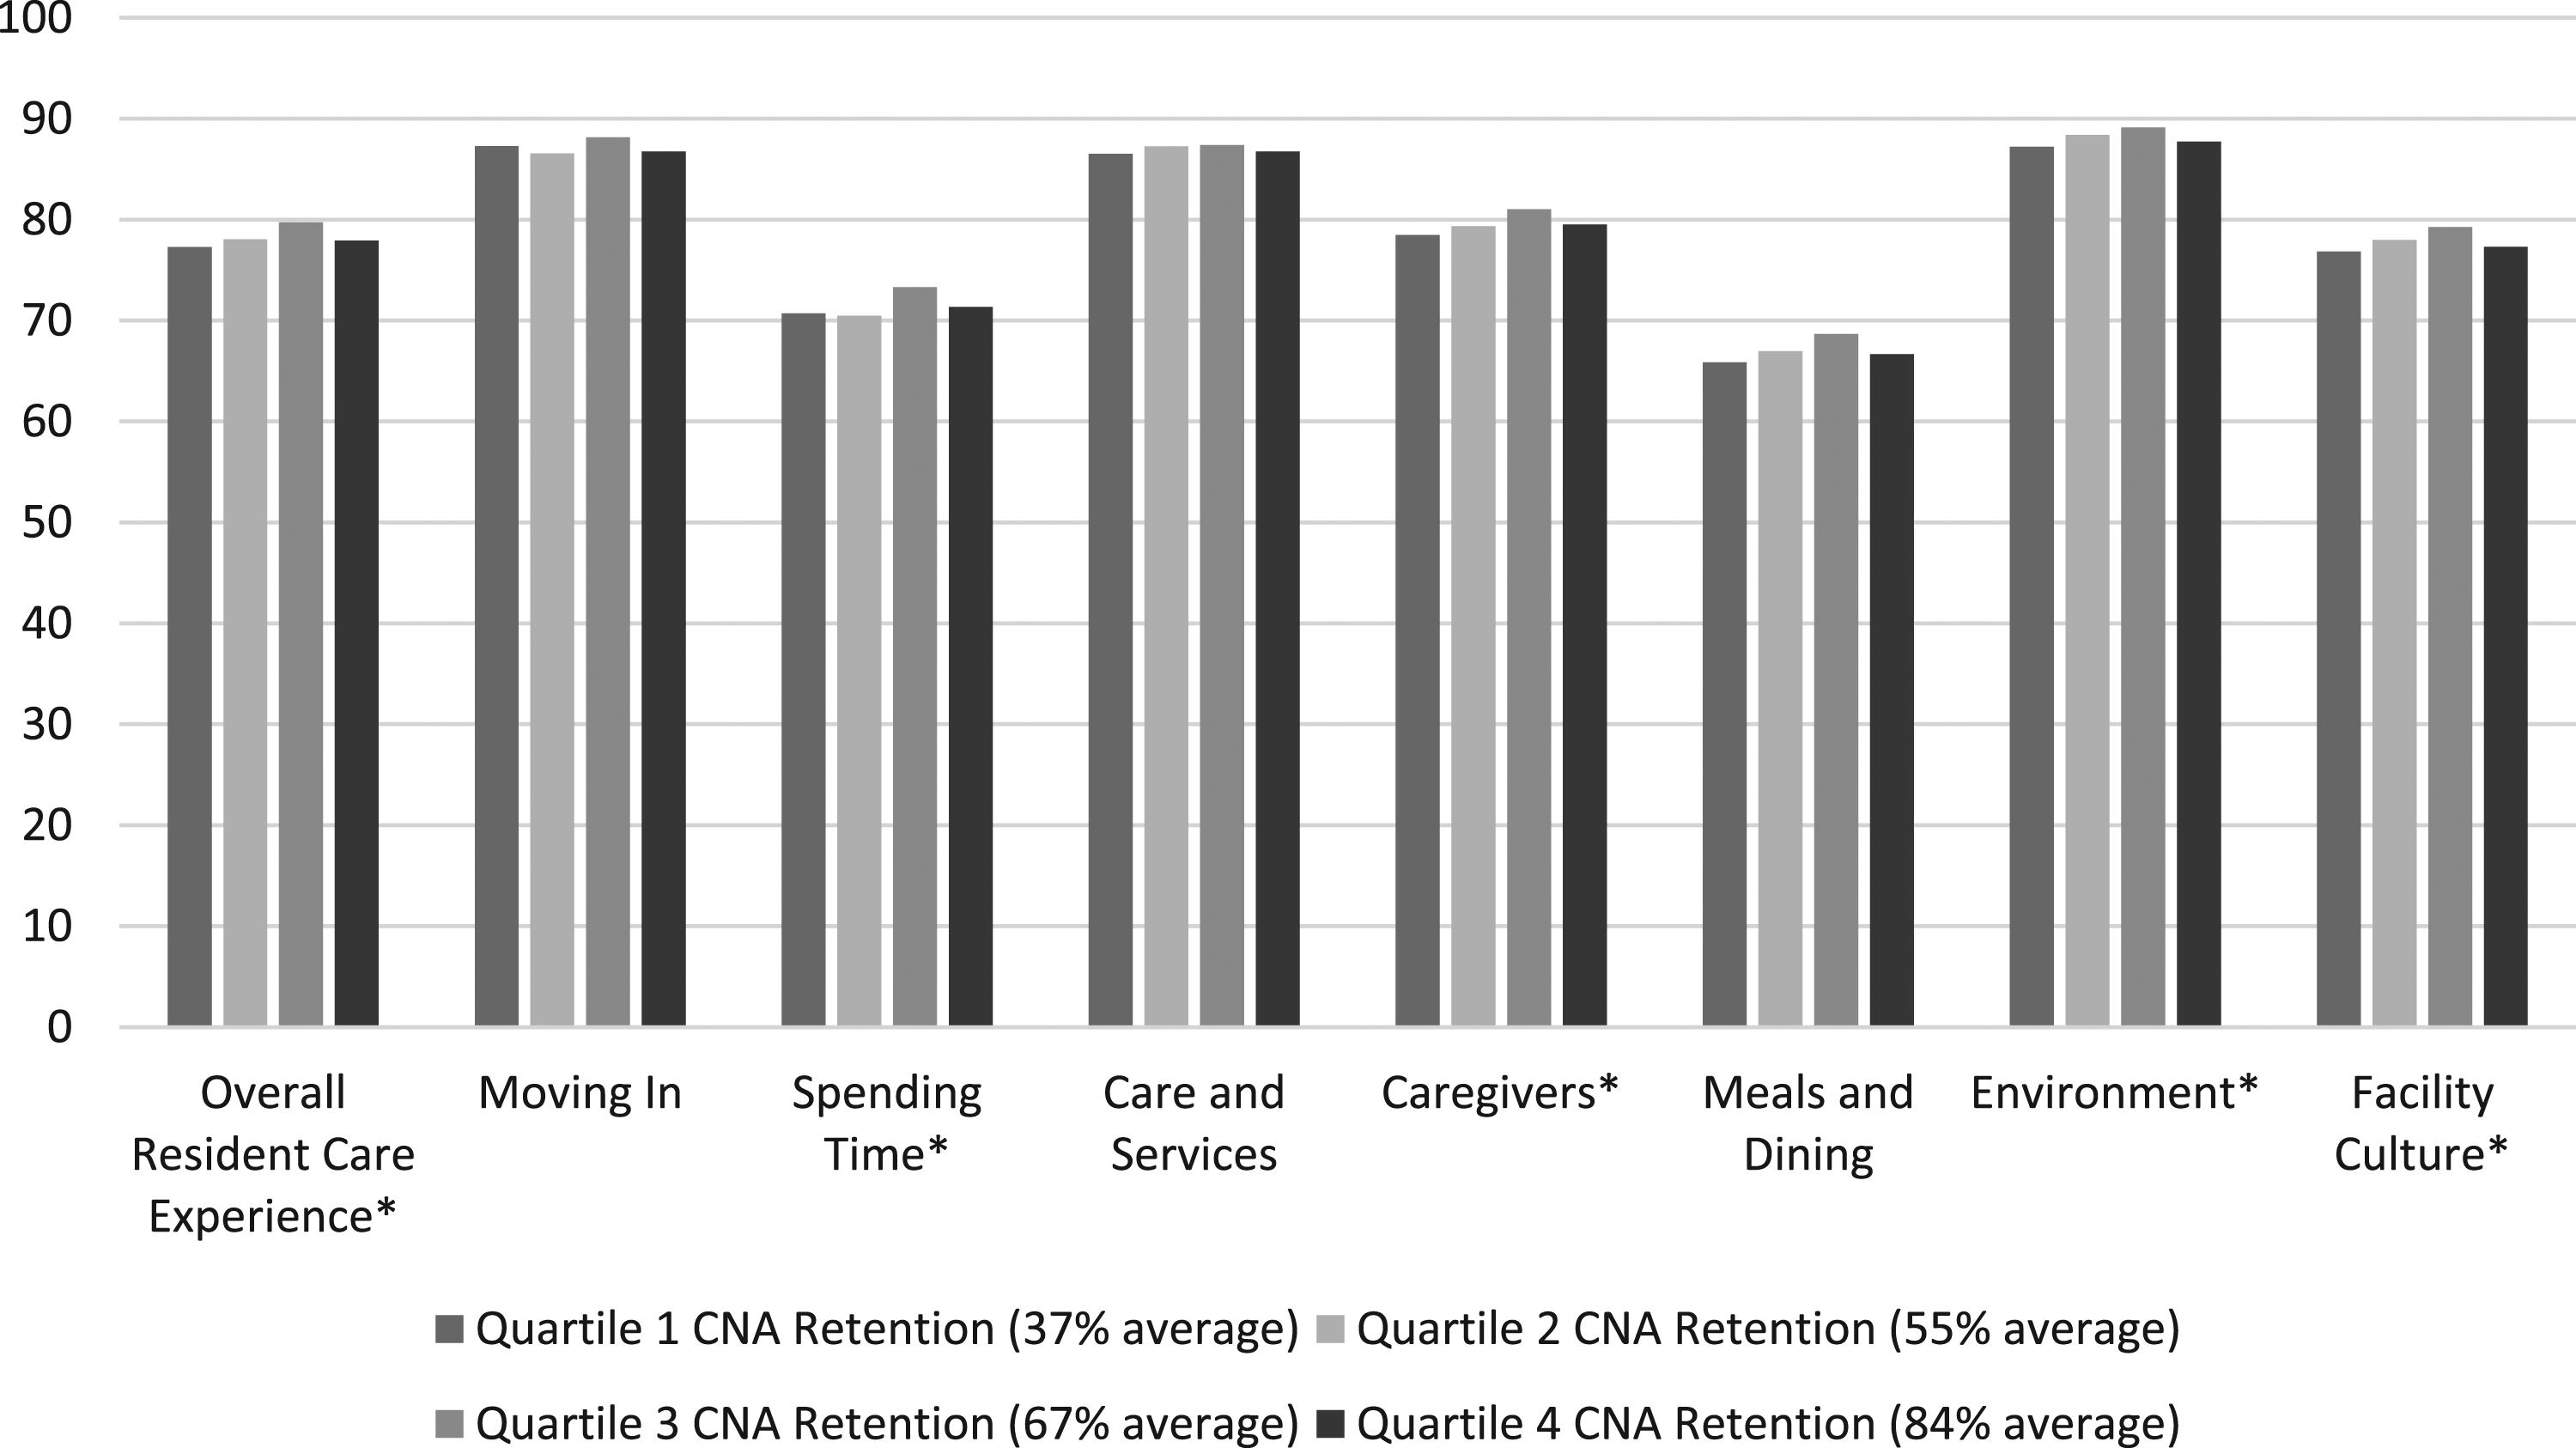
OLS Regression Coefficients with Robust Standard Errors for Resident Care Experience Domain and Overall Scores Using Multiple Specifications of CNA Retention on the Full Sample (n = 667).

Note. This sample includes freestanding facilities in Ohio who responded to the 2017 Biennial Survey and who also provided a full-year Medicaid Cost Report (N = 667). Variables for consistent assignment, administrator turnover, director of nursing turnover, average age, and percent female have an associated variable to allow facilities missing on these variables to be kept in the model. Significance levels: ^p < .10, *p < 0.05.
There were some significant findings for the domains that align with the bivariate tests. NHs in Quartile 3 of CNA retention had significantly higher environment domain scores by 1.36 percentage points compared to Quartile 1 after accounting for other factors (p < .05). However, no other comparisons between Quartiles 2, 3, or 4 compared to 1 were significant. Quartile 3 NHs had significantly higher spending time scores than Quartile 2 (p < .01).
After controlling for other factors, NHs in Quartile 4 of CNA retention (73–100%) had significantly lower domain scores in facility culture by 1.31 percentage points compared with NHs below the 75th percentile (p < .05). This finding was supported by F tests which found significant differences in overall resident care experiences, spending time, environment, and facility culture between Quartile 3 and 4 NHs. Across these outcomes, Quartile 3 NHs had higher scores than Quartile 4 (p < .05).
Quartile 4 NHs warranted an exploration of their characteristics given that they did not show the best resident care experience scores as expected. Compared to NHs with 0–72% CNA retention, those with CNA retention 73% and above had fewer Medicare residents (9.24% vs. 11.06%) (t = 3.18, df = 448.37, p < .01) and received lower Medicare rates ($434.92 vs. $458.94) (t = 2.43, df = 665, p < .05).
Supplementary Table 1a shows the full regression model for the overall resident care experience. Supplementary Table 2a shows the full models for two domains, Spending Time and Caregivers, to see if there are patterns in the covariates. While some covariates remained significant across these two outcomes (i.e., average age, number of NHs, number of NH beds), there was variability by domain.
Higher scores for spending time were related to social worker HPRD and culture change adoption. Each one-unit increase in social worker HPRD was associated with an 11.56 percentage-point increase in spending time scores after controlling for other factors (p < .05). Culture change that completely changed the way the NH takes care of residents in some or all areas of the organization was associated with 1.24 percentage points increase in spending time scores after controlling for other factors (p < .05).
When it came to the caregiver domain, higher scores were related to having higher RN HPRD. Each one-unit increase in RN HPRD was related to a 3.68 percentage-point increase in caregiving scores after controlling for other factors (p < .05). No other covariates were significant. NHs that changed ownership and/or operator during 2017 was associated with a 2.31-percentage point reduction in the caregiving score compared to NHs that experienced no change (p < .05). Each one-percentage-point increase in residents with dementia was associated with a 0.07 percentage-point increase in the caregiving score (p < .01).
Re-running these results using the sample subset showed there was no difference in resident experience scores among facilities with above-median retention compared to those below (Supplementary Table 3a). However, NHs in Quartile 4 retention was associated with a 1.61 percentage-point increase in the Care and Services domain compared to NHs in Q1-Q3 (p < .05). This was a difference from the analytic sample but in the expected direction. Using quartiles yielded null comparisons between Quartiles 2–4 and Quartile 1. However, NHs in Quartile 3 had significantly higher Environment scores than those in Quartile 4 (Chi-square = 5.10, p < .05). This repeated for the Care and Services domain (Chi-Square = 4.99, p < .05).
Discussion
The results weakly supported the hypothesis that higher resident care experiences would be positively associated with higher CNA retention. Only some comparisons between high versus low retention were statistically significant and the pattern was not widespread across multiple outcomes. Moreover, there was a pattern across multiple outcomes that Quartile 4 of retention had significantly lower performance than other facilities and specifically Quartile 3. Even among the subsample perhaps less likely to be making self-reporting errors or inflating their values, retention was not consistently associated with resident care experiences. These results dispel the assumption that all retention is beneficial.
While some of the retention results were statistically significant, their practical significance is reduced by their small effect sizes compared to other covariates (e.g., 1.36% points). Despite this, the fit of the conceptual framework to the hypothesis was good as measured by R-squared values of the models (between 0.25–0.5). Specific covariates in the resilience category (staffing levels) and quality of work-life (culture change) had larger effect sizes than retention. Notably, the addition of a social worker HPRD was associated with an almost 12 percentage-point gain in spending time. Similarly, RN hours mattered for residents’ perceptions of caregivers.
Practice and Policy Implications
The descriptive findings from this study showed that nearly 4 in 10 Ohio freestanding NHs had the same administrator and over 3 in 10 retained the same DON between 2015–2018. In other words, the majority of NHs experienced managerial turnover, especially among DONs. Stability in the DON position approached statistical significance for better resident care experiences. For practice, the implication is that investing in DON retention could have a positive impact on residents. NH DONs are paid less than those who work in hospitals and Veterans Affairs NHs, so this disparity should be addressed to keep high-quality DONs who supervise CNAs. CNAs report that supportive supervision is the most influential factor associated with lower intent to leave and higher job satisfaction (Bethell et al., 2018; Choi & Johantgen, 2012). Research has also shown DON turnover is related to significantly lower CNA retention rates (Kennedy et al., 2022). This suggests that CNAs remain employed when they trust and mutually respect their supervisor over some time. Yet supportive supervision includes disciplining CNAs when there are performance issues, which could produce some turnover (Choi & Johantgen, 2012). In this study, the best resident experiences were found in NHs with some CNA turnover. Involving students in CNA roles despite their eventual departure should be viewed as a positive experience because they gain experience and CNA staffing is consistent.
In terms of policy, there are many changes needed to affect the long-term retention of CNAs in their jobs. Castle’s (2021) study showed 5+ year retention of CNAs in the same NH was about 18% based on data from 2016. From this data, most CNAs are not staying in their jobs as a career. Those who have stayed long-term refer to themselves as “career CNAs.” Their jobs are not viewed as professional ones with potential for internal promotion within the same job category (Stone & Bryant, 2021). There are no national CNA specializations or career ladders that would promote professional development and retention. This is an important omission because not all CNAs may want to become licensed nurses. Thus, policy should support research targeted at improving the training and skillset of CNAs and broadening the use of the national competency exam (Drake, 2020).
Research Implications
Future studies should use individual-level data to examine how CNA retention within a unit-month affects resident care experiences, well-being, and health outcomes (Winter et al., 2021). It is important to have good measures that capture the relationship between the resident and CNA, making sure that staff assigned to and providing care in one unit are not floating between areas. If staff float between areas, the expected relationships between those staff and residents would not be as strong. Researchers can leverage payroll data, managerial accounting systems, technology-based staffing systems like Acustaff, or create your own management-information system using payroll records as done in the Better Jobs Better Care demonstration (Barry et al., 2008). Future research should measure NH staff retention beyond a 1-year timeframe to build the evidence base for greater investment in their jobs (Castle, 2021).
Particular conditions where the hypothesized positive effect of retention could be found include memory care units. Adlbrecht et al. (2021) argue that high retention is a prerequisite for “sustainable implementation” of the dementia care concept. Consistency among the CNAs caring for residents with long-term care needs fits the conceptual model and the theory of relational coordination. The theory specifies that “relationships of shared knowledge, shared goals and mutual respect” enable “coordinated collective action” through the formation of a collective identity and “timely, frequent problem-solving communication,” all of which are important when tasks require working together (Gittell, 2006, p. 75, 84). The presence of a stable CNA team should be related to each prerequisite in the theory of relational coordination.
Future research that develops and tests the conceptual model presented in this study would improve the field’s understanding of the interrelationship between external factors, retention, and resident experiences. It is important to validate the Empowerment Pyramid of PCC in the U.S. context. Furthermore, data collection from workers is necessary to test a full conceptual model that captures workers’ perceptions about their jobs.
Finally, a qualitative study of nursing homes with the highest retention rates would be especially informative to understand the attributes that contributed to poorer quality resident experiences. How do retained CNAs perceive their jobs in these settings? Are they dissatisfied, stressed, depressed, or burned out such that it negatively affects resident care? How does the NH’s financial resources and physical environment affect CNAs’ work and the resident care? What does alternative employment look like in those communities? How does management engage with their CNAs?
Limitations
This study is not able to control for potential systematic bias in how administrators responded for retention rates or in how NH residents responded to survey items. Thus, it remains unknown the extent to which the relationships found in this study are true or the result of measurement bias or omitted variables. This analysis was limited to using an annual measure of retention in a facility as our data did not include longer time periods. Moreover, we do not know why CNAs are staying or leaving as well as characteristics about their jobs and personal factors. We do not know what proportion of turnover was voluntary, involuntary, or other (retired, disabled). We also do not know about the prevalence of job transfers within the same NH. These factors are necessary to understand the big picture of how staff stability correlates with quality.
An important element of the Resident Satisfaction Survey was its inclusion of residents with dementia and not excluding anyone based on CI. Because no CI data were collected as part of the interview, we do not know whether those with CI responded differently than those without. We do not know the prevalence of CI other than knowing about 45% of residents had dementia upon annual survey. Past research involving individuals with mild to moderate dementia has shown reliable self-reports of quality of life (Trigg et al., 2007).
Strengths
This paper formed an analysis using a resident-derived survey and an inclusive set of control variables. The analytic sample size was also a strength in that over 70% of freestanding NHs operating in 2017 were respondents, emphasizing generalizability.
Conclusion
The current study demonstrated that the relationship between retention and quality is complex, not all retention is beneficial, and that much more information about workers is required to understand what retention means in practice.
Supplemental Material
Supplemental Material - The Effect of Nurse Aide Retention on Ohio’s Nursing Home Resident Care Experience Scores: A Facility-Level Analysis
Supplemental Material for The Effect of Nurse Aide Retention on Ohio’s Nursing Home Resident Care Experience Scores: A Facility-Level Analysis by Katherine A. Kennedy in Journal of Applied Gerontology.
Footnotes
Acknowledgments
I would like to thank and acknowledge the support of my dissertation committee in this work: Dr. Bob Applebaum (Chair), Dr. John Bowblis (Co-Chair), Dr. Katy M. Abbott, Dr. Jane K. Straker, and Dr. Amy Roberts. Dr. Jane Straker provided her perspective as the PI of the Ohio Nursing Home Resident Satisfaction Survey. The Ohio Biennial Survey of Long-term Care Facilities and the Ohio Nursing Home Resident Satisfaction Survey were collected by the Scripps Gerontology Center, and all other data used in this study are publicly available.
Declaration of Conflicting Interests
The author(s) declared no potential conflicts of interest with respect to the research, authorship, and/or publication of this article.
Funding
The author(s) disclosed receipt of the following financial support for the research, authorship, and/or publication of this article: This material is based upon work supported by the U.S. Department of Veterans Affairs, Veterans Health Administration, Office of Research and Development, Office of Academic Affiliation Advanced Fellowship in Health Services Research & Development (3K112021B).
IRB Protocol
Miami University’s (MU) Institutional Review Board approved this study (Protocol ID: 03713e).
Disclaimer
The views expressed in this article are those of the authors and do not necessarily reflect the position or policy of the Department of Veterans Affairs or the United States government.
Supplemental Material
Supplemental material for this article is available online.
Note
References
Supplementary Material
Please find the following supplemental material available below.
For Open Access articles published under a Creative Commons License, all supplemental material carries the same license as the article it is associated with.
For non-Open Access articles published, all supplemental material carries a non-exclusive license, and permission requests for re-use of supplemental material or any part of supplemental material shall be sent directly to the copyright owner as specified in the copyright notice associated with the article.