
Abstract
Meta-analyses of the effects of dance on depressive symptoms in older adults have shown contradictory results, but few primary studies were included (5 and 8 studies). We aimed to examine the effects of dance on depressive symptoms in older adults aged 60 years and older and to examine the moderator effects of the source, participants, methods, and intervention characteristics. We included 23 primary studies that compared depressive symptoms across dance and comparison/control groups of older adults (72 ± 6.7 years old) and were written in English (N = 1,398) participants. Dance groups showed significantly less depressive symptoms post-intervention than comparison groups (ES = 0.66, 95% CI [0.42, 0.91], p < .001, I 2 = 76.80%). South America and Australia showed the greatest effects. Using quasi-experimental designs showed significant effect sizes compared to using randomized designs. Only one quality indicator, intention-to-treat, influenced effect size. Dance might be used as an alternative treatment to improve depression.
• This current meta-analysis, to our knowledge, is the first meta-analysis to specifically examine the effects of dance on depression in older adults aged 60 years with moderator testing. • Dance interventions can significantly reduce depressive symptoms among older adults aged 60 years and over. • Moderator analysis indicates that the country where the intervention was performed could influence its effectiveness.
• This study provides a quantitative summary of the evidence regarding the effects of dance interventions on depressive symptoms in older adults aged 60 or over. Thus, when incorporating evidence-based practice, community leaders and healthcare providers might offer regular dance opportunities for older adults. • Studies are needed to investigate the long-term effectiveness of dance on depression. • Researchers and healthcare providers should consider offering dance interventions that incorporate older adults’ lifestyle and cultural context to promote adherence and improve depression.What this paper adds
Applications of study findings
Introduction
Depression is the most common psychological problem in older adults (World Health Organization [WHO], 2017). The prevalence of depression in the older population (aged 60 and older) has been shown to be 31.74% (Zenebe et al., 2021). The etiology of depression in older adults is related to several factors. Biological risk factors include endocrine, cardiovascular, and neuroanatomical systems. A decline in biological factors results in depression in older adults (Fiske et al., 2009). Social risk factors are related to a lack of interpersonal communication, social support, and stressful life events which increase depressive symptoms (Lemma et al., 2010; Zenebe et al., 2021). Multiple chronic illnesses contribute to depressive symptoms. For example, self-management of chronic illnesses requires older adults to adjust their diets, exercise, medications, or lifestyles which add burden can tax mental health (National Institutes of Health [NIH], 2017; Wilson-Genderson et al., 2017). Poor physical function results in difficulty engaging in activities of daily living which negatively affects self-efficacy, social interaction, and mental health (Leong et al., 2020; Zhao et al., 2022). Low physical activity is related to low self-esteem, decreased social participation, and less accomplishments which potentially contribute to a high level of depressive symptoms (Eriksson et al., 2020; Perez-Sousa et al., 2020; Yuenyongchaiwat et al., 2018).
Depression presents differently in older adults than in younger adults. Older adults are likely to have more somatic presentation and agitation, whereas younger adults report feelings of guilt and loss of sexual interest (Hegeman et al., 2012). Depression has become a serious public health concern and one of the top three diseases that contribute to disability among older adults (Vos et al., 2016). As a result, depression poses significant challenges for healthcare providers and researchers who work with this older population.
Currently, although pharmacological interventions have been shown to be effective for improving depression (NIH, 2017), depressed older adults may stop taking antidepressants due to side effects, such as renal dysfunction and postural hypotension (Frank, 2014).
Physical activity refers to a bodily movement produced by skeletal muscles that increases energy expenditure (Caspersen et al., 1985; WHO, 2020). Exercise is a subset of physical activity. Physical activity and exercise have the same elements including bodily movement that expends energy and is positively related to physical fitness. However, exercise involves a planned, structure, and repetitive activity to improve or maintain one or more physical fitness components (Caspersen et al., 1985).
Physical activity plays a crucial role in promoting health, well-being, and quality of life among the older individuals (Shengzhi et al., 2020). Performing physical activity can provide health benefits by enhancing individuals’ psychological state, that is, improving their depression and anxiety (Mandolesi et al., 2018; Musich et al., 2017). The authors of three systematic reviews have shown that physical activity decreases depressive symptoms in older adults (Mura & Carta, 2013; Rhyner & Watts, 2016; Seo & Chao, 2018).
Despite the various benefits of regular physical activity on depression, only a small number of older adults reported achieving sufficient levels of physical activity (Cunningham et al., 2020). Two potential factors related to poor exercise adherence might be lack of motivation (Booth et al., 2019; Derakhshanrad et al., 2020; Predovan et al., 2019; Spiteri et al., 2019) and the repetitive form of exercise, which may be perceived as boring (Studenski et al., 2010). Therefore, the adherence rates of physical activity interventions are usually poor with high rates of attrition (Ferreira et al., 2018; Frändin et al., 2016; Kocic et al., 2018). Promoting an activity that is fun may be a strategy that can motivate older adults to engage in physical activity and promote adherence (Devereux-Fitzgerald et al., 2016; Silva et al., 2018). One such fun physical activity for many people is dance.
Dance is an alternative form of physical activity that is defined as a movement of the body to rhythm, normally with music (Douka et al., 2019; Mackrell, 2020). Dance is likely less boring than other types of physical activity, motivating older adults to engage in this form of physical activity (Bevilacqua et al., 2021). Thus, examining the overall effects of dance on depression (the focus of this study) has utility for clinicians.
Dance interventions (or dance) are different from dance movement therapy (DMT), which is referred to simply as dance therapy. DMT tends to promote physical and psychological health of individuals (Hwang & Braun, 2015). DMT is a form of psychotherapy which focuses on building a therapeutic relationship between client and therapist; DMT is using movement to promote therapeutic outcomes, such as enhanced body image and self-esteem, improved depressive and anxiety symptoms, reduced eating disorders, and decreased chronic pain (Karkou et al., 2019). DMT promotes the expression of emotions through dance or movement (Michels et al., 2018).
Dance interventions have been shown to improve physical health (Meng et al., 2020), cognitive performance (Doi et al., 2017), and emotional health (Cruz-Ferreira et al., 2015). Moreover, dance programs can promote social interaction, fun, and enjoyment (Keogh et al., 2009). Interestingly, adherence rates for dance interventions among older adults have been high, with completion rates of 81%–100% (Hwang & Braun, 2015). Thus, dance can promote physical and psychological functioning in older adults.
Several researchers have shown dance interventions to be clinically beneficial for older adults with depression. In one meta-analysis, Liu et al. (2021) showed that dance interventions were related to reduced depression in older adults with mild cognitive impairment aged 60 and older (standardized mean difference [SMD] = −0.54, 95% CI [−0.91, −0.17], p = .005). However, these meta-analysts included only eight primary studies. Likewise, in another meta-analysis, Wang et al. (2022) reported that dance interventions had a positive effect on depression in older adults with mild cognitive impairment and dementia (SMD = −0.42, 95% CI [−0.60,−0.23], p = .0001); they included only five primary studies. Thus, findings from these two meta-analyses suggested beneficial effects of dance interventions on depressive symptoms in people with mild cognitive impairment or dementia. However, the number of primary studies across these meta-analyses were small (8 vs. 5, respectively), and their focus was on older adults with cognitive impairment which is commonly associated with depression. The effects of dance on depression in the more general older adult population need to be examined. In addition, small numbers of primary studies can result in biased results. Thus, the purpose of this study was to examine the effect of dance on depression in adults aged 60 and older. In addition, we examined the moderator effects of the source, participants, methods, and intervention characteristics.
Methods
Search Strategy
We consulted an expert librarian regarding searching. We performed a comprehensive search of 13 databases and 1 dance journal through August 2022 without date restrictions. The 13 databases and their inception dates in parentheses included PubMed (1809+), CINAHL (1938+), Scopus (1789+), Cochrane review (1996+), ClinicalTrials.gov (2000+), AgeLine (1924), Ovid PsycINFO (1968+), Academic Search Complete (1887+), Education Resource Information (1966+), ProQuest Dissertation & Theses (1996+), Education Source (1880+), Science Direct (1880+), and Ovid Medline (1946+). In addition, we also included the American Journal of Dance Therapy (2010+). The key search terms were (dance* OR dancing) AND (depress* OR depression OR depressive OR depressed OR depressive disorder) AND (older adult* OR aged OR aging OR elderly OR geriatric*). Using asterisks includes multiple forms of the words, a useful technique to broaden the search. We followed the Preferred Reporting Items for Systematic Reviewers and Meta-analysis (PRISMA; Page et al., 2021). Please see Supplemental Table 1. Finally, we reviewed the reference lists of eligible primary studies and systematic reviews and meta-analyses for additional studies.
Inclusion and Exclusion Criteria
We included primary studies in which researchers compared dance interventions with comparison/control groups of adults 60 years old or older ((United Nations, 2019) Nations, 2019) and measured depression as a quantitative outcome; studies had to be written in English. We excluded primary studies where researchers did not report sufficient data to compute effect size, such as means and standard deviations (SDs) or standard error (SE) or confidence intervals (CIs) of depression, after we requested these data and authors did not send these data within 2 months. If SE or CIs were available, we converted to SD. We also excluded studies with less than five participants in each group or when intervention groups received dance with an alternative intervention that influenced depressive symptoms, such as meditation or social support programs. Moreover, we excluded studies of physical activity that did not present dance effects on depression separately. Finally, we excluded case studies, systematic reviews, meta-analyses, and qualitative studies.
Data Extraction and Coding
We developed a codebook and revised it during pilot testing with five primary studies. Five categories of data were coded, including source information, methods, dance interventions, participant characteristics, and outcomes. Source information included year of publication, country where the study was conducted, funding, and publication type (not published, journal article, book or book chapter, organizational report, conference presentation, doctoral dissertation, thesis, and other). Method characteristics included the recruitment setting, setting where the study was conducted, type of comparison group (waitlist control, usual control group, and comparison group without dance), recruitment technique (convenience, cluster, simple randomized, stratified randomized, and purposive sampling), type of assign to groups (random individual, random cluster, non-random, and one group pre-posttest), and concealed allocation, masked data collection, intention-to-treat (ITT) analysis, a priori power calculation, whether or not participants’ characteristics were compared at baseline (yes/no), and were equivalent across groups (yes/no). Intervention characteristics included intervention fidelity, if interventionists were trained in dance and the number of hours of their dance training, dance format, type of dance, buddy/others involved, dance posture during intervention (standing, sitting, or both), number of days across the dance intervention, number of sessions per week, duration of dance sessions, and intensity level of dance. Participants’ characteristics included sample size at group assignment and at analysis, attrition, number of females, number of Whites/African American/Asian/others, cognitive screening, clinical health conditions of sample coded separately if over 50% of participants in the primary study had the condition (e.g., cognitive impairment, mood disorders, anxiety, stress, Parkinson’s disease, diabetic mellitus, hypertension, and cancer), and mean age and standard SD. Outcome information included mean depression score and SD, F-value for depression, t-value for depression, p-value, and direction of effect. When the primary researchers included more than two groups, we included dance intervention groups with comparison groups without dance to examine the effects of dance only. For example, a therapy group would only be used if it were compared to a therapy plus dance in the same study.
The first two authors (TR and CR) independently coded each primary study including the inclusion criteria. In case of discrepancy, they consulted the third author (JKS) to reach consensus. Data were double entered into REDCap and compared to correct data entry errors. Once data entry errors were corrected, data were downloaded into SPSS to describe study characteristics and Comprehensive Meta-Analysis (CMA v3.0) for meta-analysis.
Statistical Analysis
Primary studies were diverse in multiple ways. They were conducted by different investigators in different labs across different countries and cultures, etc., all things that have immeasurable effects, we used a random-effects model in CMA because we assumed that the true effect varies across studies and that the primary studies in this meta-analysis is a random sample of effect sizes and therefore normally distributed. We computed standardized mean differences between dance and comparison groups’ posttest depression scores because the primary researchers used a variety of measures with different metrics to assess depressive symptoms. Because the standardized mean difference standardizes metrics, it allows the comparison of scales with different metrics; this effect size is often called Cohen’s d (Borenstein et al., 2021). Because Cohen’s d slightly overestimates the population parameter, we computed the effect size using the Hedges’ g correction. Thus, CMA converts d to Hedges’ g with a correction factor (Borenstein et al., 2021).
Because people with depressive symptoms can recover without treatment (Whiteford et al., 2013), that is, spontaneously, or for unknown reasons, we analyzed the dance and comparison groups separately using single-group pre-posttest comparisons to check for spontaneous recovery. If we had found improvement in the comparison/control groups between pre- and posttests, then we would assume that the dance groups would also have some effects of spontaneous recovery. For this analysis, we had to consider that pre- and post-depressive scores are correlated within groups. However, few primary researchers provide those correlations. Therefore, we explored the analysis under two different methods: using a positive correlation (r = 0.80) and no correlation (r = 0.0) between pre- and post-test comparisons (Conn et al., 2009).
To test heterogeneity, we used the forest plot, a graphical representation, to display variability across studies. We also used the Q statistic to show overall variability across studies. A significant Q statistic suggests heterogeneity. Moreover, we used I 2 to describe the percentage of the total variation among included studies due to heterogeneity. The I 2 ranges from 0 to 100%, with 25%, 50%, and 75% considered low, medium, and high, respectively. High heterogeneity suggests the need for moderator analyses to explore the variability across studies (Borenstein et al., 2009). When heterogeneity was present, we computed subgroup analyses to explore whether treatment effects vary across various levels of moderator variables. That is, we sorted studies into subgroups based on various levels of moderator variables. We analyzed categorical variables using a meta-analytic analog of ANOVA and meta-regression for continuous outcomes. Because subgroup analyses cannot detect significant differences when the subgroups have small study numbers (Tanner-Smith & Grant, 2018), we interpreted our findings with caution.
Assessment of Methodological Quality
Methodological quality reflects the suitability of the methods used in design and conduct of studies that determine the reliability of the results (Jamshidi et al., 2018; Wang et al., 2021). Critical appraisal of methodological quality across primary studies is an important process for meta-analysis. Poor methodological quality can lead to exaggerations of the overall estimate of treatment effectiveness and inaccurate conclusions (Conn & Rantz, 2003). In addition, high-quality research methodology can provide confidence in the effect size. Study quality scales are commonly used to assess methodological quality. Unfortunately, quality scales have limitations. Quality scores contribute additional measurement error to meta-analysis because the validity of quality scales has seldom been studied empirically (Cooper et al., 2019). Thus, we evaluated methodological quality by using quality indicators empirically, as moderator variables (Conn & Rantz, 2003). Categorical quality indicators consisted of concealed allocation, blinded data collections, ITT, a priori power, type of assignment into groups, and comparison of participants’ characteristics across groups at baseline. One continuous quality indicator was attrition. In addition, we report the quality indicators in Supplemental Table 2.
Risk of Publication Bias
We used three methods for identifying publication bias, the funnel plot, Begg and Mazumdar’s test, and Egger’s bias value. A funnel plot should be symmetrical when there is no publication bias (Cooper et al., 2019). The Begg and Mazumdar test provides the rank correlation between the standardized effect sizes and their variances (Begg & Mazumdar, 1994; Gjerdevik & Heuch, 2014). Significant results suggest publication bias (Gjerdevik & Heuch, 2014). Egger’s regression test is used to estimate the asymmetry of data. A significant one-tailed p-value suggests publication bias (Cooper et al., 2019).
Results
The initial search resulted in 2,972 articles, and the hand-search resulted in four articles. After removing duplicate articles, we reviewed the titles and abstracts of 2,773 articles. We excluded 2,729 because they were not relevant to the topic or were not research. Of the remaining 44 studies, 21 studies (n = 21) were excluded because they were not written in English (n = 5), systematic reviews (n = 9), or meta-analyses (n = 3), or missing data and their authors did not respond to further inquiry (n = 4). Finally, 23 studies (N = 23) were included in this meta-analysis (see Figure 1). PRISMA diagram.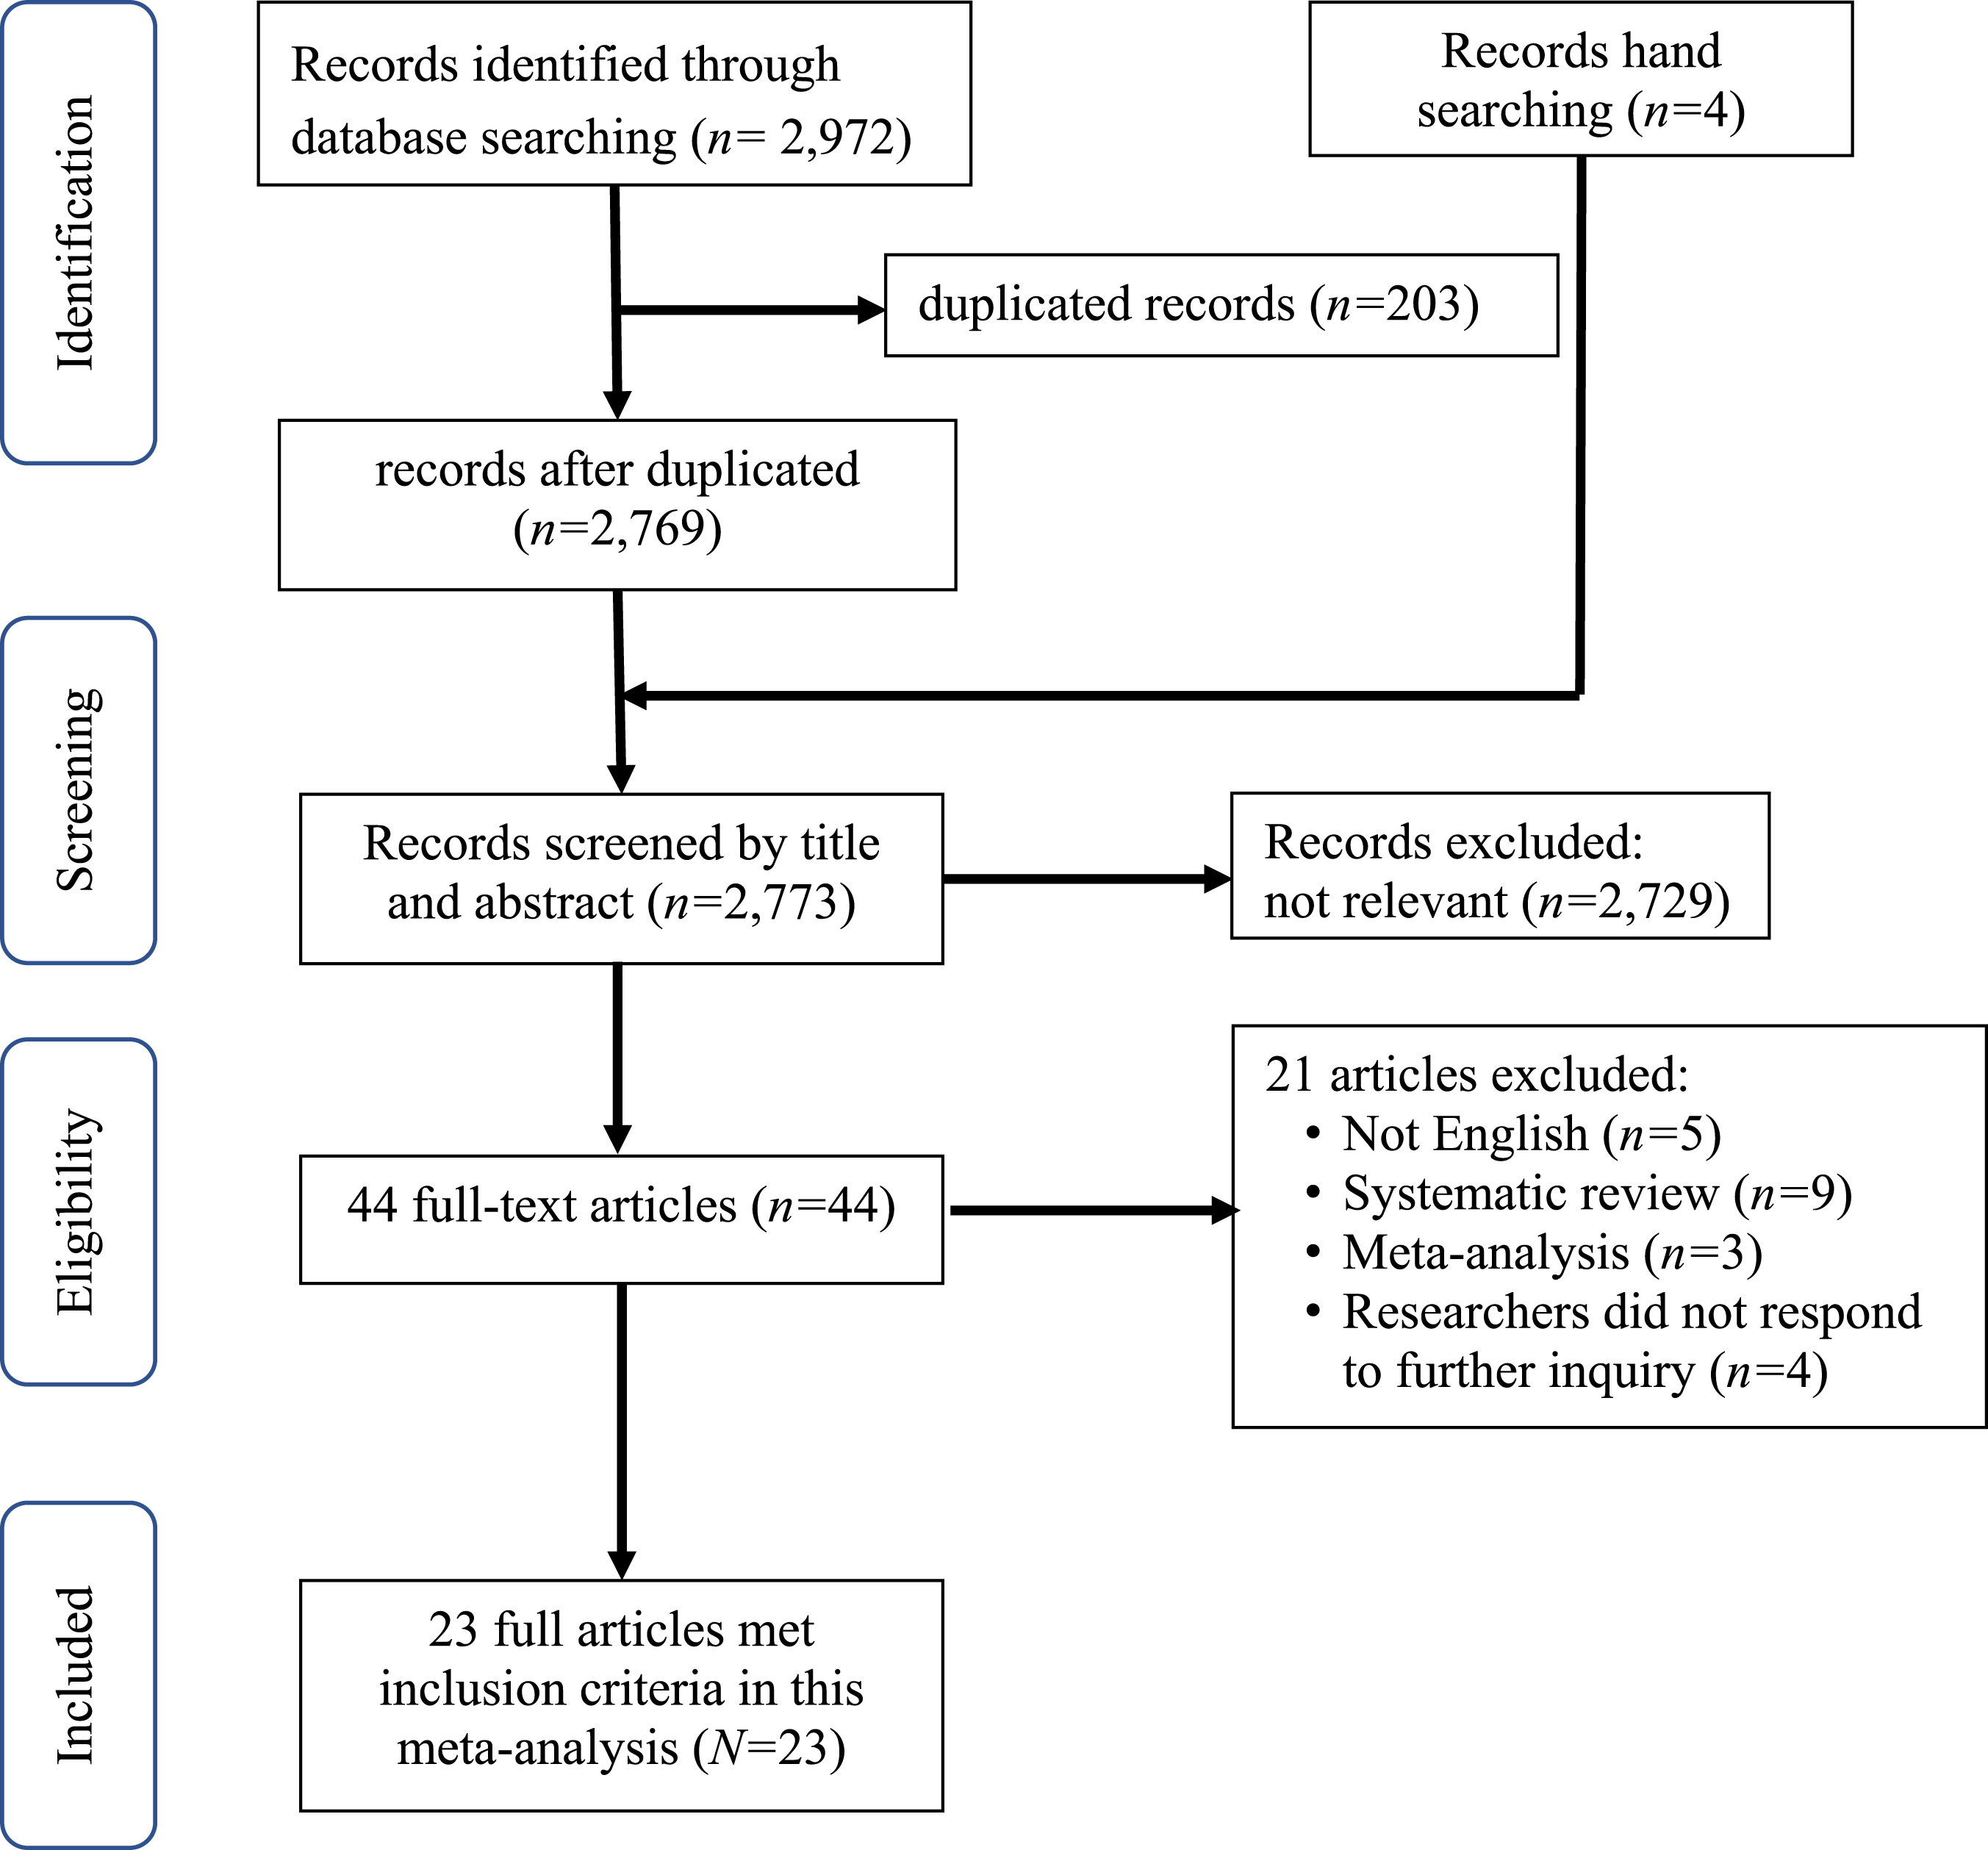
Characteristics of Included Studies
Characteristics of Included Studies (N = 23).

Notes. n = number of studies providing data, Min. = minimum, Q1 = first quartile, Mdn = median, Q3 = third quartile, SD = standard deviation, Max = maximum.
Intervention Characteristics
Numerous dance interventions were reported in a variety of types, including Chinese square dance (n = 4; Chang et al., 2021; Meng et al., 2020; Wang et al., 2020; Zhao et al., 2021), Ballroom dance (n = 3; Dominguez et al., 2018; Haboush et al., 2006; Vankova et al., 2014), Tango (n = 2; Hackney et al., 2015; Pinniger et al., 2013), dance for Parkinson’s disease (n = 2; Dahmen-Zimmer & Jansen, 2017; Kalyani et al., 2019), aerobic (n = 2; Fausto et al., 2022; Zhu et al., 2018), Latin (n = 1; Aguinaga, 2016), Argentine tango (n = 1; Rios Romenets et al., 2015), modern (n = 1; Hashimoto et al., 2015), Cha Cha (n = 1; *Kim et al., 2011), Sardinian folk (n = 1; Solla et al., 2019), Brazilian samba (n = 1; Tillmann et al., 2020), Turo (n = 1; Lee et al., 2018), K-Pop (n = 1; Lee et al., 2015), Choreographed dance (n = 1; Ventura et al., 2016), and Poco-Poco (n = 1; Adam et al., 2016). Dance interventions ranges from 21 to 329 days (M = 96.4), from 4 to 48 weeks (M = 14.6) with session durations between 30 and 90 minutes, one to five sessions per week (M = 2.2). Researchers tended to conduct the dance interventions in groups (n = 22) rather than individual interventions (n = 1). Participants who dropped out between baseline and final analysis ranged from 0 to 11% of dance participants and 0–25% of comparison participants.
Setting
Primary researchers provided dance interventions in various countries, including in the United States of America (n = 5; Aguinaga, 2016; Fausto et al., 2022; Haboush et al., 2006; Hackney et al., 2015; Ventura et al., 2016), China (n = 5; Chang et al., 2021; Meng et al., 2020; Wang et al., 2020; Zhao et al., 2021; Zhu et al., 2018), South Korea (n = 3; *Kim et al., 2011; Lee et al., 2015, 2018), Australia (n = 2; Kalyani et al., 2019; Pinniger et al., 2013), and one each in Japan (Hashimoto et al., 2015), Brazil (Tillmann et al., 2020), Germany (Dahmen-Zimmer & Jansen, 2017), the Philippines (Dominguez et al., 2018), Canada (Rios Romenets et al., 2015), Italy (Solla et al., 2019), the Czech Republic (Vankova et al., 2014), and Malaysia (Adam et al., 2016).
Outcome Measurement
Depression was measured with a variety of tools. Out of twenty three studies, ten teams used the Geriatric Depression Scale (GDS; Aguinaga, 2016; Chang et al., 2021; Dominguez et al., 2018; Haboush et al., 2006; Pinniger et al., 2013; Vankova et al., 2014; Ventura et al., 2016; Wang et al., 2020; Zhao et al., 2021; Zhu et al., 2018), seven used the Beck Depression Inventory (BDI; Fausto et al., 2022; Hackney et al., 2015; Lee et al., 2018; Lee et al., 2015; Rios Romenets et al., 2015; Solla et al., 2019; Tillmann et al., 2020), three study teams used the Hospital Anxiety and Depression Scale (HADS; Adam et al., 2016; Dahmen-Zimmer & Jansen, 2017; Kalyani et al., 2019), and one each used the Self-Rating Depression Scale (SDS; Hashimoto et al., 2015) and the Geriatric Depression Scale-Short Form (SGDS; *Kim et al., 2011) and the Center for Epidemiologic Studies on Depression scale (CES-D; Meng et al., 2020). The reliabilities of these tools were reported as ranging from .78 to .83. Researchers measured depressive symptoms at different times, ranging from immediately after completion of interventions to 366 days later.
Effect Size of Dance Interventions
Dance groups showed significantly lower depressive symptoms post-intervention than comparison groups (g = 0.66, 95% CI [0.42, 0.91]). Figure 2 depicts the forest plot. The squares show effect size estimates for each study. The size of the squares demonstrates the magnitude of the effects. The horizontal lines represent confidence intervals, or the precision of each study. Confidence intervals that do not cross the 0.0 vertical line (line of null effect) can be interpreted as statistically significant (Borenstein et al., 2021). Overall, dance groups showed lower depression than comparison groups in 19 of 23 primary studies. However, only 10 primary studies had significant effect sizes. The diamond shows the summary effect size across all studies. The width of the diamond reflects the confidence interval. Forest plot of the effects of dance interventions on depression compared to control groups.
As expected, single-group pre–post comparisons showed significant reduction in depressive symptoms for uncorrelated (ES = .62; 95% CI [.34, .90]; p < .001) and for correlated dance intervention groups (ES = .58; 95% CI [.34, .82], p < .001). To examine the possibility of spontaneous recovery, pre–post comparison/control groups showed no improvement in depressive symptoms for both the uncorrelated (ES = −.01; 95% CI [−.14, .13], p = .94) and correlated (ES = .06; 95% CI [−.07, .02], p = .400) analyses.
Moderator Analyses
Results of Categorical Moderators on Depression (Dance Versus Control Groups).
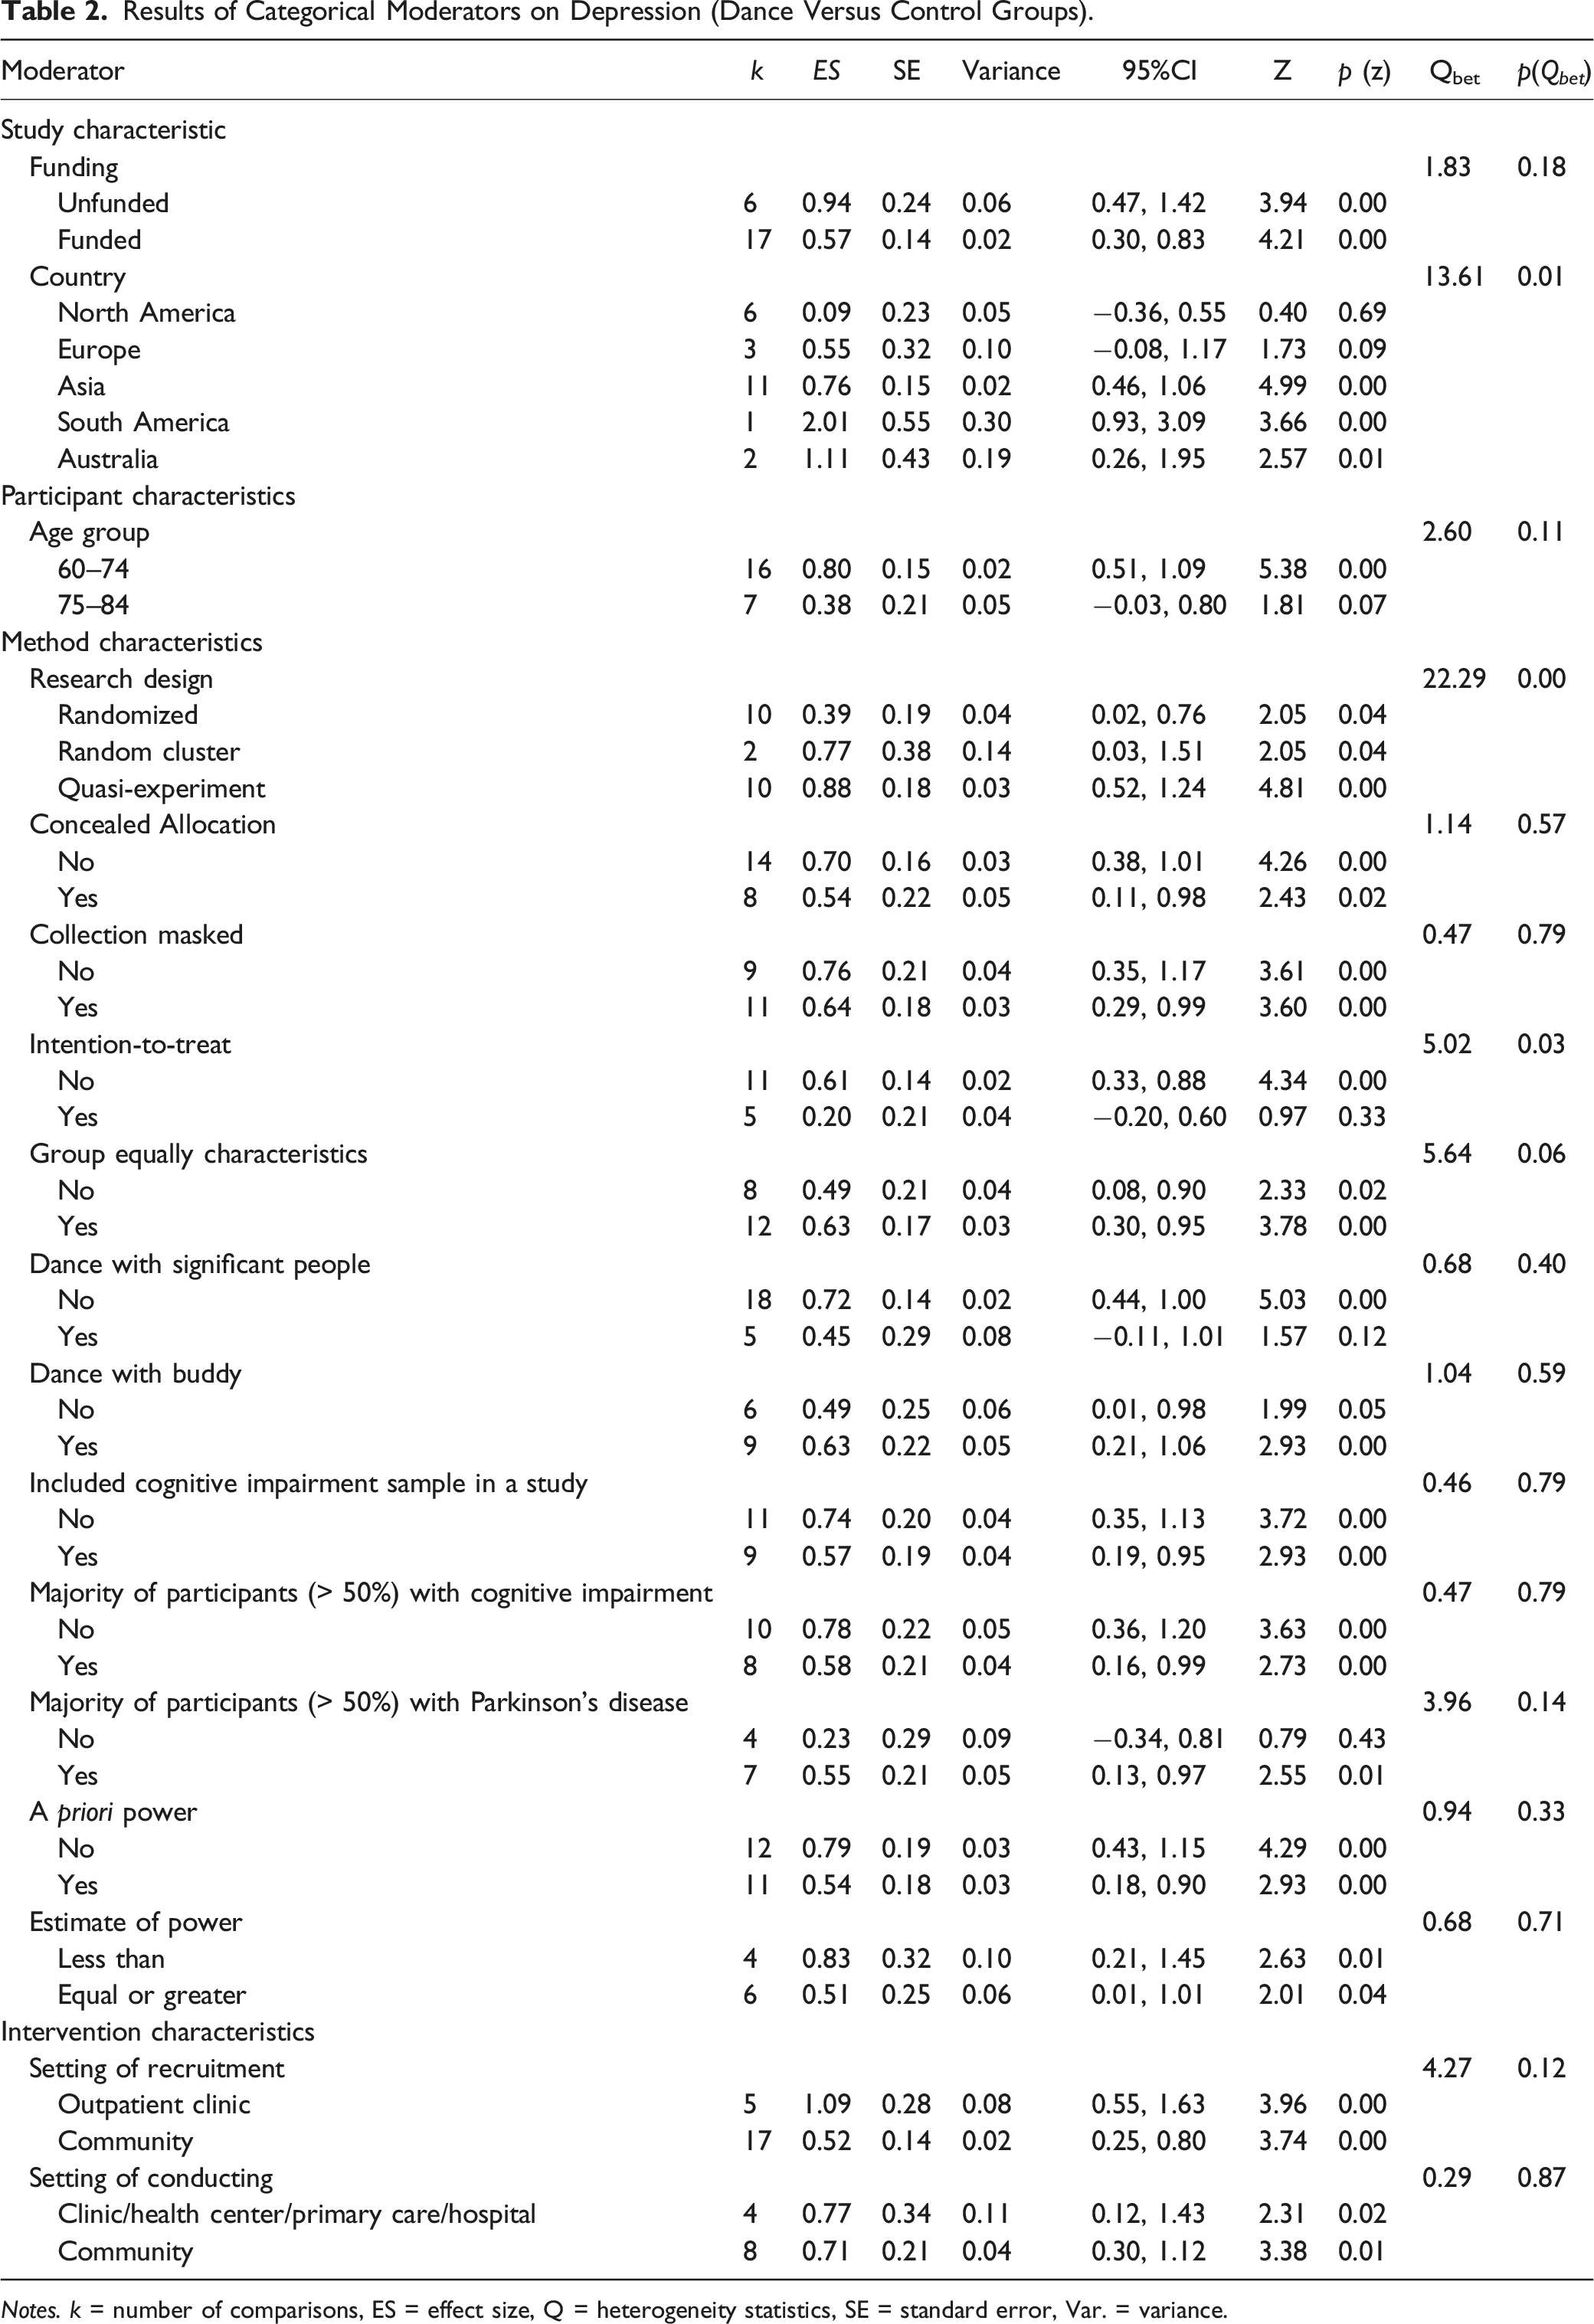
Notes. k = number of comparisons, ES = effect size, Q = heterogeneity statistics, SE = standard error, Var. = variance.
Results of Continuous Moderators on Depression (Dance Versus Control Groups).
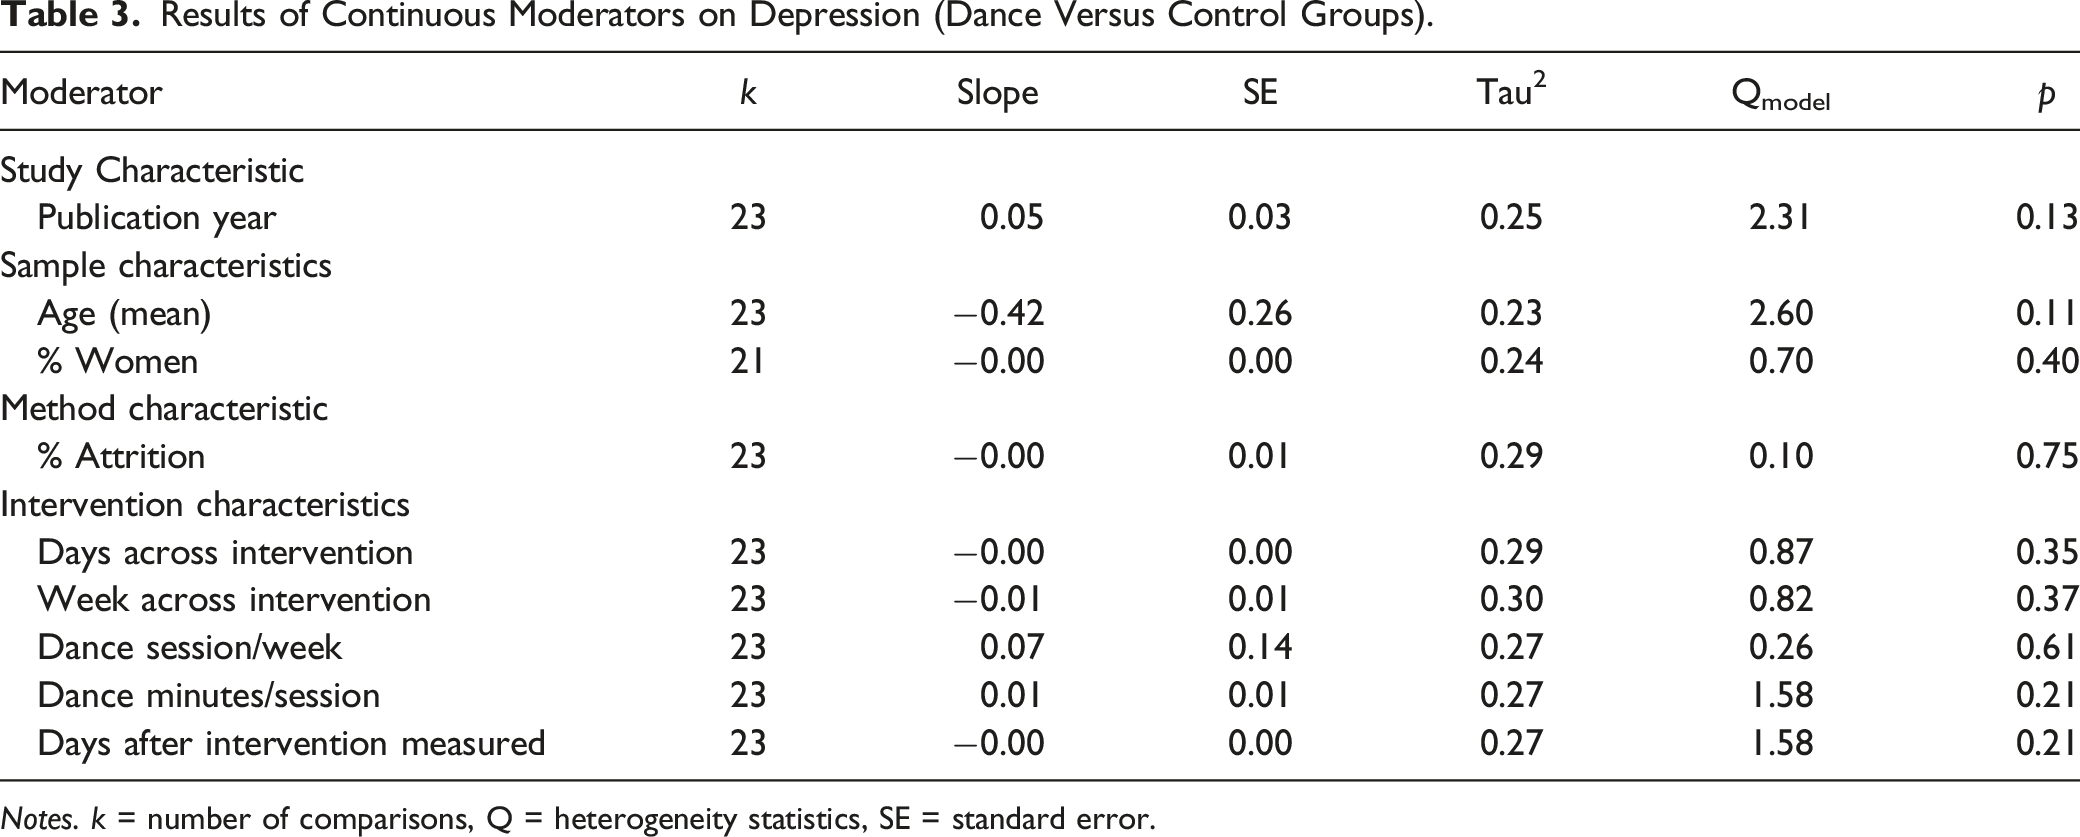
Notes. k = number of comparisons, Q = heterogeneity statistics, SE = standard error.
Regarding quality indicators, we found that researchers who used quasi-experimental designs showed higher effect sizes (ES = .88, n = 10) than researchers who used randomized controlled trial (RCT) method (ES = .39, n = 10) and randomized cluster designs (ES = .77, n = 2; Qbet = 22.29, df = 2, p = 0.00; see forest plot in Figure 3). We also found that researchers who did not use ITT showed significant effect size (ES = 0.61, n = 11) compared to researchers who used ITT (ES = 0.20, n = 5; Qbet = 5.02, df = 1, p = 0.03; see forest plot in Figure 4). No other moderator analyses resulted in significant differences. Unfortunately, we could not conduct subgroup analyses on the type of dance because primary researchers reported 15 different types of dance across the studies. This resulted in very small subgroups of primary studies, ranging from one to three studies, for each type. Few primary studies provide adequate power to detect statistical significance in subgroup analysis (Tanner-Smith & Grant, 2018) and we would have no confidence in the results. Forest plot of the effects of dance interventions on depression moderated by group assignment. Forest plot of the effects of dance interventions on depression moderated by intention-to-treat analysis.

Publication Bias
The funnel plot showed a fairly symmetrical shape which suggested no publication bias. The Begg and Mazumdar rank did not show a significant Kendall’s tau value (.197[p = .26]). Egger’s regression test of the intercept was 1.51 and was not significant (95% CI −0.86, 3.88, t = 1.32, df = 21, p = .2). All three methods suggested no publication bias; however, these findings should be interpreted with caution due to the relatively small number of included primary studies (N = 23).
Discussion
This is the first meta-analysis that specifically examined the effects of dance on depression in adults 60 years of age and older that included moderator analyses. We found that dance groups showed moderately less depressive symptoms than comparison groups across studies with an effect size of .66, and this finding was likely not because of spontaneous recovery. We found that the effect of dance interventions on depression in older adults with depression was higher (ES = 0.66) than other exercise interventions to include aerobic exercise (ES = −0.51) and resistance exercise (ES = −0.41; Miller et al., 2020). This finding is consistent with the results of Liu et al. (2021) and Wang et al. (2022) who also reported moderate findings. There are several possible explanations for these findings. First, because 22 of the 23 research teams conducted dance as a group intervention (n = 22), dance commonly provides opportunities for older adults to interact with others. This promotes social interaction, which is commonly lacking in older adults experiencing depressive symptoms (Elmer & Stadtfeld, 2020). In addition, participating in dance can expose older adults to new learning experiences, which can help reduce negative self-attitudes and improve self-esteem (Kiepe et al., 2012). Also, dance can promote enjoyment in older adults, which could be beneficial to depressed older adults (Marks, 2016).
Moderator Effects
Moderator analyses were used to explore the source of heterogeneity in a meta-analysis (Tanner-Smith & Grant, 2018). Dance interventions in older adults showed lower depressive symptoms than comparison groups in South America than in Australia, Asia, Europe, and North America. Because there were only 23 studies, we categorized countries into continents. We found that Brazil was the only country in South America. The most famous dance in South America is the Brazilian samba which is considered to be a performance to express cultural identity for Brazilians (Delabary et al., 2020). Samba has become a symbol of the Brazilian nation since the 19th century. Brazilian older adults might find enjoyment with this type of dance because samba dance is related to their traditional and cultural context (Serra et al., 2016). Integration of the cultural context into exercise programs for older adults may promote participation and adherence to the program (Eyigor et al., 2009). However, there was only one research team that conducted a dance intervention in Brazil, South America (Tillmann et al., 2020). And because a small number of included studies in subgroup analyses might overestimate the effect size (Tanner-Smith & Grant, 2018), this finding should be interpreted cautiously. Nonetheless, future researchers might evaluate the effects of dance on depressive symptoms in older adults in various cultural contexts.
Our moderator analyses showed that researchers who used quasi-experimental designs showed higher effect sizes than those who conducted randomized trials or randomized cluster designs. This finding would be expected because in quasi-experimental designs, people generally self-select their groups making the groups non-equivalent in some way. For example, people who select the dance group may be more motivated to dance. However, in real life, people self-select their activities. Thus, it is important to see the effect size differences between randomized and quasi-experimental designs. Note that the lower effect size for the randomized trials also showed significant improvement reflecting that even those who did not self-select their group showed some changes in their depressive symptoms.
Our findings revealed that researchers who did not use ITT showed higher effect sizes than those who used ITT analysis. ITT is an analysis technique where all participants are retained in the analysis according to their initial group assignment (McCoy, 2017). ITT disregards non-compliance, protocol violation, withdrawal, and anything that occurs post-randomization (Gupta, 2011). That is, dropouts who stop receiving the intervention are included in the final analyses which naturally reduces the effects of dance compared to those who completed the dance intervention. However, maintaining the entire sample size at the final analysis reduces potential bias due to attrition which may be due to participants’ response to treatment (Gupta, 2011). ITT allows researchers to correctly identify conclusions regarding program effectiveness (López- Espinoza et al., 2021) but tells us little about efficacy when participants get the standardized and full intervention (Shadish et al., 2002).
Strength and Limitations
A strength of this meta-analysis is that we focused on the effects of dance on depressive symptoms in adults 60 years old and older specifically and explored moderator effects. No prior meta-analysis researchers have examined the effects of dance interventions on depressive symptoms specifically in older adults. Thus, to our knowledge, this meta-analysis is the first on this topic. Another strength is our analyses of the quality indicators in our moderator analyses. For example, this allowed us to examine the difference between randomized and non-randomized (more real world) designs. In addition, comparing studies where researchers analyzed only participants who completed the intervention (ITT not used) to studies where the researchers included all participants as they were randomized at baseline (ITT used) is a strength. Researchers provided estimates of efficacy when they analyzed data from participants who completed the study and received the full implementation of the intervention (did not use ITT). Researchers provided estimates of effectiveness in the real world when they analyzed data from participants who received less than full standardization of the intervention (used ITT). This latter analysis is most useful for policy makers (Shadish et al., 2002).
A major limitation of this study is that we focused on primary studies only written in English which may result in a language bias (Haidich, 2010). Thus, the findings may not represent the effects of dance interventions on depression in older adults worldwide. In addition, we conducted this meta-analysis using the key search terms depression, dance, and older adults. We may have missed primary studies that used other terms such as aging, older person, mood disorders, or sad. However, we believe that the terms aged and older adult would have captured most of those studies using aging and older person. And if depression was not reported separately in studies on mood disorder and sadness, they would have been excluded anyway. Future meta-analysts might use expanded search terms. Another limitation is that all researchers conducted dance interventions in older adults with non-clinical depression (N = 23). Therefore, the findings cannot be generalized to older adult with major depressive disorder. Non-clinical depression is different from major depressive disorder based on eight parameters: severity and distress, duration and persistence, clinical symptoms and signs, course of illness characteristics, dysfunction or impairment, depression-related at-risk behaviors and consequences, clinical significance, and help-seeking behaviors (Parker & Paterson, 2015). Future researchers might explore the effects of dance in older adults with major depressive disorder. Finally, one limitation is the use of diverse depression measures across the studies which was so varied moderator analysis was inappropriate for subgroups with such low numbers of primary studies. However, to address this diversity, we standardized the metrics which allowed computation of the effect size across studies.
Implications
Our results can be informative in planning evidence-based dance interventions, especially for older adults with non-clinical depression. Nurses and other healthcare providers might encourage consistent dance as an alternative or adjunctive therapy for depressed older adults. They might encourage regular dance in primary healthcare centers for older adults who are at risk to prevent depression. Moreover, they should consider using dance interventions that are adapted to their particular culture to promote adherence and improve depression. Additionally, healthcare providers could ask older adults about their personal dance music preference (perhaps familiar to them from their younger years). This may also promote enjoyment and maintenance of participation. Future researchers might explore the effects of types of dance on depression, dance interventions for older adults diagnosed with major depression, and dose of dance that most effectively reduces depression. Additionally, researchers might examine the long-term effectiveness of dance interventions on depressive symptoms in older adults.
Conclusion
In conclusion, we examined and meta-analyzed the effects of dance interventions on depression in adults who were 60 years of age and older and the moderating effects of participant, methods, and intervention characteristics. We found that dance groups reported significantly lower depressive symptoms than comparison groups in non-clinically depressed older adults. Country was the moderator that influenced the effect of dance on depression. Healthcare providers and researchers might tailor dance interventions to culture and era, matching older adults personal dance experiences, to promote adherence and enjoyment.
Supplemental Material
Supplemental Material - The Effects of Dance Interventions on Depression in Older Adults: A Meta-Analysis
Supplemental Material for The Effects of Dance Interventions on Depression in Older Adults: A Meta-Analysis by Tanapa Rittiwong, Chuntana Reangsing, and Joanne Kraenzle Schneider in Journal of Applied Gerontology
Footnotes
Acknowledgments
This study was performed as part of the first author’s doctoral dissertation at Trudy Busch Valentine School of Nursing, Saint Louis University. We would like to express sincere gratitude to Drs. Jean Krampe and Devita Stallings for their guidance on prior versions of this manuscript. Moreover, we thank Mary Krieger for her guidance with the systematic search.
Author Contributions
All three authors were responsible for acquisition, interpretation, and drafting the article. The first and second authors substantially contributed to the data extraction and coding, data analysis, and critically revised the work for important intellectual content. The first and last authors were included in the identification, selection, article drafting, and critically revised the work. All authors provided final approval of the version to be published and agree to be accountable for all aspects of the work.
Declaration of Conflicting Interests
The author(s) declared no potential conflicts of interest with respect to the research, authorship, and/or publication of this article.
Funding
The author(s) received no financial support for the research, authorship, and/or publication of this article: The preparation and publication of this study were unfunded.
Ethical Approval
A meta-analysis was not subject to ethical review.
Supplemental Material
Supplemental material for this article is available online.
References
Supplementary Material
Please find the following supplemental material available below.
For Open Access articles published under a Creative Commons License, all supplemental material carries the same license as the article it is associated with.
For non-Open Access articles published, all supplemental material carries a non-exclusive license, and permission requests for re-use of supplemental material or any part of supplemental material shall be sent directly to the copyright owner as specified in the copyright notice associated with the article.