




Abstract
Data from the 2008 panel of the Survey of Income and Program Participation is used to investigate fear of crime and satisfaction with police services among adults with and without disabilities in metropolitan and nonmetropolitan areas in the United States, controlling for individual-level characteristics. Persons with disabilities feel less safe, are more likely to exhibit protective behaviors due to safety concerns, and are less satisfied with police services than persons without disabilities. Multivariate results suggest that persons with a disability who live in nonmetropolitan areas have fewer concerns around personal safety but are generally less satisfied with local police services than persons with disabilities who live in metropolitan areas. Policy implications and future research directions are discussed.
Keywords
Introduction
In the United States, persons with disabilities experience lower levels of well-being than persons without disabilities. Differences in well-being have been documented across multiple domains, demonstrating that persons with disabilities face higher levels of economic and social disadvantage than other persons in the United States (Brucker, Mitra, Chaitoo, & Mauro, 2015; Fujiura, Rutkowski-Kmitta, & Owen, 2010). Fear of crime is an important dimension of well-being (Carle, Bauman, & Short, 2009; Lorenc et al., 2012; Stiglitz, Sen, & Fitoussi, 2009) yet has received little attention within the disability research community. Comprehensive research on disparities in fear of crime, personal protective behaviors, and satisfaction with police between persons with and without disabilities is needed to guide the coordination of public safety resource allocation and service delivery that is necessary to improve the integration of persons with disabilities in economic and social settings. Information on perceptions and behaviors related to safety can also uncover possible barriers that persons with disabilities face in accessing the local services and supports that can increase independence. After reviewing relevant literature, the analysis described subsequently will provide new evidence of disparities in perceptions and behaviors related to fear of crime and satisfaction with police services between adults with and without disabilities in the United States.
Literature Review
Estimates of the prevalence of disability in the United States vary by differences in measurement. Historically, measurements of disability hinged on an inability to work. More recent conceptualizations have taken a broader view of disability, where “disability” can be understood as a condition that results from the interaction between an individual-level impairment, activity limitation, or participation restriction with personal and environmental factors (Palmer & Harley, 2012; World Health Organization, 2002). A set of six questions adopted across federally administered household surveys attempts to mirror this more expansive view by collecting information on sensory (hearing and vision), functional (ambulatory and cognitive), and activity (independent living and self-care) limitations. Based on this definition, nearly 40 million people, or 13% of the U.S. noninstitutionalized population, are living with disabilities (Houtenville, Brucker, & Lauer, 2014). Impairments may include ambulatory, cognitive, psychiatric, and sensory limitations. The prevalence of disability varies by individual characteristics, with older adults, females, blacks, and Hispanics generally having higher rates of disability than their comparison groups (Brault, 2012). Geography is associated with the prevalence of disability as well, with higher rates of disability found in nonmetropolitan areas of the country (Seekins & Greiman, 2014).
Persons with disabilities face higher levels of disadvantage than persons without disabilities, along a number of dimensions. Working-age persons with disabilities have lower educational attainment (Sevak, Houtenville, Brucker, & O’Neill, 2014), are less likely to be employed (Kessler Foundation, 2014), and subsequently are more likely to be poor than persons without disabilities (Brucker et al., 2015; She & Livermore, 2007). Housing conditions are worse for persons with disabilities (Hoffman & Livermore, 2012), and persons with disabilities face high levels of food insecurity (Coleman-Jensen & Nord, 2013). Levels of political participation and social capital are lower for persons with disabilities as well (Brucker, 2015; Schur, Shields, Kruse, & Schriner, 2002). This article explores a possible additional area of disadvantage for persons with disabilities—fear of crime.
Given the generally high level of disadvantage found among persons with disabilities, advocates, policy makers, and service providers must continue to gather information that can be used to facilitate the efficient allocation of resources to address the needs of this population. Focusing on the local environment may be one place to begin. Drawing from the definition of disability mentioned at the outset of this article, the environment is a critical component of disability. Place matters in terms of the ability to access employment opportunities and needed services and supports. Living in a rural environment, for example, can create particular challenges for persons with disabilities. In addition to disability being more prevalent in rural areas of the country, persons with disabilities who live in rural areas face more barriers to receiving adequate health care (Iezzoni, Killeen, & O’Day, 2006), transportation (National Council on Disability, 2005), and vocational (Johnstone et al., 2003) services than persons without disabilities.
While residing in more urban areas may alleviate some of these barriers, different issues may arise. For the general population, concerns with neighborhood safety arise more frequently in urban areas, influencing both economic and health outcomes. Neighborhoods with high crime rates or a reputation for being dangerous have more difficulty attracting businesses that can provide adequate job opportunities, material resources, and services (Clark et al., 2009). In addition, a lack of perceived neighborhood safety can constrain health-promoting behaviors such as walking while also increasing negative coping behaviors such as smoking or alcohol use (CDC, 1999; Fish, Ettner, Ang, & Brown, 2010; King, 2008; Ross, 1993; Sallis, Bauman, & Pratt, 1998). Fear of crime may therefore reduce the ability of persons with disabilities to access employment opportunities and services while increasing problematic health behaviors.
Several theoretical models of fear of crime exist (Hale, 1996; Franklin, Franklin, & Fearn, 2008). The disorder model explains fear of crime as a reaction to levels of social and physical incivility present in neighborhoods (LaGrange, Ferraro, & Supancic, 1992; Skogan, 1990). The social integration model, adopting a social capital approach, suggests that persons who are well integrated within their neighborhoods experience less fear of crime (Kanan & Pruitt, 2003). The vulnerability model proposes that persons who feel vulnerable economically, physically, or socially experience higher levels of fear of crime, regardless of prior victimization (Hale, 1996; McGarrell, Giocomazzi, & Thurman, 1997; Vieno, Roccoto, & Russo, 2013). This model may be most relevant for understanding fear of crime among persons with disabilities, given the broad range of economic, political, and social disadvantages described earlier.
Existing research on neighborhood safety for persons with disabilities has been relatively limited in scope to date. Some research has examined the effect of perceived safety on the prevalence of disability (White et al., 2010) or has provided limited descriptive statistics on perceptions and behaviors related to safety (Seibens, 2013). On a national level, persons with disabilities have been found to be victims of violent crime at rates twice as high as rates for persons without disabilities (28 victimizations per 1,000 persons with disabilities compared to 15 victimizations per 1,000 persons without disabilities; Harrell, 2011). This increased exposure to crime can lead to an increased fear of crime, reducing feelings of neighborhood safety (Ferraro & LaGrange, 1987; Skogan & Maxfield, 1982).
Additional research on fear of crime has narrowly focused on one particular type of disability and/or one particular geographic area. Higher levels of neighborhood safety, for example, have been linked to recovery from mobility limitations, even when controlling for sociodemographic characteristics and health risk factors (Latham & Clarke, 2013). Persons with serious mental illness have higher rates of crime victimization than their counterparts (e.g., Teplin, McClelland, Abram, & Weiner, 2005, for the Chicago area) and are more likely to live in neighborhoods with higher levels of physical and structural inadequacy and crime (e.g., Byrne et al., 2013, for the City of Philadelphia). To expand this more focused research to a national scale, the first hypothesis to be tested in the analysis that follows is: Compared to persons without disabilities, persons with disabilities feel less safe in their neighborhoods, holding all other variables constant.
People can adopt different protective behaviors in response to perceptions of safety. First, individuals may avoid certain situations and locations to minimize perceived risks. Avoiding certain areas of a neighborhood or limiting outings to only certain hours of the day due to safety concerns are adaptive behaviors that may occur. Second, individuals may take concrete steps to increase their sense of personal security (Skogan & Maxfield, 1982). Groups that have fewer financial resources are more likely to live in neighborhoods that have concentrated deprivation yet are less able to allocate resources toward protection (Covington & Taylor, 1991; Hale, 1996). One way to protect residents from the negative effects of fear and crime may be foster integration into social networks (De Jesus, Puleo, Sheton, & Emmons, 2010; Hale, 1996; Riger, LeBailly, & Gordon, 1981). However, persons who are fearful of crime might constrain their behavior, limiting social contact and increasing social isolation (Ross, 1993). As prior research has established that persons with disabilities have lower levels of social capital than persons without disabilities (Brucker, 2014), this would appear to be an area of vulnerability for persons with disabilities. Given the above-cited literature, we can next hypothesize that persons with disabilities will exhibit more protective behaviors related to personal safety than persons without disabilities, holding all other variables constant.
Police services obviously play a role in ensuring citizen safety. From a citizen standpoint, satisfaction with police can be explained by a variety of factors including personal contacts with officers, neighborhood crime conditions, and policing practices (Reisig & Parks, 2002; Weitzer & Tuch, 2005). Cognitive processes can influence satisfaction with public service delivery as well (Morgeson, 2013; Van Ryzin, 2013). In examining satisfaction with police services, Roch and Poister (2006) found that satisfaction was significantly higher when perceived performance exceeded expectations and was significantly lower when it did not, even when controlling for more objective measures of performance. Perceiving that police are involved in their community can improve levels of overall satisfaction with police but does not necessarily translate into a reduced fear of crime (Scheider, Rowell, & Bezdikian, 2003).
The ability of law enforcement agencies to address the diverse needs of persons with disabilities likely factors into satisfaction as well. Unfortunately, a survey of 133 law enforcement departments in the United States found that most departments did not have protocols for providing accommodations to persons with disabilities or for recording disability and accommodation information. Both service and community-based barriers were indicated, resulting in recommendations for increases in disability awareness training to law enforcement and changes to policies including asking all victims if they need accommodations and support (Oschwald, Curry, Hughes, Arthur, & Powers, 2011). Whether or not these organizational limitations influence satisfaction with police for persons with disabilities is unclear. Personal perceptions of the role of police may come into play as well. The third hypothesis to be tested here provides a general sense for levels of satisfaction with police: Persons with disabilities are less satisfied with police services than persons without disabilities, holding all other variables constant.
Persons with disabilities are a target population of interest within the field of public policy, as a substantial and growing share of federal and state resources is devoted to supporting the education, income support, medical, rehabilitation, and training needs of this population (Livermore, Stapleton, & O’Toole, 2011). Feeling unsafe when navigating the local environment can compromise the ability to access necessary services and supports. The analysis that follows will add to the broader literature on neighborhood satisfaction by exploring disparities in perceived neighborhood safety, personal protection behaviors, and satisfaction with police services, between adults with and without disabilities. Each of the three hypotheses highlighted earlier will be tested in a general sense, with disability as the focal variable. In addition, each hypothesis will be tested with a focus on discerning whether being nonpoor or living in a nonmetropolitan area influences the outcomes of interest for persons with and without disabilities. Such information can be used by advocates, policy makers, and service providers to increase the integration of persons with disabilities in our communities.
Method
Data and Measures
Data from the Survey of Income and Program Participation (SIPP) is used to examine disparities in fear of crime and satisfaction with police services for adults with and without disabilities. The SIPP is a longitudinal survey that is administered to a nationally representative sample of U.S. households by the Census Bureau. Households participate in the survey for approximately 4 years, with each new set of households considered a new panel. The 2008 panel, which is used for this study, is nationally representative and includes approximately 32,000 households. Data from Wave 6, administered during 2010, includes the key variables of interest (U.S. Census, 2014a). The data were restricted to include adults, persons aged 18 and over.
Demographic variables, including age, educational attainment, ethnicity, gender, marital status, metropolitan status, poverty, and race, are included. Age was included as a continuous variable. Educational attainment, ethnicity, gender, poverty, race, marital status, and metropolitan status were dichotomized, with values of 1 indicating conditions the literature suggests are inversely associated with safety concerns. Educational attainment of a high school degree or higher, non-Hispanic, male, nonpoor, married, nonmetropolitan location, and White were therefore coded as one, with values of zero indicating the opposite condition.
To measure poverty, poverty ratios were calculated as total household income over household poverty thresholds, multiplied by 100. Households above the poverty line were coded with a value of one. Households in official poverty, deemed as those at 100% or lower of the official poverty measure, were given a value of zero. Where the income to needs ratio was less than zero, cases were recoded as missing, as such households or families might or might not have resources other than income to provide financial security.
In Census data collection efforts, the term “metropolitan” is defined as a “core area with a large population nucleus, plus adjacent communities having a high degree of economic and social integration with that care.” A metropolitan area must include an urban area with a population of at least 50,000 (Census, 2014b). Nonmetropolitan areas were coded with a value of one and metropolitan areas were coded as zero.
For this study, disability was measured using six sensory, functional, and activity limitation questions that are the basis for U.S. Census and U.S. Bureau of Labor Statistics reports about disability and that are used across federal household surveys to measure disability. These questions are listed in Table 1. Persons answering in the affirmative to any of these questions were considered to have a disability.1
Disability Questions Used in the Survey of Income and Program Participation.

The SIPP includes a series of questions that can be used to assess fear of crime, although the questions were not designed to provide a specific index or scale (Bauman, 2002; Carle et al., 2009). Research has suggested that fear of crime is a difficult construct to measure, but that attempts to measure such fear should at a minimum include three separate components: perceived threat of individual victimization, assessment of neighborhood crime problems, and self-reports of behavioral adaptation in response to the possibility of victimization (Baumer & Rosenbaum, 1980; Ferraro & LaGrange, 1987). Given that much of the existing research in this area relies on the use of just one question (Kanan & Pruitt, 2003), the inclusion of multiple questions addressing each of these three domains in the SIPP is a benefit of this data source. Including each question as a separate variable allows for a more nuanced analysis and follows the approach used by others who have conducted analyses of the related SIPP measures (Siebens, 2011). The specific questions used to measure perceptions and behaviors, along with satisfaction with police services, are included in Table 2.
Relevant Survey Questions.
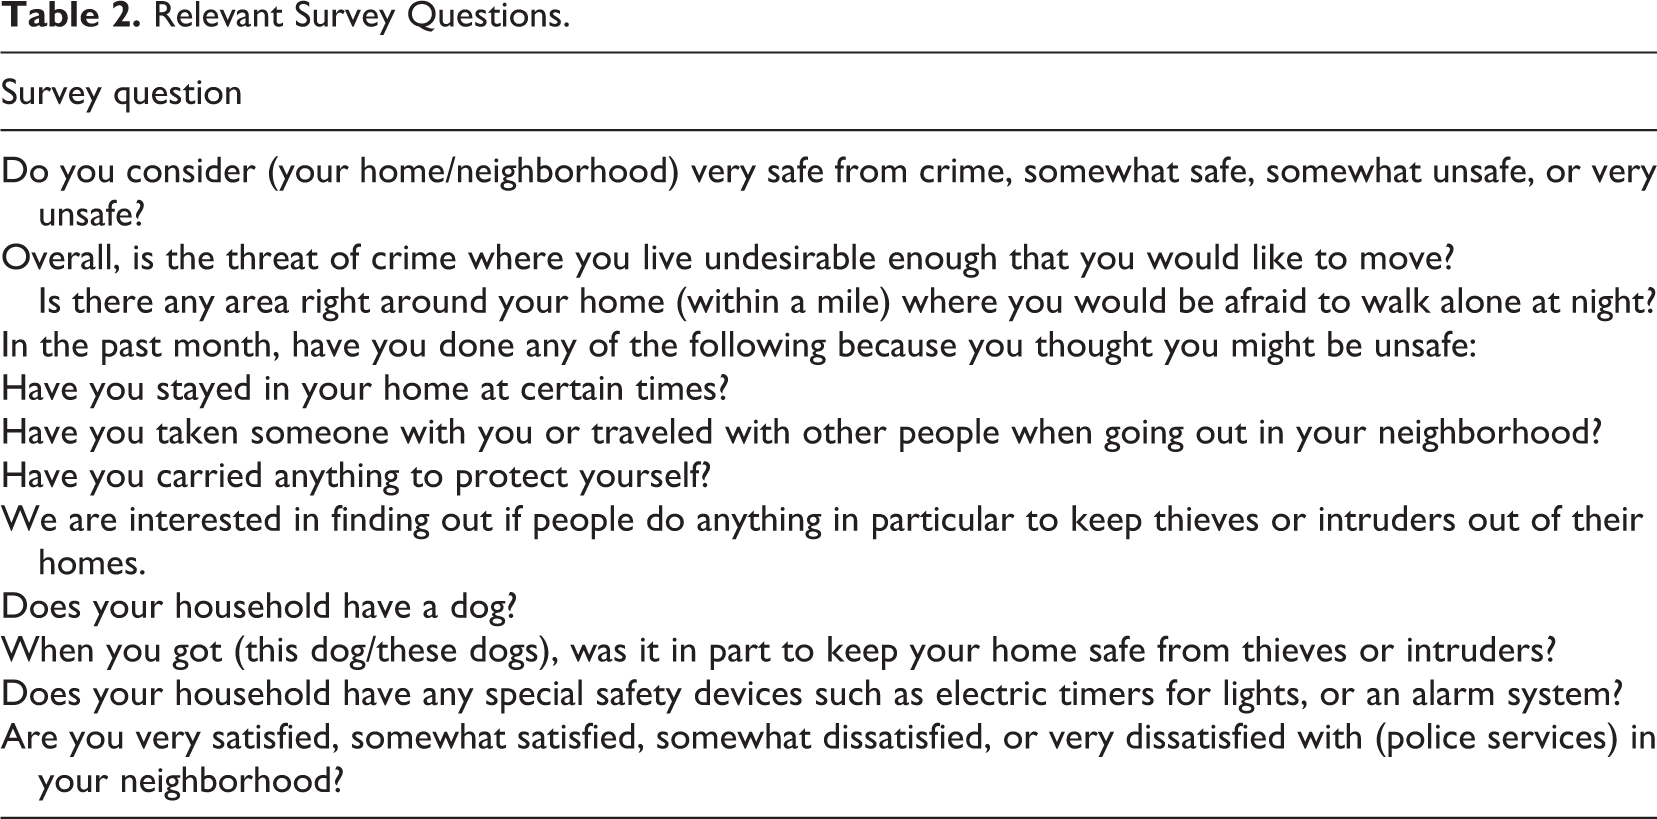
Most of the dependent variables were measured in a binary fashion using clear “yes/no” responses. Dependent variables that gathered information on a 4-point Likert-type scale were dichotomized to ensure adequate cell sizes for the analysis and to improve the ability to interpret results in a manner that would be useful to policy makers. The variables related to perception of safety were recoded into binary variables, with responses of very unsafe or somewhat unsafe coded as one and other values coded as zero. The variables related to protective behavior due to feeling unsafe were coded as a binary variable with values of one for yes and zero for no. The variable related to owning a dog for safety was coded as one for having a dog to keep the home safe and coded as zero if either the person did not own a dog or did not have a dog for the purpose of keeping the home safe.
The measurement of satisfaction with police was only measured through one question, a limitation that other research has cautioned against as multiple factors can influence satisfaction with police (Reisig & Parks, 2002). However, the inclusion of this question in conjunction with the other available fear of crime variables is a benefit of this particular data set. Satisfaction with police was recoded into a value of one for those who were very or somewhat dissatisfied, zero for those who were somewhat or very satisfied, and missing for those who hadn’t lived in an area long enough to have an opinion.
Analytical Approach
Stata/SE 12.1 was used to conduct all analyses. Given that the SIPP has a complex sample design, Stata’s svyset function was used to weight the data and adjust for the stratified sample design of the SIPP, following guidance from Shaefer (2013). As the use of unweighted data is discouraged by the Census as it can provide biased results (U.S. Census, 2008), data were weighted using individual-level person weights (wpfinwgt). Standard errors were adjusted for the geographically stratified sample frame of the SIPP and for the clustering of individuals within sampled households. (ghlfsam is the “half sample code” and gvarstr is the “variance stratum code”). For the multivariate analyses, logistic regressions were first conducted using the full sample of adults. Dissatisfaction with police and each of the fear of crime variables were included as dependent variables in a series of separate regressions. For all of the analyses conducted on the full sample, disability was the focal independent variable, and control variables were included for age, male, high school education or greater, White, nonpoor, married, non-Hispanic, and nonmetropolitan status. For the fear of crime regressions, an additional control variable of dissatisfaction with police was also included.
Odds ratios (ORs), confidence intervals, and significance levels are reported for each independent variable. Effects are discussed in terms of ORs, with ORs of 1.44 or lower designated as small effects, ORs between 1.45 and 4.24 designated as medium effects, and ORs of 4.26 or higher as large effects (Nandy, 2012; Peng, Lee, & Ingersoll, 2002).
Next, a series of similar regressions were run on two subsets of data: adults who had a disability and adults who did not have a disability, using the same dependent and independent variables. The focal variables for these sets of regressions, however, were the nonpoor and nonmetropolitan status variables.
Results
Descriptive Results
Table 3 shows demographic characteristics of adults with and without disabilities. A significantly greater proportion of persons with disabilities are older than persons without disabilities. Adults with disabilities have lower educational attainment, are less likely to be married, and are less likely to be Hispanic. Persons with disabilities are more likely to be non-White, more likely to live in households that are in poverty, and are less likely to live in metropolitan areas.
Demographics, Adults by Disability Status.
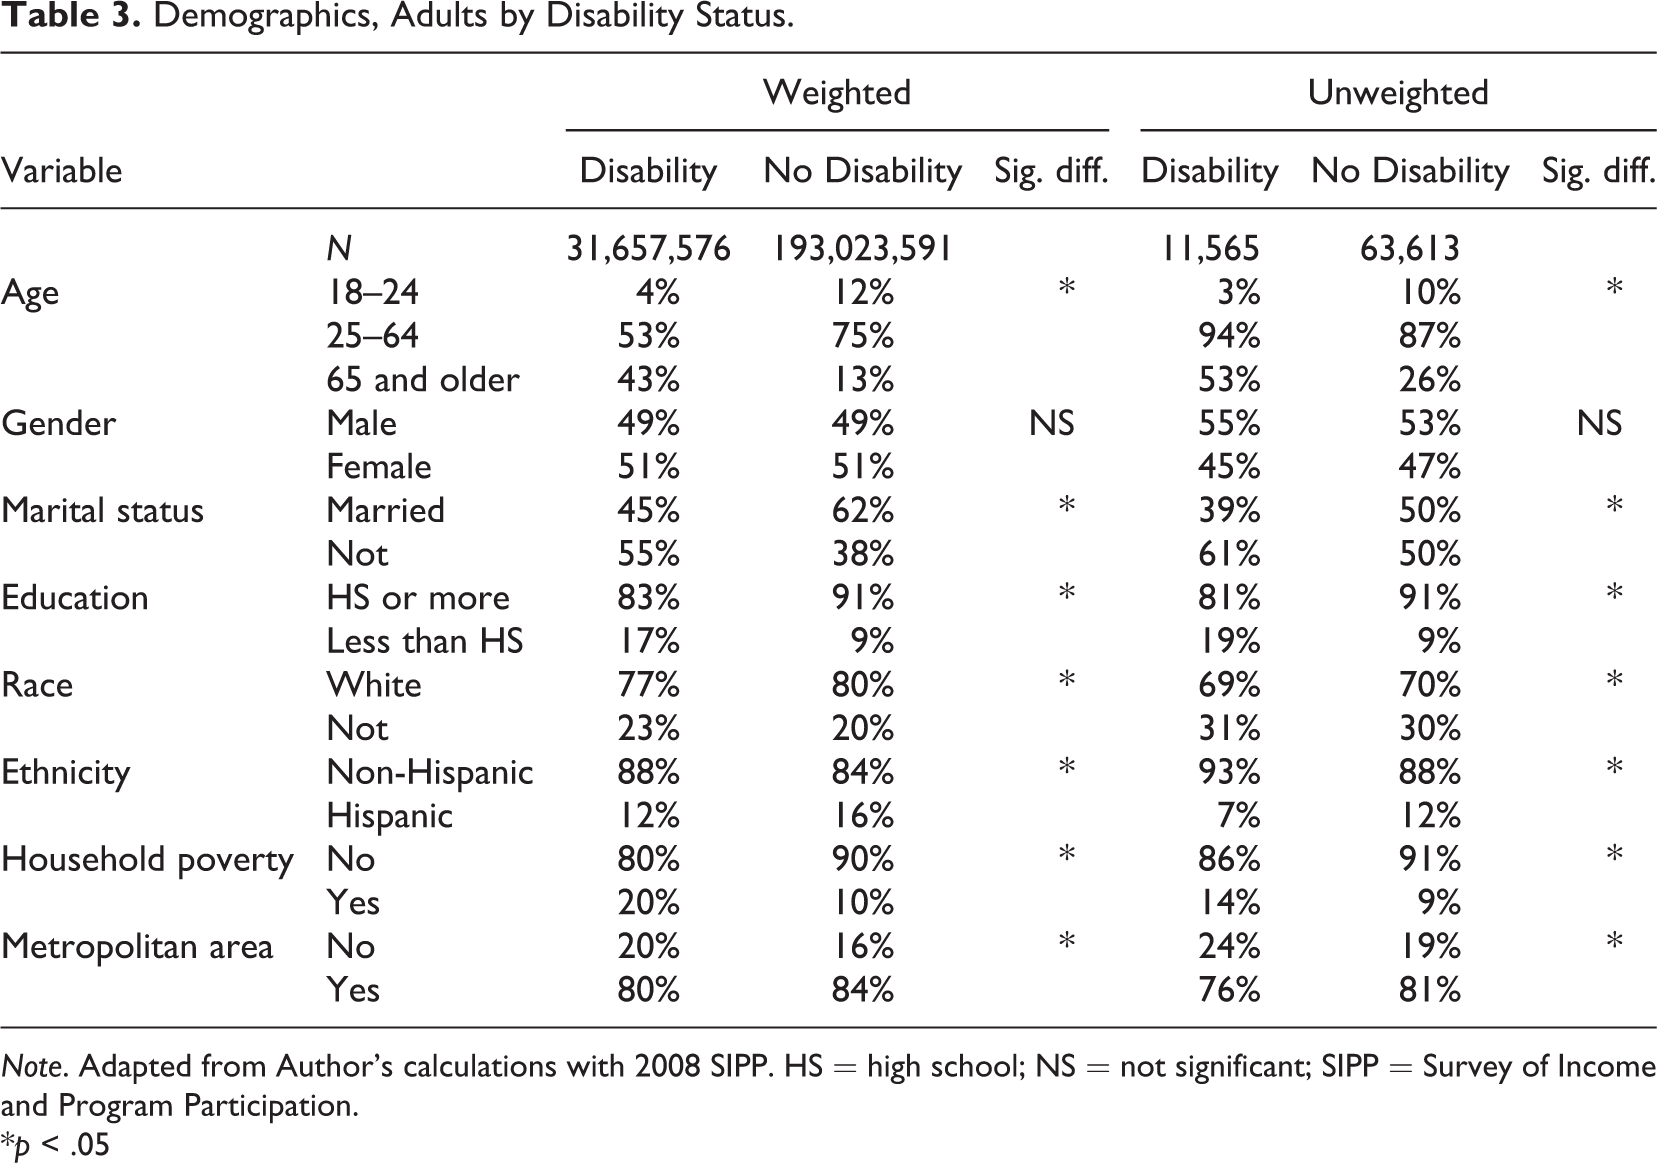
Note. Adapted from Author’s calculations with 2008 SIPP. HS = high school; NS = not significant; SIPP = Survey of Income and Program Participation.
*p < .05
Descriptive results related to neighborhood safety are included in Table 4, providing preliminary information to address our research questions. Overall, people were more likely to think that their homes were safe than they were to think that their neighborhoods were safe. On all measures, however, adults with disabilities were significantly more likely to report concerns or protective behaviors related to safety. Twenty-seven percent of persons with disabilities and 19% of persons without disabilities were afraid to walk alone at night (p < .05). Persons with disabilities were also more likely to stay in their homes at certain times, to take someone with them when they left the house, or to carry something with them due to safety concerns. Seven percent of persons with disabilities and 5% of persons without disabilities were dissatisfied with police services (p < .05).
Perceptions and Behaviors Related to Neighborhood Safety, Adults by Disability Status.
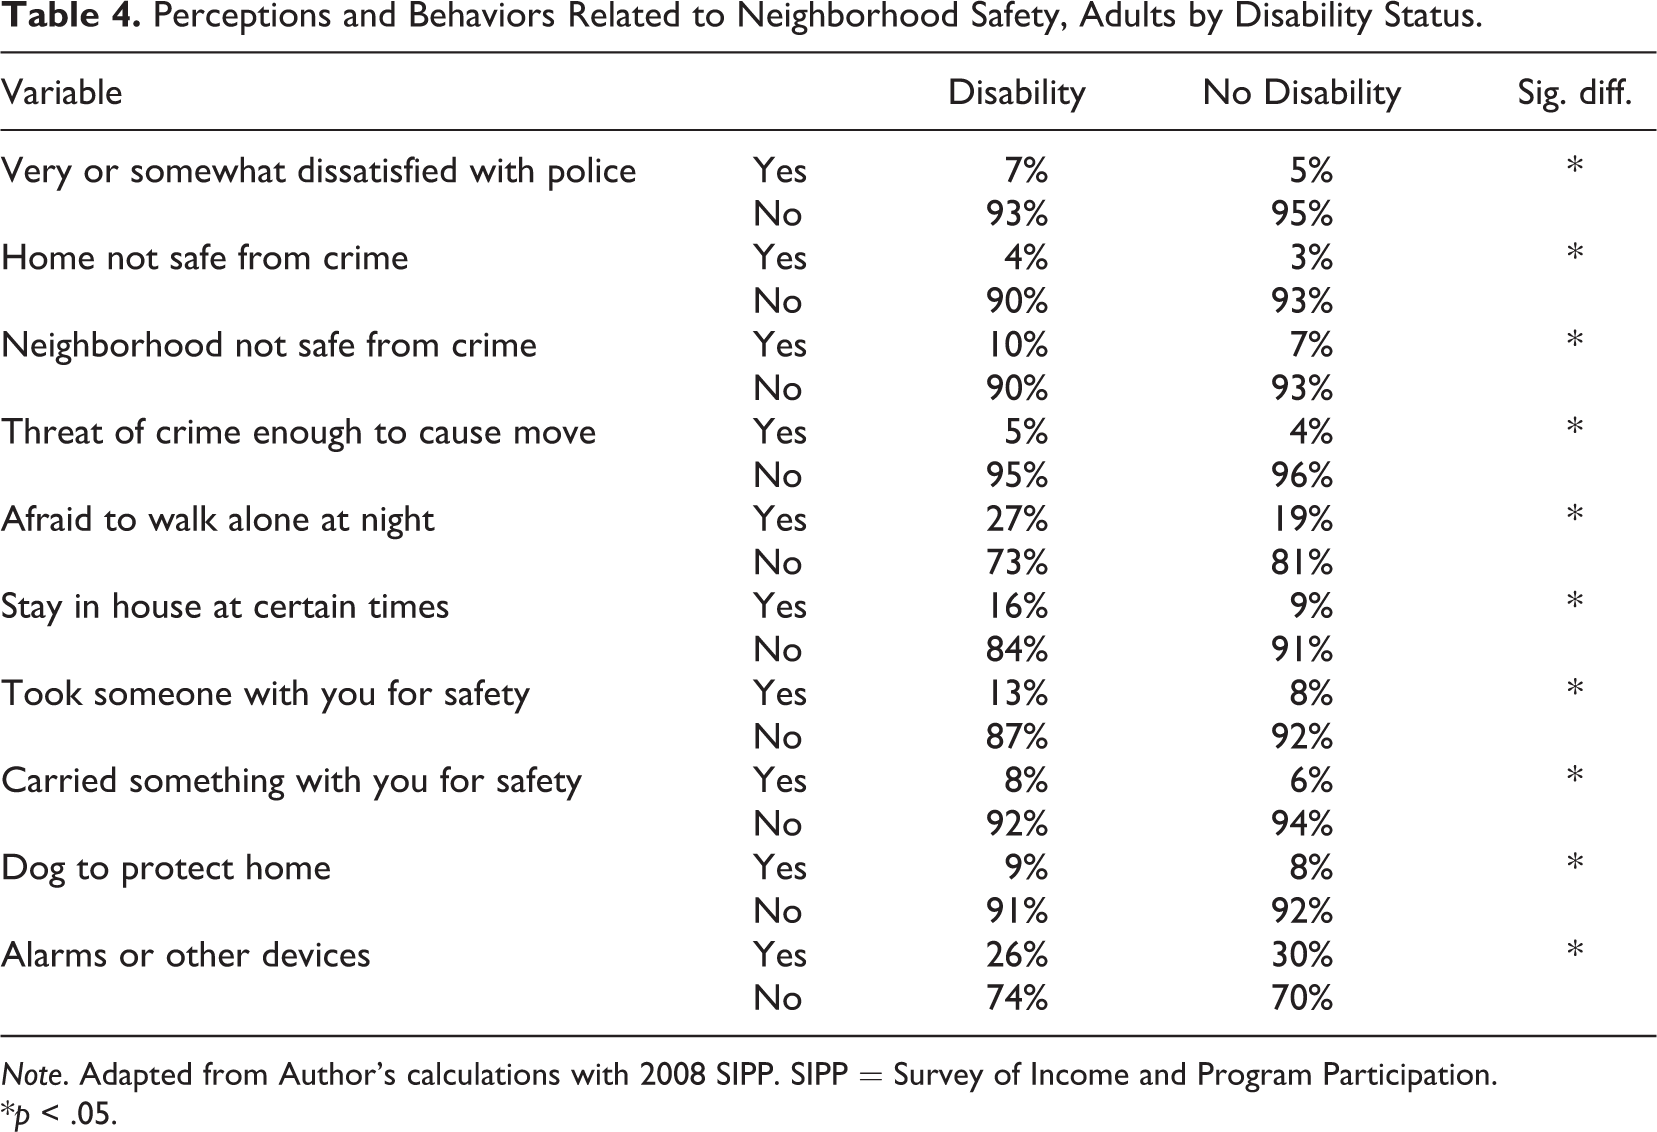
Note. Adapted from Author’s calculations with 2008 SIPP. SIPP = Survey of Income and Program Participation.
*p < .05.
Multivariate Results
Table 5 includes the results from the regressions conducted on the full sample. Even when controlling for demographic variables, adults with disabilities generally had significantly higher odds of feeling unsafe, exhibiting protective behaviors due to safety concerns, or feeling dissatisfied with police services than persons without disabilities. Each of the hypotheses outlined earlier are confirmed. Effect sizes of disability were primarily in the medium range for most of the regressions. Persons with disabilities had lower odds of having home alarms, however. In addition, persons who were not poor had lower odds of feeling unsafe, holding other variables constant. Persons living in nonmetropolitan areas had higher odds of dissatisfaction with police but lower odds of feeling unsafe, holding all other variables constant. Satisfaction with police had a large effect on fear of crime. Persons who were dissatisfied with police had significantly higher odds of perceiving their neighborhoods and homes as unsafe from crime (OR: 7.29, p < .001 for neighborhood; OR: 6.96, p < .001 for home).
Logistic Regressions of Safety, Adults (Weighted N = 224,681,167).
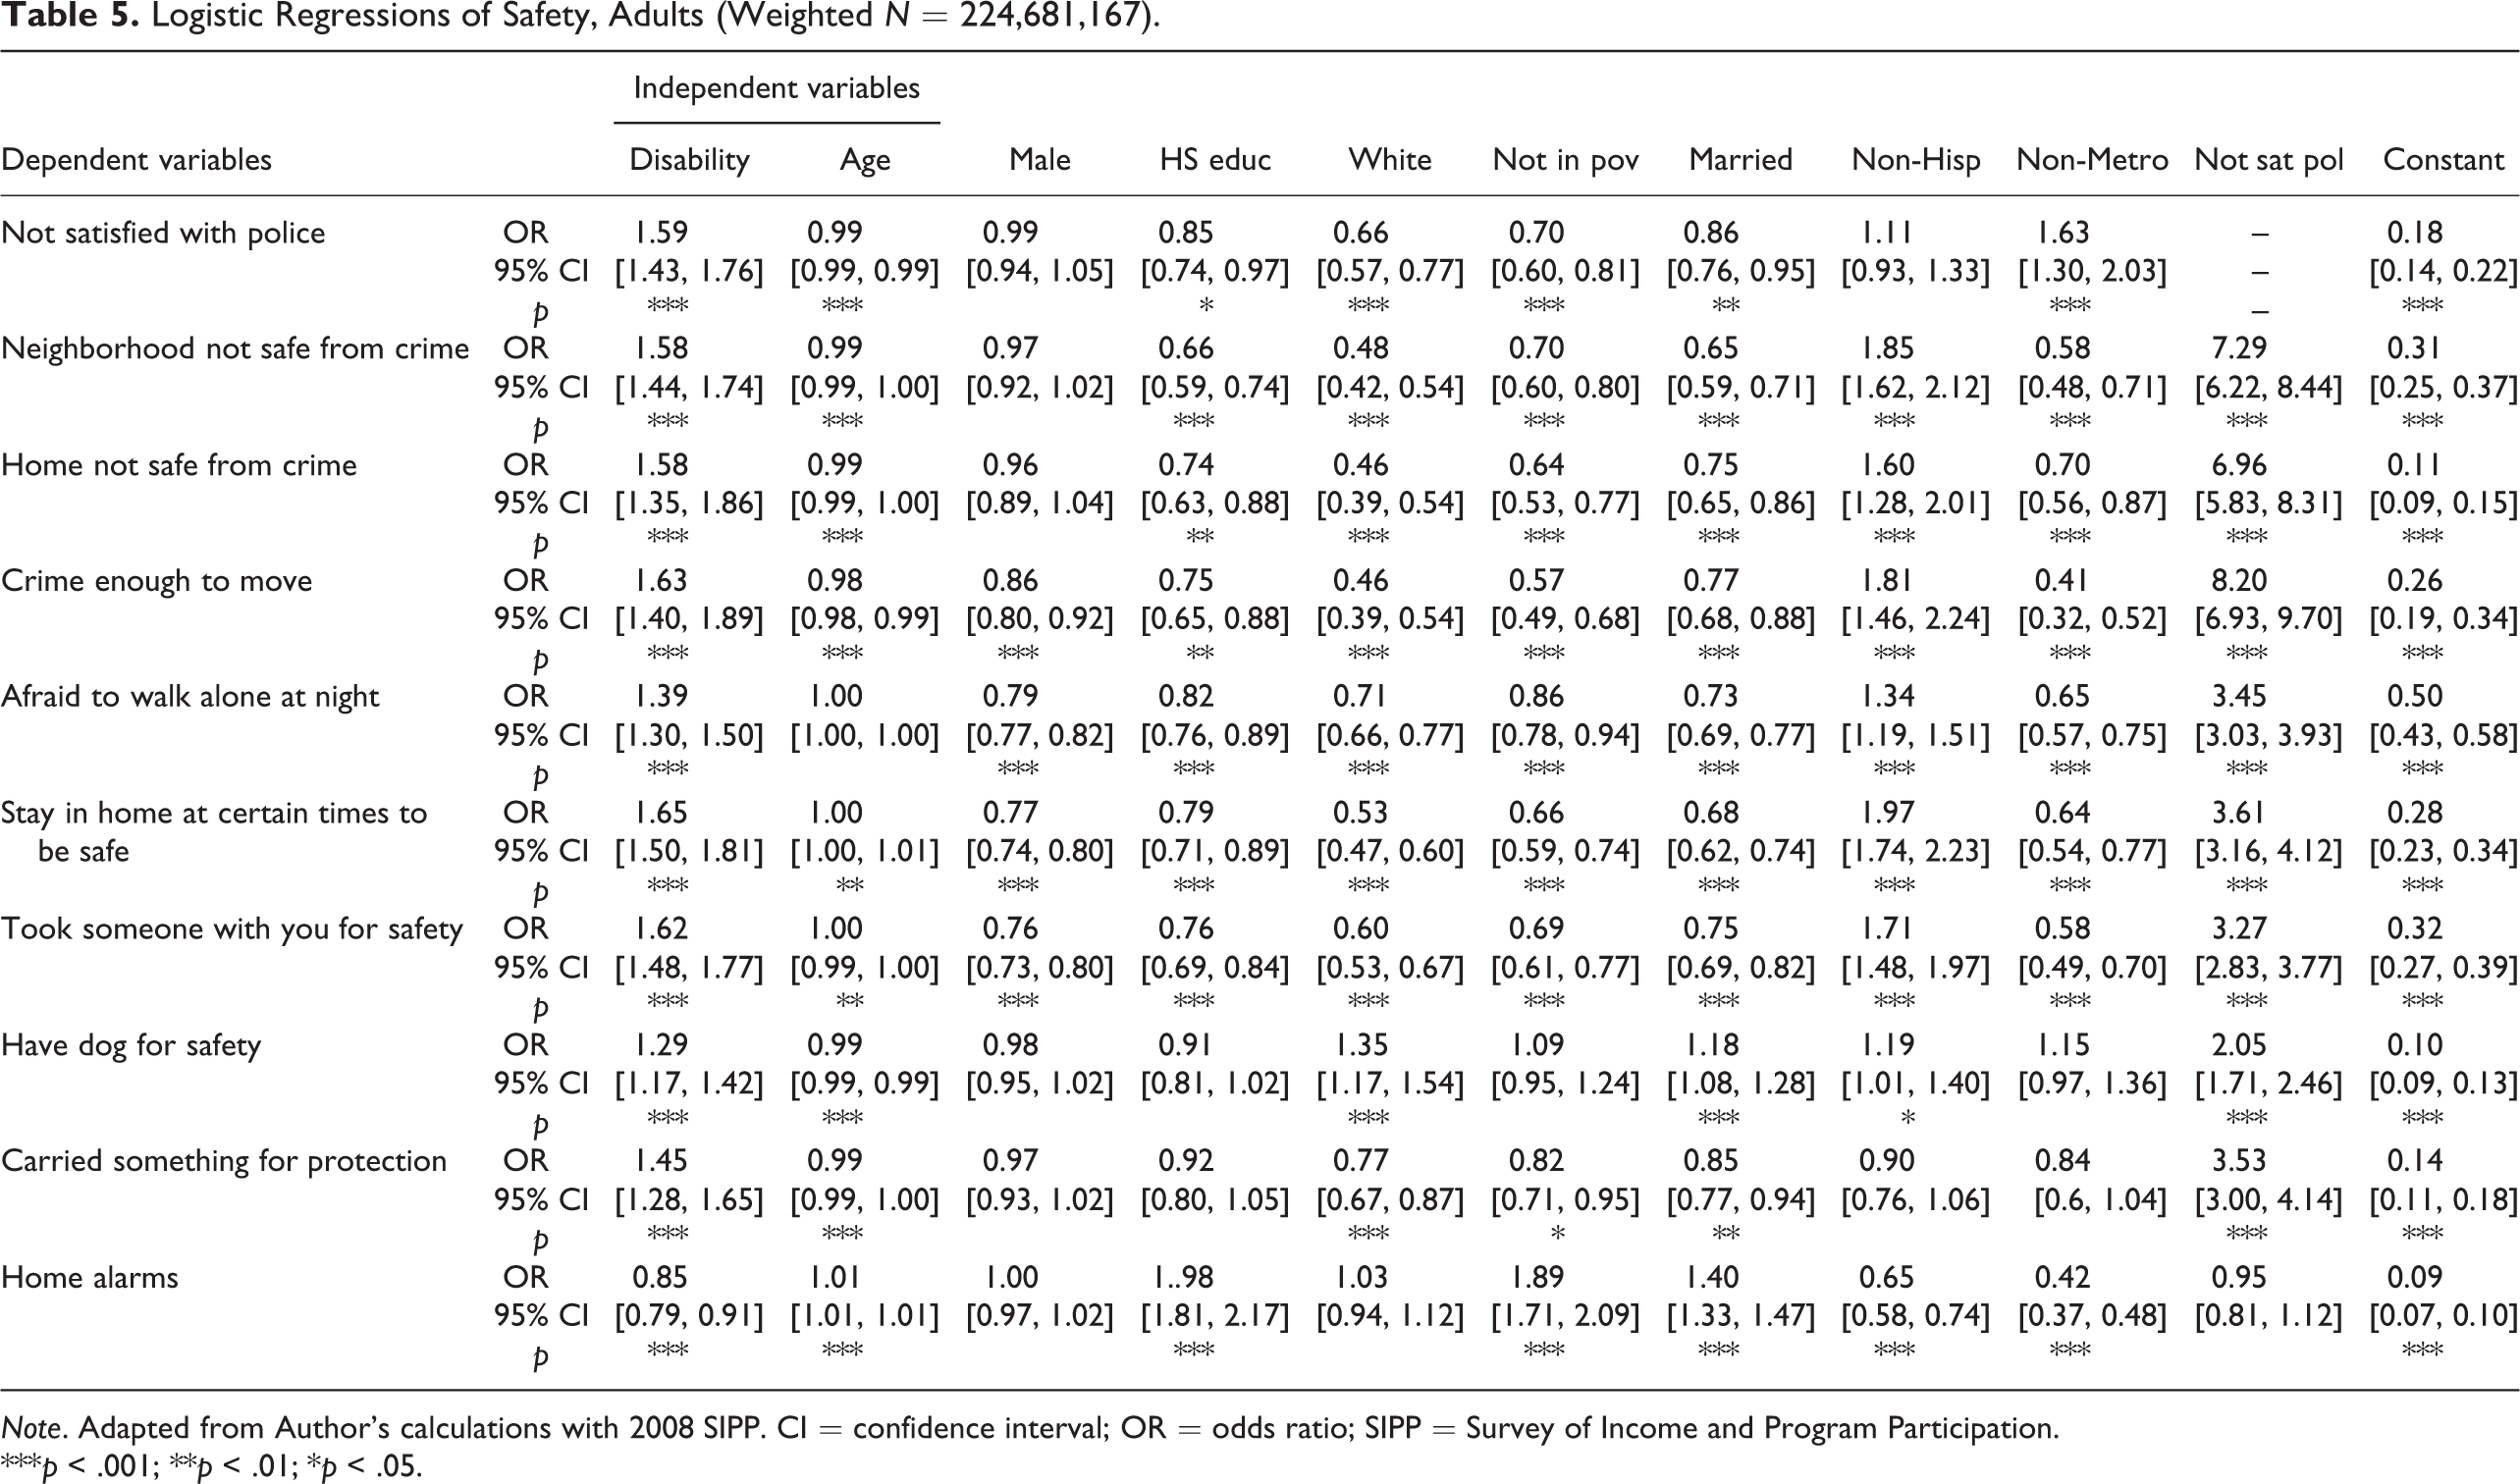
Note. Adapted from Author’s calculations with 2008 SIPP. CI = confidence interval; OR = odds ratio; SIPP = Survey of Income and Program Participation.
***p < .001; **p < .01; *p < .05.
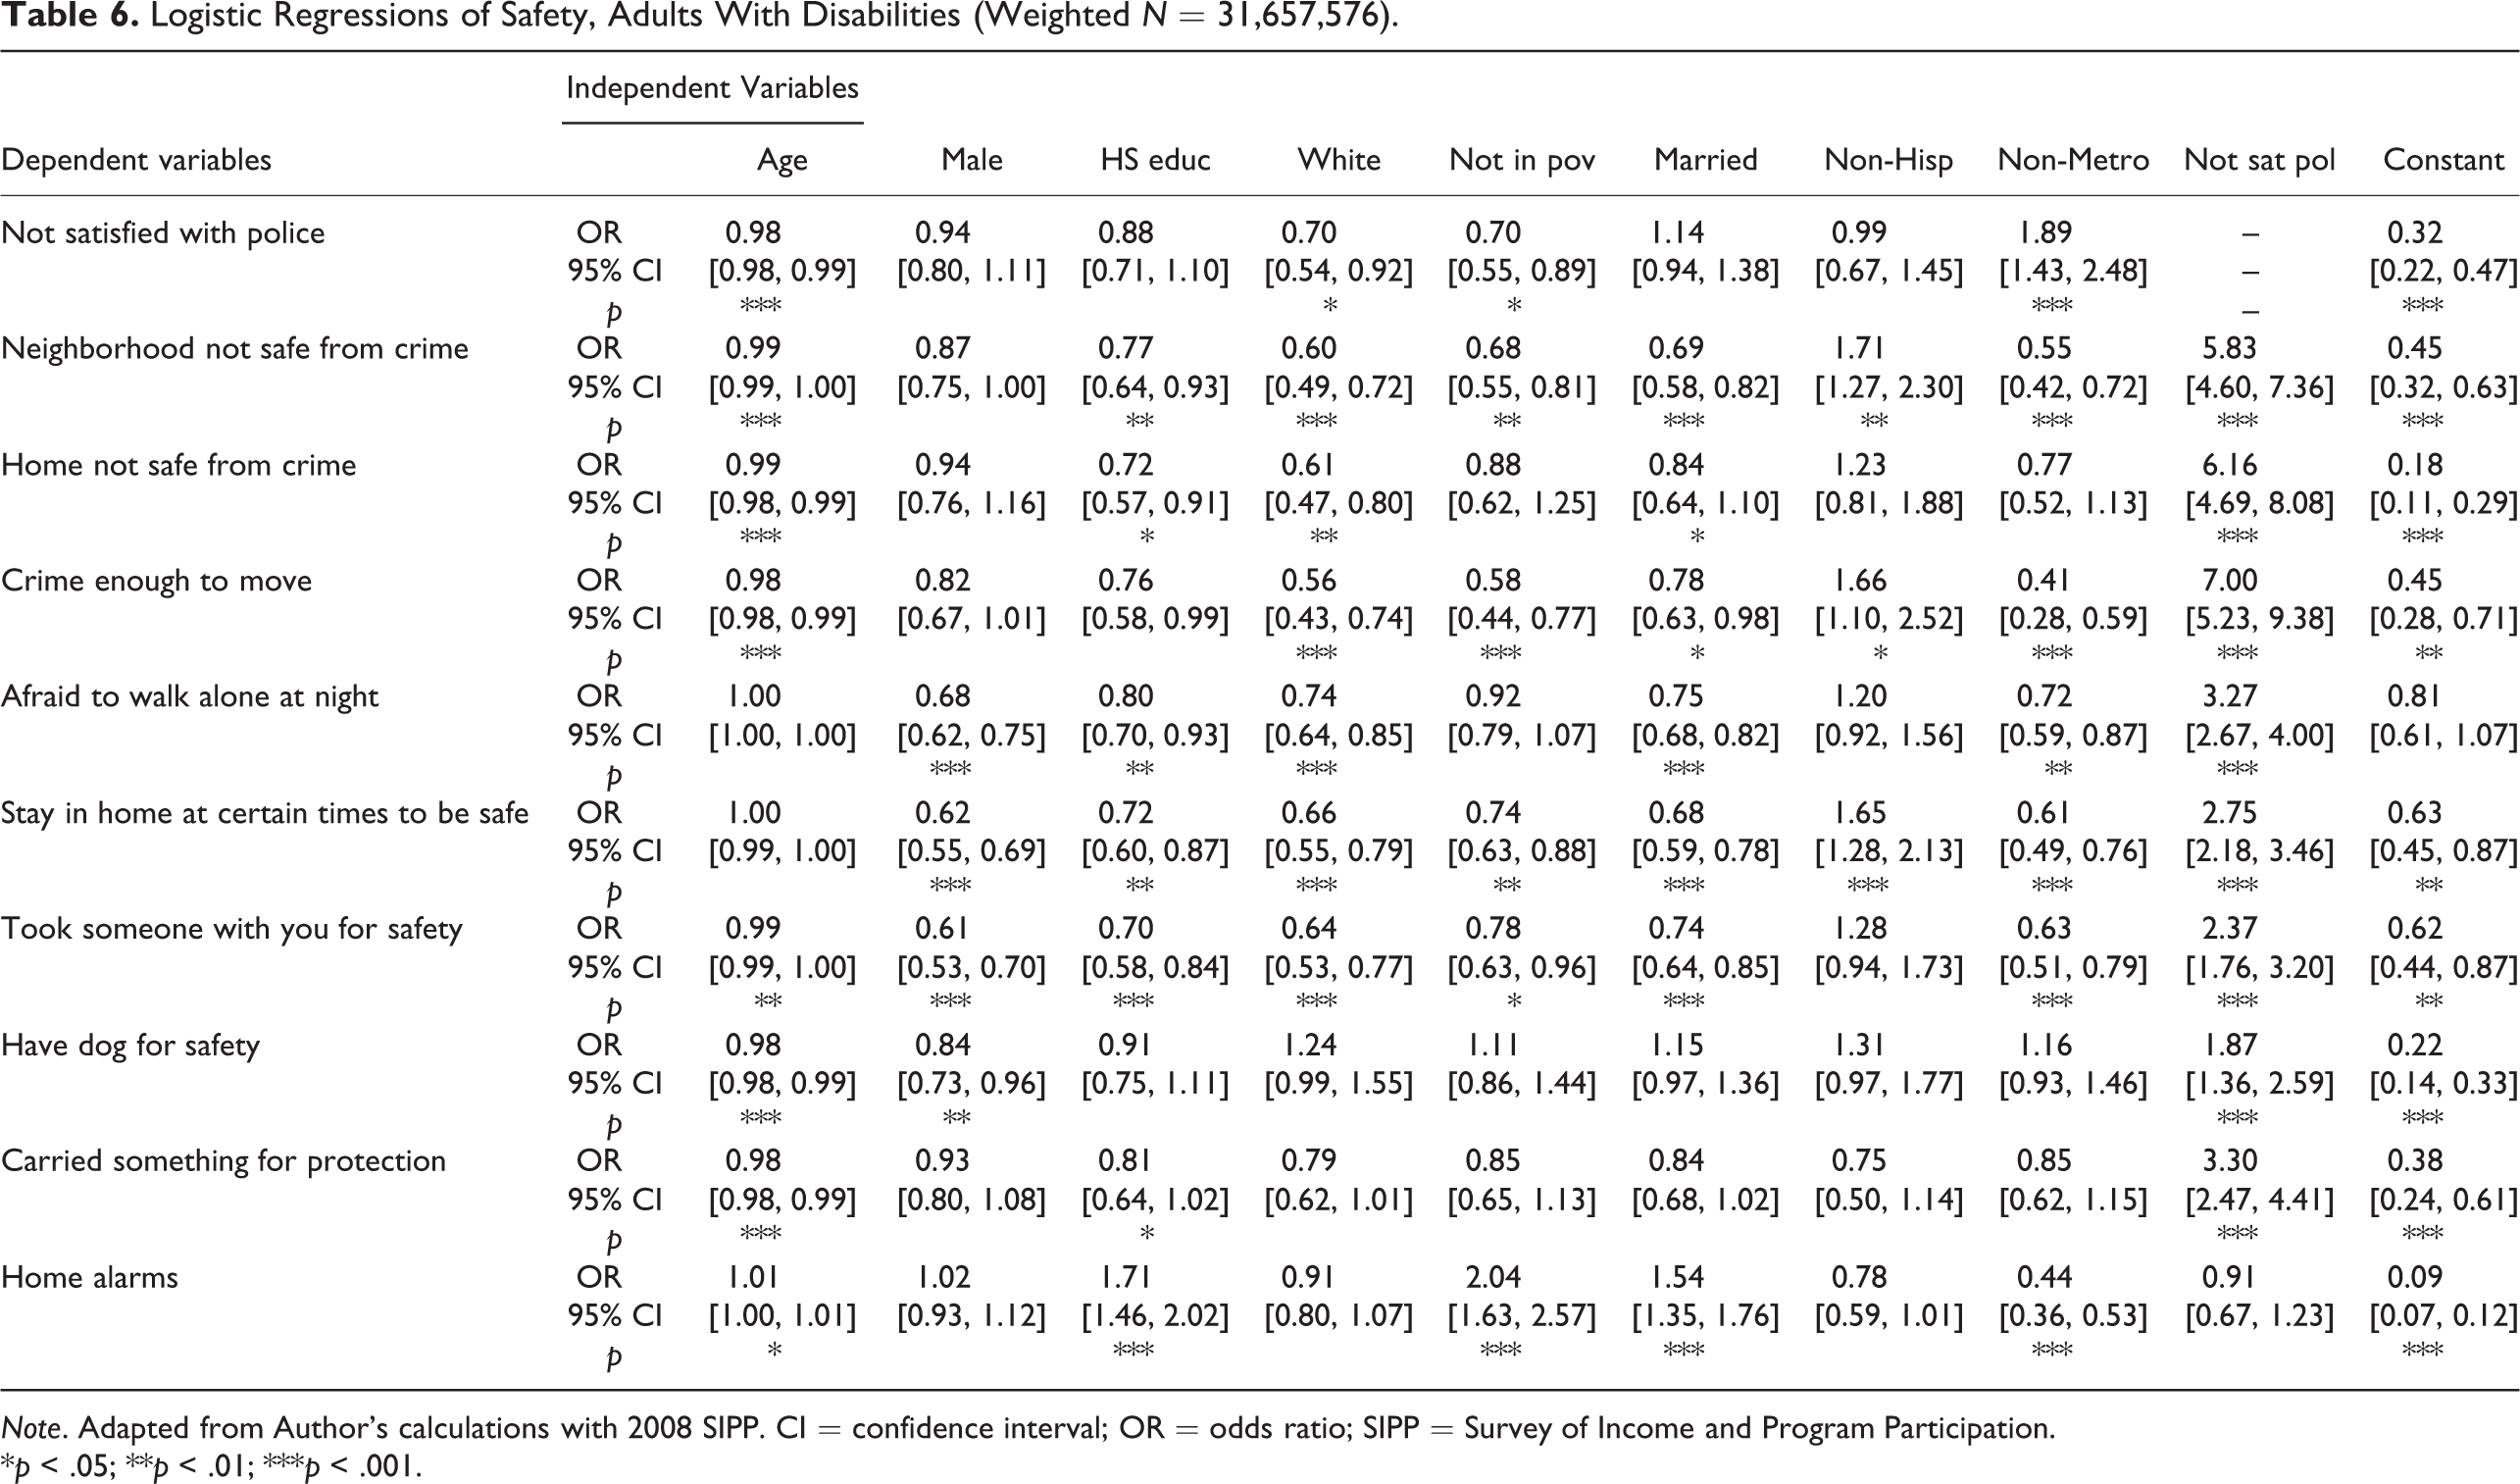
In Table 6, the logistic regressions performed on only the sample of adults with disabilities are presented. Persons with disabilities who were not in poverty or were living in a nonmetropolitan area had significantly lower odds of perceiving that their neighborhoods were not safe from crime, compared to persons with disabilities who were poor or were living in metropolitan areas. In other words, persons with disabilities who were more economically secure and were living in more suburban areas had higher perceptions of safety. Of particular note, persons with disabilities who were nonpoor or who lived in a nonmetropolitan area had significantly lower odds of reporting that crime was enough of a problem that they would like to move (OR: 0.56 for nonpoor, p < .001, and OR: 0.41 for nonmetropolitan, p < .001).
Logistic Regressions of Safety, Adults With Disabilities (Weighted N = 31,657,576).
Note. Adapted from Author’s calculations with 2008 SIPP. CI = confidence interval; OR = odds ratio; SIPP = Survey of Income and Program Participation.
*p < .05; **p < .01; ***p < .001.
Dissatisfaction with police had a large effect of feelings of safety and a medium effect on the presence of protective behaviors for adults with disabilities, even when controlling for other factors. The odds of being unsatisfied with police were significantly higher for those persons with disabilities who were living in nonmetropolitan areas (OR: 1.89, p < .001), yet concerns about personal safety were lower (OR: 0.55, p < .001 for neighborhood; OR: 0.77, p < .001 for home) .
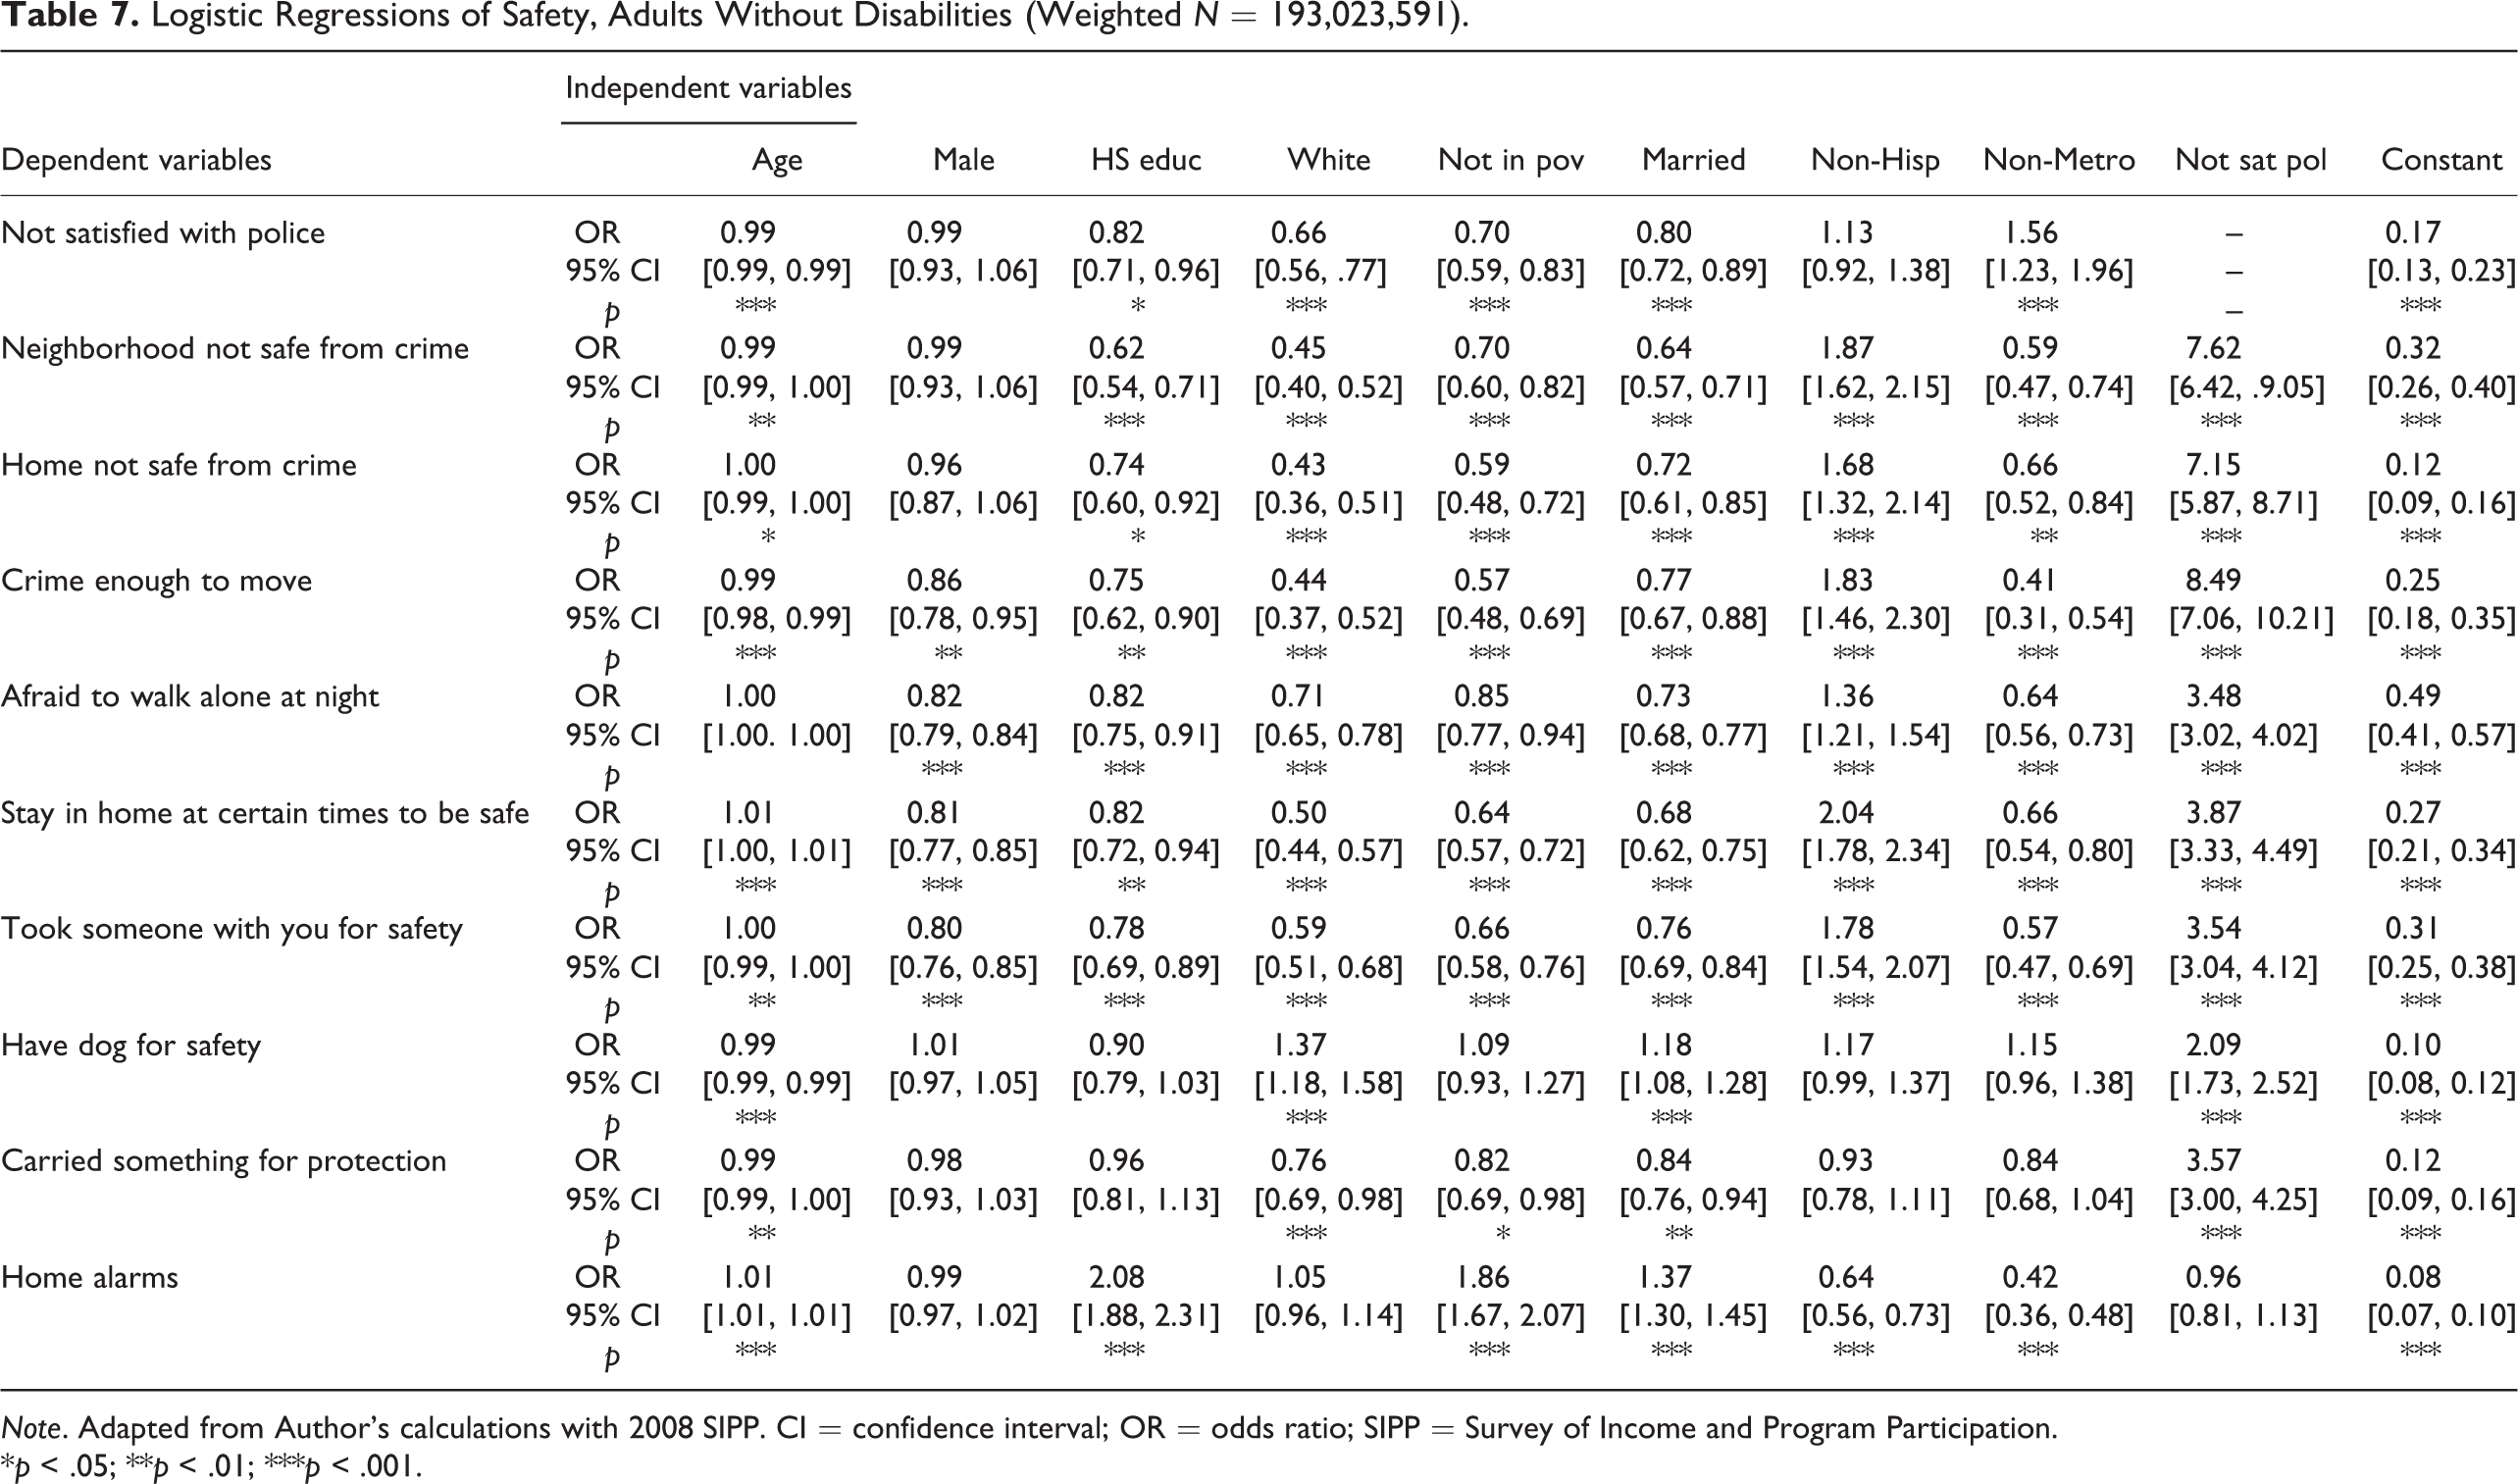
Table 7, showing results for persons without disabilities, provides similar results, keeping in mind that the odds ratios presented are comparisons only to other persons without disabilities. Similar to their counterparts with disabilities, adults without disabilities who were not in poverty or were living in nonmetropolitan areas had significantly lower odds of feeling that their neighborhoods were unsafe, compared to adults without disabilities who were poor or were living in metropolitan areas. Dissatisfaction with police had a large effect on perceptions of crime and a medium effect on protective behaviors. Persons without disabilities who resided in nonmetropolitan areas had greater odds of being dissatisfied with police (OR: 1.56, p < .001) but lower odds of feeling that either their neighborhood or their home was unsafe (OR: 0.59, p < .001 for neighborhood; OR: 0.66, p < .001 for home). Caution should be taken in interpreting these results, however, given that adults with disabilities as a group had significantly higher odds of experiencing fear of crime, exhibiting protective behaviors and being dissatisfied with police.
Logistic Regressions of Safety, Adults Without Disabilities (Weighted N = 193,023,591).
Note. Adapted from Author’s calculations with 2008 SIPP. CI = confidence interval; OR = odds ratio; SIPP = Survey of Income and Program Participation.
*p < .05; **p < .01; ***p < .001.
Discussion
Persons with disabilities are more likely to perceive their neighborhoods as unsafe, to exhibit protective behaviors in response to perceptions of safety and are less satisfied with police services than persons without disabilities, even when controlling for individual characteristics. The research presented here highlights another area of disadvantage for persons with disabilities in the United States, an area that can hinder access to the services and supports that are necessary to fully integrate persons with disabilities into the community. Thinking back to the fear of crime vulnerability theory articulated at the outset of this article, in which fear of crime results from an increased sense of economic, physical, or social vulnerability, can provide a framework for understanding these results.
The economic disadvantage that persons with disabilities face can influence choice of residence and the availability of resources to address personal safety concerns. Not surprisingly, greater economic security is associated with higher perceived levels of safety for persons with disabilities. Although the research conducted here with cross-sectional data cannot identify a causal relationship between economic security and perceived levels of safety, understanding whether such a causal relationship does indeed exist would be relevant to planning the services and supports that promote employment and financial stability for persons with disabilities. In addition, economic security is also entwined with many other facets of well-being, including employment, food security, and housing stability. Understanding exactly how safety interacts with these other areas of well-being is an important area of future research as well.
Persons with disabilities may face a higher sense of physical vulnerability. A person who has an ambulatory impairment, for example, may feel less secure traveling in a neighborhood that has higher levels of crime and thus may exhibit protective behaviors when navigating the neighborhood environment. As the results shared earlier suggest, adults with disabilities are more likely than persons without disabilities to report being afraid to walk alone at night, to stay in their houses at certain times, and to take someone with them when leaving the house due to safety concerns, even when controlling for age and other individual factors. The provision of adequate personal support services and accessible and supportive transportation services can help to decrease this sense of physical vulnerability.
A sense of social vulnerability may come into play as well as prior research has shown lower levels of social capital and political participation for persons with disabilities. Persons with disabilities are less likely to be engaged in the political process (Government Accountability Office [GAO], 2013) and are less likely to be involved in civic associations (Brucker, 2014). To address issues of social integration, stronger efforts need to be made to include persons with disabilities in political activities so that they can advocate for the dedication of more resources to improve both safety and the provision of public services at the local level. Improving the accessibility of voting facilities and offering opportunities for other accommodations can improve voting participation (GAO, 2013), increasing levels of civic engagement for persons with disabilities. Efforts can also focus on ensuring that civic associations and local government agencies include the participation of persons with disabilities, whether as employees or committee members. Increasing opportunities for persons with disabilities to positively engage with local police departments may offer benefits as well, both from the perspective of persons with disabilities and from the perspective of public safety organizations that wish to provide inclusive levels of service within their communities. In this way, persons with disabilities can be more involved in shaping their local environment to improve integration at a neighborhood level.
In addition to feeling unsafe, persons with disabilities are more likely to be dissatisfied with police services. Persons with disabilities may have higher expectations for the quality of police services than persons without disabilities, given their higher level of concern with personal safety and thus may judge the adequacy of services in a different light. Alternatively, there may be opportunities for improving the ability of police and other public safety professionals to understand and accommodate the diverse needs of the heterogeneous group of persons with disabilities. Similar to persons without disabilities, adults with disabilities who lived in nonmetropolitan areas were more critical of police. More in-depth qualitative research might provide an opportunity to uncover why increased levels of dissatisfaction with police services are found among adults with disabilities and why levels of dissatisfaction differ by metropolitan status.
The results presented here also confirm that residing in a nonmetropolitan area is associated with higher perceptions of safety for adults with disabilities. Alternatively, persons with disabilities who reside in metropolitan areas are more likely to have safety concerns yet are more likely to be satisfied with police services than persons with disabilities who live in nonmetropolitan areas. This paradox implies that persons with disabilities may face a trade-off when determining where to reside. To have access to adequate local services, including accessible health care services and public transportation, may require residence in a metropolitan area. Yet, issues of safety rise in metropolitan areas. This finding supports prior work, which has suggested that persons with disabilities who are living in nonmetropolitan or rural areas are faced with lower quality public services. Future research can examine the complex interaction of economic and personal factors that persons with disabilities consider when establishing a residence.
In terms of individual characteristics, being married is positively associated with lower concerns about crime and safety for persons with disabilities. This result may be due to the presence of another adult person in the household or may be reflective of unobserved characteristics of the person with the disability. As persons with disabilities in general are less likely to be married (Sevak, Houtenville, Brucker, & O’Neill, 2014), perhaps those persons who are married have disabilities that are less severe than those found among persons who are not married. The severity of disability likely is associated with perceived level of safety. Future research, research that incorporates more information about the nature of the disability, can explore this issue in more detail.
In sum, programs and services designed to reduce the economic, physical, and social vulnerability of persons with disabilities may be able to influence levels of fear of crime. While other research has demonstrated that persons with disabilities face disparities in access to employment, health care, and other services, the influence of fear of crime on these specific outcomes has not yet been examined. Future research should investigate whether an association exists between fear of crime and these other outcomes.
Several limitations of the analysis conducted here deserve mention. First, omitted variables, including a lack of detailed information about the geographic area or specific information about the onset and severity of the disability, weaken the analytical results. In addition, given the nature of the data used here, matching persons with and without disabilities by specific neighborhoods is not possible. Such information would have provided a better sense as to disparities that exist within neighborhoods. Limitations in measurement also exist. Information about prior victimization would be beneficial to understanding levels of fear from crime as would the inclusion of measures that address specific types of crime. Prior research has suggested, for example, the replacement of broad measures that assess global feelings of safety in the neighborhood with measures that focus on fears of specific crimes (Ferraro & LaGrange, 1987; Garofalo & Laub, 1978). Fear of crime measures on the whole are commonly criticized as being unable to distinguish between emotional fear of crime and cognitive judgments concerning the risk of crime victimization (Franklin et al., 2008). The measures used here cannot disentangle these two constructs. The problems inherent with attempting to measure a complex construct such as fear of crime (Ferraro & LaGrange, 1987) should therefore be kept in mind while interpreting the results. Finally, the use of cross-sectional data does not allow for an understanding of whether persons adopted certain behaviors in response to either victimization or the development of a disabling condition.
Conclusion
Perceptions of neighborhood safety vary among adults with and without disabilities, in metropolitan and nonmetropolitan areas in the U.S. On the whole, persons with disabilities feel less safe, are more likely to exhibit protective behaviors due to safety concerns, and are less satisfied with police services than persons without disabilities. These results highlight an area of disadvantage that has not received much attention to date within the disability literature, an area that is important to understanding the overall well-being of persons with disabilities in the United States. Results differ by location for persons with disabilities, however, as persons with a disability who live in metropolitan areas feel less safe but are more satisfied with local police services than persons with disabilities who live in nonmetropolitan areas. Future research can explore in more detail this divide in the experiences of persons with disabilities who live in different geographies.
Footnotes
Declaration of Conflicting Interests
The author(s) declared no potential conflicts of interest with respect to the research, authorship, and/or publication of this article.
Funding
The author(s) received no financial support for the research, authorship, and/or publication of this article.