



Abstract
This research note empirically assessed similarities and differences among three open-source data sets from 2015-2019. Fatal police shooting incidents were compared across Washington Post, Mapping Police Violence, and Fatal Encounters data over a five-year period. One-way ANOVAs, bivariate correlations, and proportional percentage differences were used to examine mean differences, correlational strength, and yearly percentage difference trends. No significant mean differences were observed between Fatal Encounters, Mapping Police Violence, and Washington Post. With one exception, bivariate correlations between all three data source dyads were consistently strong. Percentage difference comparisons among data source dyads, however, revealed that the sources are becoming more dissimilar in their reporting of fatal shootings over time. Our results complement existing literature that has compared open-source police shooting data to government sources and suggest that the three data sources were strongly associated with one another from 2015-2019. Increasing differences between sources, however, necessitate continued inspection of the data across the various open-source platforms over time.
For decades, academics, practitioners, and the public have sought to determine the number of fatal police shootings of civilians each year. Continual calls have been made to establish a national database of police use of force (Alpert, 2016; Fyfe, 2002; Holmes, 2020; Kane, 2007; Klinger, 2008; Klinger et al., 2016; Shane, 2018). The FBI has worked to create the National Use of Force Data Collection platform to provide national estimates of police use of force. However, reporting is voluntary, and public release of the data is dependent upon the coverage rates for each state (the total law enforcement population represented). Currently, approximately 41 percent of law enforcement agencies nationwide have submitted data, representing 54 percent of the total number of sworn officers in the U.S. As such, only coverage data has been released publicly so far, and the FBI has stated that conclusions about national use of force estimates should not be made until the national coverage rate hits 80 percent (FBI, n.d.). In the absence of a national police use of force estimates, researchers have had to rely on other data sources that collect information on fatal police shootings.
To date, several alternative sources exist including government (e.g., National Vital Statistics System [NVSS], National Violent Death Reporting System [NVDRS], Supplemental Homicide Reports) and open-source data (e.g., Fatal Encounters, The Guardian, Mapping Police Violence, Washington Post). As a result, one line of research has developed that compares homicides by police across the different government sources (Barber et al., 2016; Loftin et al., 2003) or to official department data (Ozkan et al., 2018). A handful of studies have also specifically compared government data to open-source data to determine their coverage relative to each other. Collectively, the results indicate that the number of reported incidents between these two types of data sources do vary and that open-source data have greater coverage of fatal police shootings when compared to government sources (Baćak et al., 2019; Conner et al., 2019; Feldman et al., 2017a; Feldman et al., 2017b; Finch et al., 2019; Global Burden of Diseases, 2019 Police Violence US Subnational Collaborators, 2021; Ozkan et al., 2018; Renner, 2019; Tregle et al., 2019; Williams et al., 2019; Zimring, 2016). Most recently, the Global Burden of Diseases (GBD) 2019 Police Violence US Subnational Collaborators (2021) compared fatal police violence deaths in the NVSS to Fatal Encounters, The Guardian, and Mapping Police Violence from 1980–2018. Their results indicated that more than half of all fatal police violence incidents during this time went unreported in the NVSS. Furthermore, underreporting in the NVSS was not equal across racial/ethnic groups, with the greatest underreporting occurring for Non-Hispanic, Black people.
The current lack of a national use of force database combined with these research results has led to an increased reliance upon open-source data. Despite this reliance, research has not empirically examined comparisons across the different open-data sources. While the similarities and differences in definitional criteria and methodologies used across the different open-data sources has been discussed (Holmes, 2020), only one study has partially compared Fatal Encounters, Mapping Police Violence, and Washington Post data within the same study. Here, however, the primary purpose was to assess the coverage of fatal shootings captured by the NVDRS and open-data sources relative to an initial pre-determined base data count from the year 2015 (Conner et al., 2019). Head-to-head comparisons and trends over time among the three open-data sources were not examined.
Examining similarities and differences across open-source data are important for both the public and academic research. Currently, if an individual turned to an open-data source to see how many police-involved civilian deaths occurred each year, the counts will vary depending on the source being consulted. These differences exist even when care is taken to ensure that the types of incidents in question (e.g., fatal shootings vs. all police-involved deaths) are being appropriately compared. For example, the data collected for the current inquiry, fatal police shootings by on-duty officers, indicated that Fatal Encounters reported 5,342 incidents, Mapping Police Violence reported 5,134 incidents, and the Washington Post reported 4,931 incidents. Although these divergent numbers allow for approximations of how many people are fatally shot by the police each year (Holmes, 2020; Keith et al., 2017), divergent data can lead to misperceptions about how many fatal police shootings occur over a given period which subsequently affects the framing of the nature and extent of this controversial issue.
From a research perspective, the existence of multiple open-source datasets leads to two additional reasons for making comparisons. First, multiple sources present researchers with choices as to which data to use to answer their questions. For example, Fatal Encounters (Schwartz & Jahn, 2020), Guardian (Cesario et al., 2019), and Washington Post (Tregle et al., 2019) data have all been used separately to examine racial and/or ethnic disparities in fatal police shootings. One focus of this research, as well as subsequent debates, has been in identifying appropriate benchmarks, or denominators, for making appropriate conclusions about the existence and extent of observed disparities (Nix, 2020). It is important to note, however, that significant differences in the actual number of shootings, or the numerators, across data sources can also make it difficult to draw consistent conclusions regarding disparities.
On the other hand, some studies may have to rely on specific data sources that collect the necessary information to provide an adequate test of the research questions (Holmes, 2020). For example, ecological theories posit that structural conditions or crime rates of an area are important for understanding fatal shootings by police. However, open-data sources currently differ on the amount and type of geographical information that is captured (Holmes, 2020). While Mapping Police Violence's website allows for geographic comparisons across cities and states, the downloadable data only provides address information. Both Fatal Encounters and the Washington Post provides the exact longitude and latitude coordinates. In this regard, researchers simply may choose Fatal Encounters or Washington Post data over Mapping Police Violence as these sources are easier to geocode.
Given the potential for results to be contingent on the specific data source being examined (Alpert, 2016; Fyfe, 2002; Kane, 2007; Klinger, 2008; Shane, 2018) and that data hold power in shaping perceptions and conclusions about the nature and extent of police shootings, inspection of open-data sources is necessary. Doing so can point researchers toward the data sources that provide more accurate and reliable information in order to improve policing efforts and reduce fatal encounters. Furthermore, many open-data sources have now existed for several years, and so it is worthwhile to examine temporal trends in the number of fatal police shootings. Examining trends allows us to see if the data sources are becoming more similar or dissimilar with the passage of time, which can help researchers spot patterns in the data and help make decisions about potential consistencies or inconsistencies in data coverage in the future. As such, the current study had three main objectives:
Determine whether average monthly counts of fatal shootings were significantly different between open-data sources from 2015–2019; Determine the correlational strength of monthly counts of fatal police shootings between open-data sources from 2015–2019; Determine the yearly linear percentage difference trends between combinations of open-data sources from 2015–2019.
Methods
Data and Selection Criterion
Data were drawn from three of the commonly used open-source data sets, Fatal Encounters (FE), Mapping Police Violence (MPV), and Washington Post (WP). Each source is a publicly available data set that collects a varying range of information, such as cause of death, decedent characteristics, location information, date, and incident descriptions, that are primarily drawn from media reports, news stories, and administrative records (Conner et al., 2019; Holmes, 2020; Ozkan et al., 2018; Renner, 2019). A total of five years of data were gathered from FE, MPV, and WP starting from January 1st, 2015 through December 31st, 2019. January 1st, 2015 was chosen as the starting point as this was the date that WP began collecting data on fatal police shootings. We excluded the Guardian as it only collected data for two of the study period years, 2015 and 2016.
Fatal police shooting incidents were initially selected according to each data source's cause of death variable. Importantly, only cases in which the ultimate cause of death was a result of an officer-involved shooting (i.e., gunshot) were selected, and all other reported incidents (e.g., cause of death solely listed as beatings, asphyxiations, TASER deaths, and various types of vehicular homicides) were excluded from the analysis. It should be noted that MPV and WP specify certain case records as “taser, gunshot” or “pepper spray, gunshot” or similar descriptors. Our review of the data suggest that these cases refer to instances in which the police initially attempted to use less-lethal force to gain control, but nevertheless shot and killed the decedent with their service weapons. Although these cases appear to have escalated from the use of less-lethal force to lethal-force, the outcome of interest (being fatally shot by the police) remains the same. As such, we include these cases in our analyses.
Additionally, FE and MPV allow for the inclusion of shootings perpetrated by off-duty officers, while WP only includes shootings by on-duty officers. We identified 117 fatal shootings by off-duty officers reported in FE, as well as 117 fatal shootings by off-duty officers reported in MPV across the five-year study period and opted to remove all off-duty cases from FE and MPV. Furthermore, we identified a total of 1,027 cases in FE that were perpetrated by the decedent, not the police. Many of these cases involved the police responding to a scene whereupon the decedent committed suicide. These cases were removed as they do not comport with our primary selection criterion. However, we did allow for the inclusion of “suicide-by-cop” cases because, in those instances, the decedent was in fact shot and killed by the police. In sum, the selection process used ensures that analyses are comparing the same types of cases across the three data sources and reflect fatal shootings perpetrated by on-duty officers.
The final analytic samples for each data source were as follows: 5,342 for FE, 5,134 for MPV, and 4,931 for WP. We employed a matching procedure in which each case record's reported date was matched against an independent date variable that proceeded chronologically by day across the five-year study period. This resulted in a single numerical value that represented the aggregated daily reported case records from each data source. Daily aggregate counts for each data source were then aggregated into a single monthly total for each data source, which are reported in Figure 1A.

Reported fatal police shootings by month 2015-2019.
To determine whether average monthly fatal shooting counts were significantly different between data sources, one-way ANOVAs for the years 2015–2019 were used. In these models, each data source's monthly totals were used to test for significant mean differences across the three data sources for each study year. Post-hoc tests were then conducted to determine the nature of any observed mean differences. Second, three data source dyads were created representing all possible combinations of any two data sources (i.e., FE-MPV, FE-WP, and MPV-WP). Bivariate correlations were calculated between each reporting modality's monthly counts to determine the strength of each dyad's linear association. For example, in 2015, FE had 12 monthly counts which were then correlated with the 12 monthly counts provided by MPV, as well as with the 12 monthly counts provided by WP. Pearson's correlations were repeated for every dyad in every year. Third, proportional calculations determined the percentage differences between the three data source dyads (i.e., FE-MPV; FE-WP; and MPV-WP). The equation for calculating proportional percentage differences is
Results
Table 1 provides the ANOVA results for each of the five years. As shown, both FE's and MPV's monthly mean shooting counts have generally increased over the five-year period, while WP's monthly means have stayed relatively stable over time. Furthermore, FE's monthly averages were consistently higher than MPV and WP's averages. F-tests comparing the average number of fatal shooting incidents reported by FE, MPV, and WP for the years 2015 through 2019 were not statistically significantly different from each other. Additionally, Bonferroni post-hoc tests were conducted given that Levene's test for homogeneity suggested that equal variances could be assumed. Findings from the Bonferroni tests also indicated no significant differences for any of the years.
FE, MPV, and WP 12-Month Fatal Shooting Averages 2015–2019.
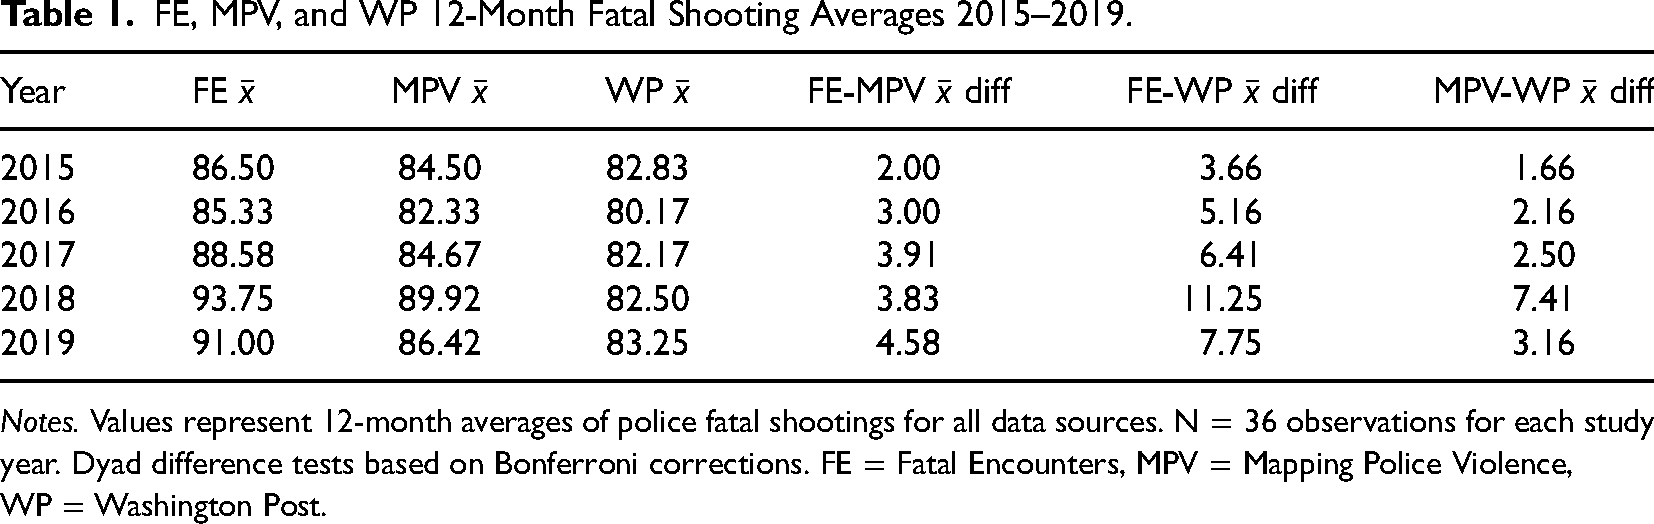
Notes. Values represent 12-month averages of police fatal shootings for all data sources. N = 36 observations for each study year. Dyad difference tests based on Bonferroni corrections. FE = Fatal Encounters, MPV = Mapping Police Violence, WP = Washington Post.
The observed mean difference between FE and MPV in 2015 was 2.00 shootings; however, differences between FE's and MPV's means increased over the five years. For example, FE reported on average 4.58 more police killings by gunshot per month than did MPV in 2019. Similarly, the results indicated that FE's monthly averages were higher than those reported by WP for every year compared. In 2015, the mean difference in reported shootings between FE and WP was 3.66 and increased to 7.75 by 2019. When observing the year 2018, Table 1 indicates that on average, FE reported 11.25 more shootings per month than did WP. Additionally, the MPV-WP dyad had small monthly mean differences across all years compared, ranging from a low average of 1.66 incidents in 2015 to a high of 7.41 in 2018. Again, none of these differences reached statistical significance; however, the patterns indicate that monthly mean differences across the three sources have increased over time.
Table 2 provides the correlation results for the 12-month dyad comparisons. As shown, all correlation coefficients for the FE-MPV dyad were positive and strong (r > .71). These results indicate that average shooting counts reported by FE and MPV share a strong linear association in every year assessed, irrespective of frequency and percentage differences. As such, FE and MPV correlate very highly with each other, sharing a similar linear trajectory of reported shooting incidents each year. Correlation coefficients for the FE-WP dyad indicated that all correlation coefficients, except one in 2018 (r = .67), were positive and strong (r > .71). These results suggest that the correlations between FE and WP average shooting counts share a strong linear association for all but one year assessed. Correlation coefficients for the 12-month MPV-WP comparisons were positive and strong (r > .71), suggesting that the data sources share a strong linear association with each other. As was the case with the other dyads assessed, MPV and WP correlated very strongly with each other despite any frequency and percentage differences. In sum, MPV and WP appear to be collinear in their linear trajectory each year when observed at the monthly unit of analysis.
Bivariate Correlations Assessing Dyad Linear Associations 2015–2019.
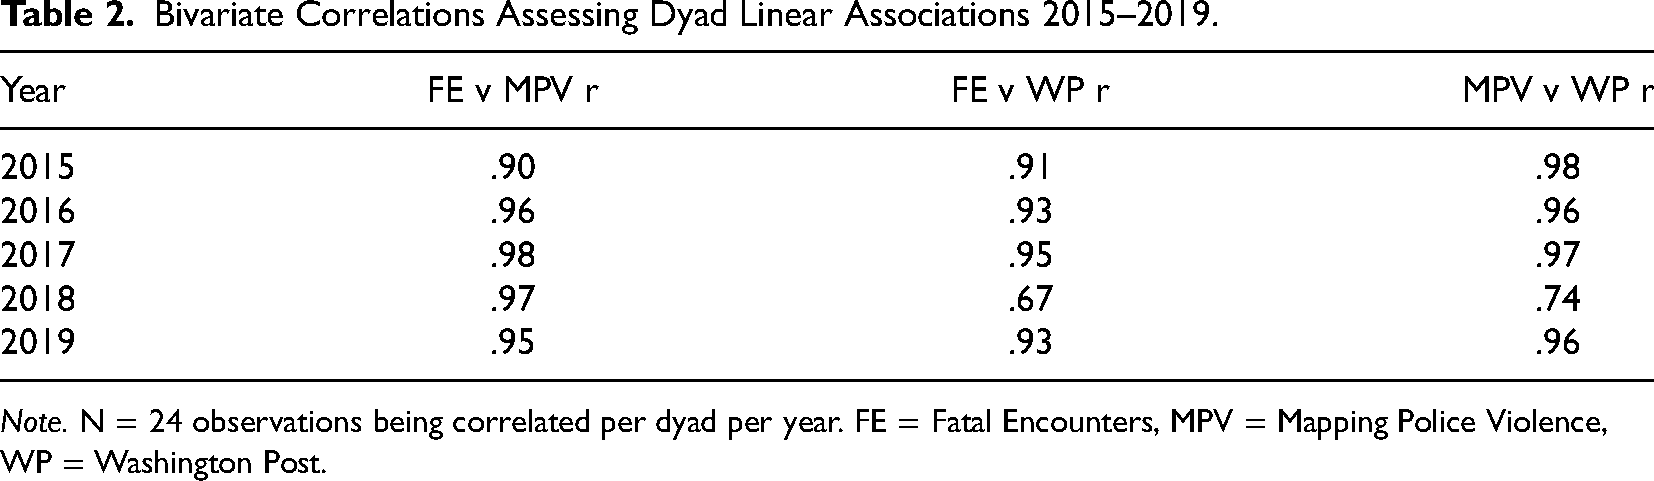
Note. N = 24 observations being correlated per dyad per year. FE = Fatal Encounters, MPV = Mapping Police Violence, WP = Washington Post.
Before assessing percentage differences between data sources, we created a cumulative tabulation of each data source's reported shootings and compared them as a linear function. Figure 1B reveals that the monthly reported counts of fatal police shootings are diverging from each other over time. Indeed, FE's cumulative totals appear to be outpacing both MPV's and WP's cumulative totals. Similarly, MPV's cumulative totals are increasing faster than WP's. Thus, Figure 1B reveals that cumulatively over time, FE has reported more cases than either MPV or WP, and that MPV has reported more cases than WP. Additionally, this difference in cumulative counts in reporting between data sources appears to be getting larger as time progresses.
Percentage differences in reported fatal police shootings within dyads and their linear trajectories through time are provided in Figure 2. Lines of best fit were added to show the general linear trend of percentage differences in reported shooting incidents over time. Again, the percentage differences were calculated in a way where a linear trend that increases over time indicates that the data sources are becoming more dissimilar in their reporting with the passage of time. In contrast, if a linear trend were to decrease over time, this would suggest that the data sources are becoming more similar in their reporting over time because the percent differences between reporting modalities would be decreasing. In the event that a linear trend stayed relatively stable (flat linear line), this would suggest that the data sources, although reporting different percentages of incidents, are consistent in their differences in relation to each other.
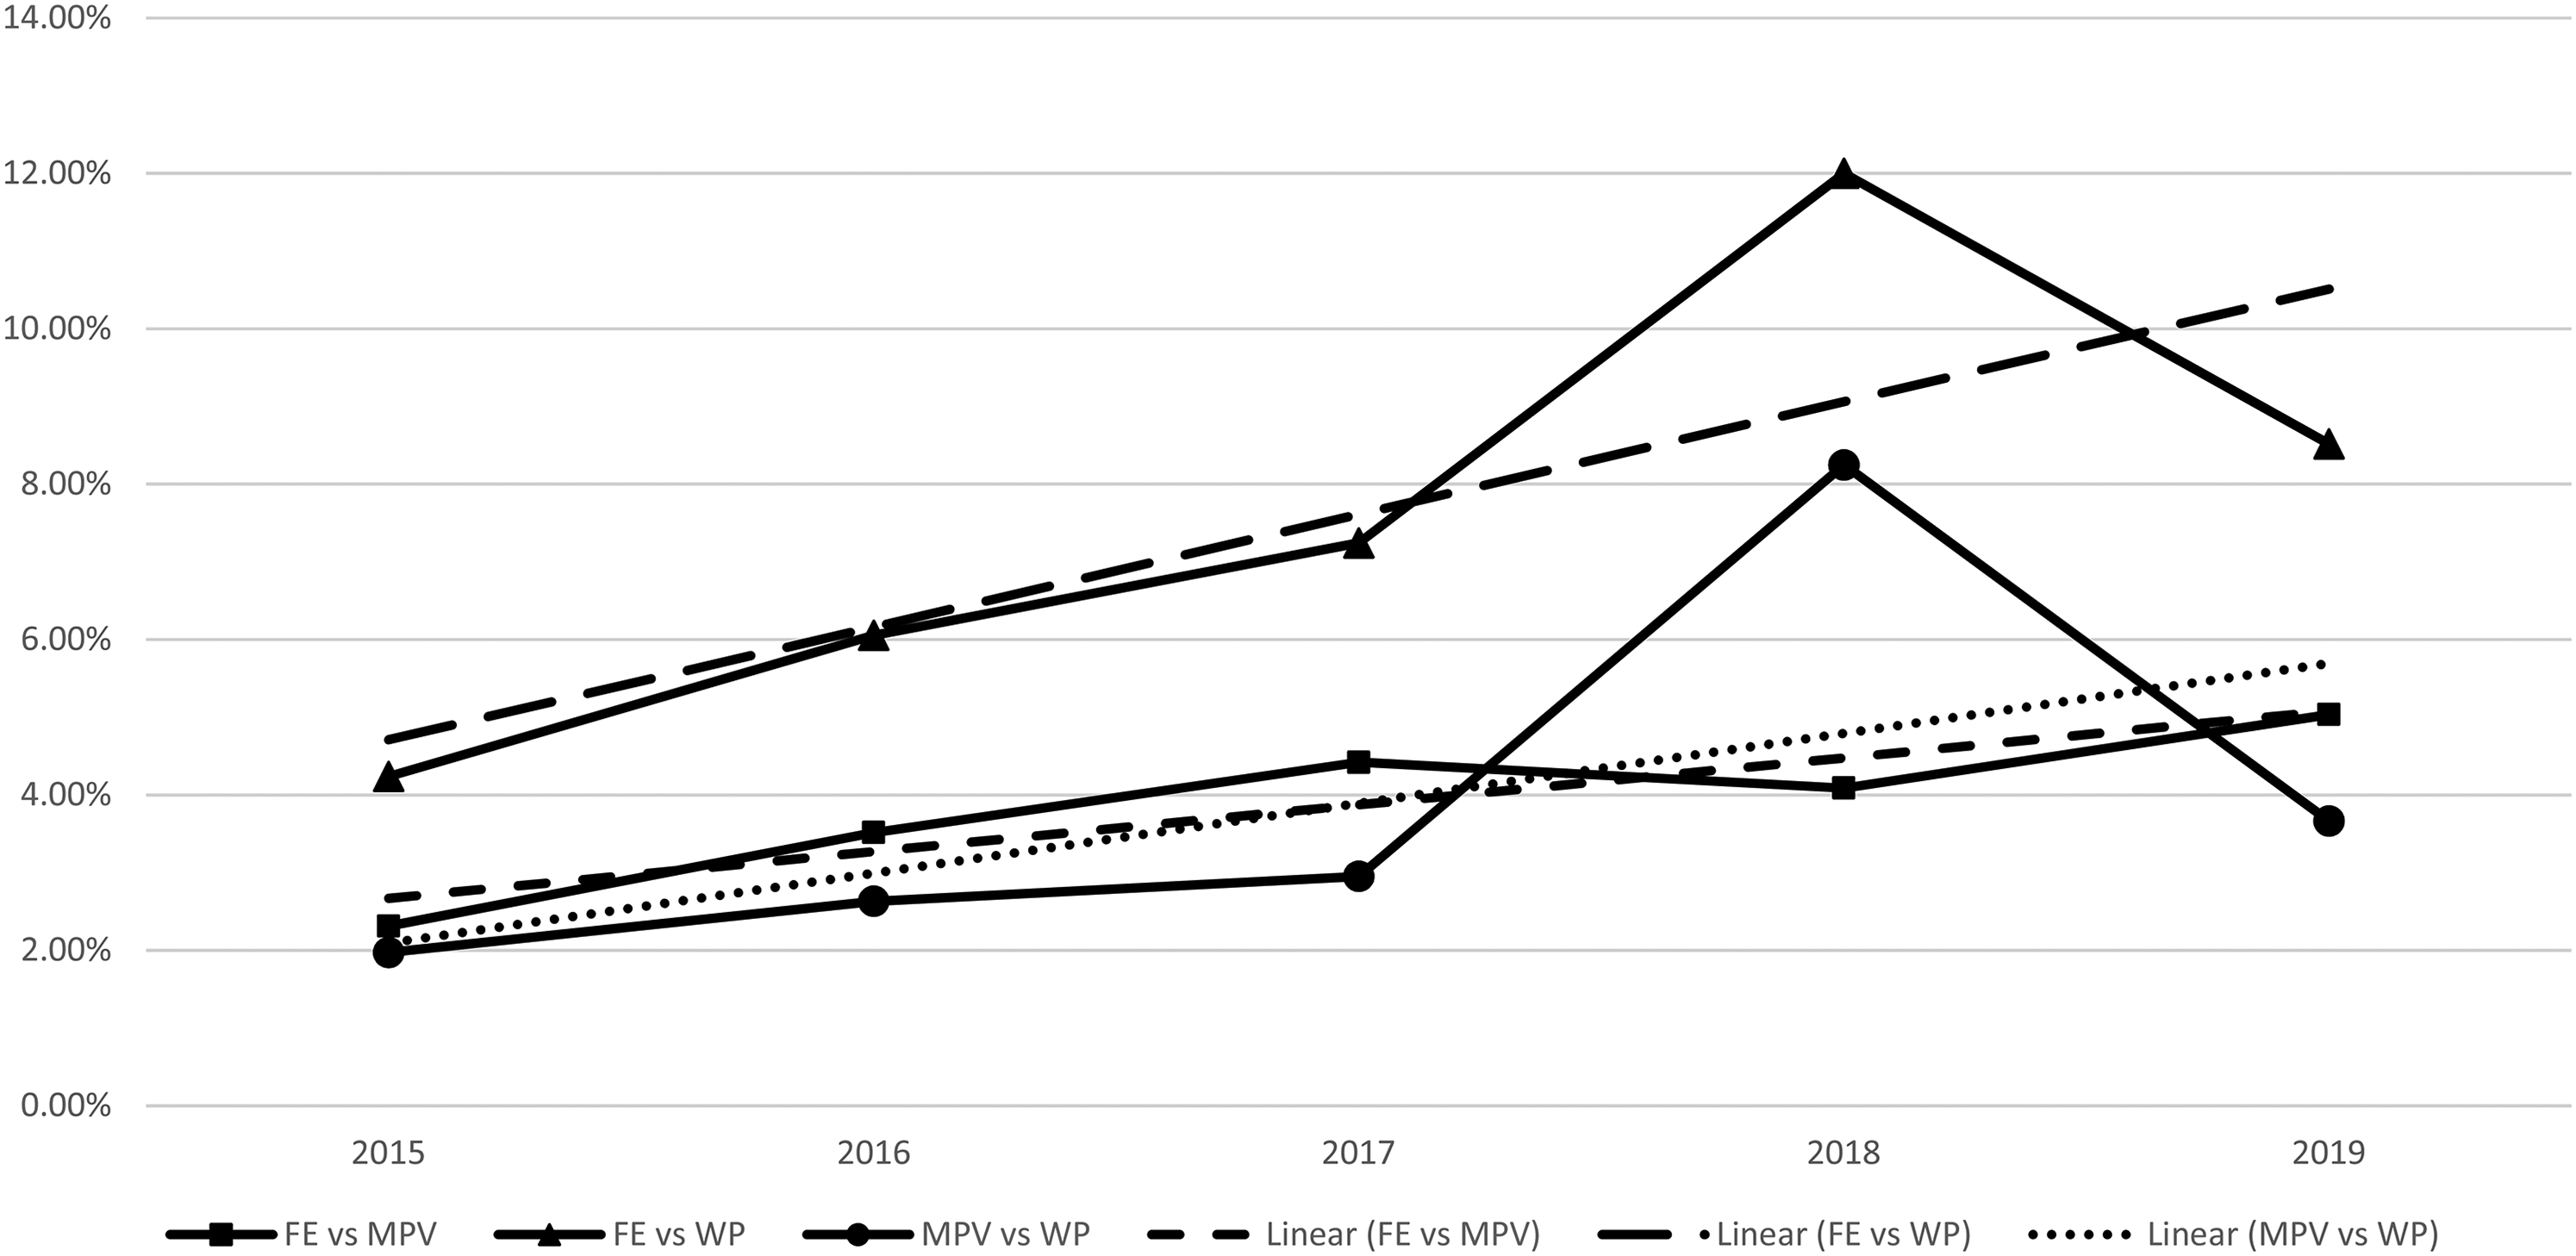
Dyad percentage differences in reported fatal police shootings 2015-2019.
As depicted in Figure 2, general linear trends suggest reported shooting percentage differences between all dyads have increased as time passed. For example, the FE-MPV linear trend (square line) shows that FE reported a higher percentage of shooting incidents than did MPV in every year compared and that this percentage difference increased with the passage of time. Specifically, the percentage difference between FE and MPV in 2015 was 2.31% and increased to 5.04% by 2019. Similarly, the percentage difference in reported shootings between FE and WP (triangle line) in 2015 was approximately 4.24% and increased to 8.52% by 2019. The largest percentage difference in reported shootings between FE and WP was 12.00% in 2018. Lastly, Figure 2 indicates that the percentage difference in reported shootings between MPV and WP (circle line) in 2015 was approximately 1.97% and increased to 3.66% by 2019. The largest percentage difference in the MPV-WP dyad occurred in 2018, with MPV reporting 8.25% more incidents in 2018 as compared to WP. Cumulatively, the results in Figure 2 suggest that each data source's proportional reporting percentages have diverged from each other over time.
Discussion
The purpose of this research note was to empirically assess similarities and differences among three open-source data sets (FE, MPV, and WP) from 2015–2019 by examining mean differences, correlational strength, and yearly percentage difference trends in fatal shootings perpetrated by on-duty officers. In doing so, three key findings emerged. First, the monthly mean comparisons indicated that even though FE had higher monthly averages than MPV and WP, and MPV had higher averages than WP, no significant differences existed between any of the data sources. With that said, if someone were interested in finding out how many fatal police shootings occurred since 2015 using public-data sources, it is worth noting that results could vary on average between 2–4 shootings per month if they chose to look at FE over MPV and between 3–11 shootings per month if they chose to look at FE over WP.
Second, bivariate correlations between all three data source dyads were consistently strong. With the exception of the correlation between FE and WP in 2018, all other coefficients were well above the standard threshold for strong and positive correlations. The strong linear associations observed between data sources suggest that researchers are likely to obtain similar results when using total counts or rates of total fatal police shootings as outcome variables, especially based on data from 2015–2017. Because each open-data source records different types of information, this finding is important for research that may need to rely on a specific data source to answer certain types of research questions.
Additional assessments were conducted to examine the moderately positive correlation between FE and WP in 2018 (r = 0.67). Based on the trend lines in Figure 1A, this observed correlation is likely a result of directionally divergent reporting between the two data sources in that year. The reported counts for FE and WP track each other linearly for the first five months of 2018 when observing frequency changes from month to month, meaning that as FE reported increases or decreases in counts between months, WP reported increases and decreases in counts between months that mirrored FE. However, beginning in June 2018, FE reported an increased count as compared to its previous monthly count, while WP reported a decreased count as compared with its previous monthly count. This divergence in reporting (one goes up while the other goes down) was observed for 5 of the 12 reported months in 2018, influencing the degree of correlation that year.
Next, we looked at counts of fatal police shootings captured by both WP and FE in September 2018 to see if there were any significant differences in the characteristics of the cases across the two sources. September 2018 was chosen as it was the most divergent month with FE reporting 86 fatal shootings while WP reported 55. Here, we matched cases across the two sources and compared them on incident and decedent characteristics. Bivariate tests were conducted (available upon request) and no significant differences were observed between cases that were captured in both datasets and the cases only recorded in FE across the following characteristics: decedent age, race, gender, sign of mental illness, or location of the shooting. Thus, the reported number of fatal police shootings by on-duty officers captured in FE that were not captured by WP in September 2018 are not attributable to comparable incident characteristics across the two sources.
Third, comparisons assessing percentage differences among data source dyads broadly revealed that the sources are becoming increasingly more dissimilar in their reporting of fatal shootings over time. The implications of these findings are worth noting since the only other study to report empirical comparisons among these three data sources indicated a high degree of coverage (Conner et al., 2019). Again, inter-comparisons among the three open-data sources were not the focus of that study and all comparisons were made based on one year of data in 2015. The current results, however, do reveal that the data sources have become more divergent since 2015. Even though there has been a strong linear association among the data sources from 2015–2019, increasing divergence in the data could potentially undermine future empirical findings that rely on different data sources and the implications that arise from these results.
Limitations
The current study is not without limitations. First, the results were based on aggregate counts of fatal police shootings captured by each open-data source matched by the incident date. Attempts to match specific shooting incidents across the data sources using additional characteristics (i.e., decedent name) were not taken. As such, misclassifications across data sources may still have occurred. For example, discrepancies in reported incident dates near the beginning or end of the month could have placed cases in different months of analysis. Because each data set has a unique methodology, interpretation of case facts may also lead to misclassification of incidents (Nix, 2020).
Additionally, the observed results could have been influenced by the chosen temporal units of analyses. Aggregating and disaggregating data influences the numerical differences between means and their statistical significance. To investigate these two potential issues, sensitivity analyses were conducted for the ANOVA and correlation results to determine if the observed results changed based on different temporal units of analysis (available upon request). The patterning of results were generally the same as those reported at the monthly level. Weaker correlations were generally observed at larger aggregate units (i.e., five-year averages) between the FE-WP and MPV-WP dyads. However, as the temporal unit changed from years to months to days, the correlations between these two dyads got significantly stronger. The same effect, however, was not observed for the FE-MPV dyad, which revealed strong positive correlations for all temporal units of analysis.
Second, the focus of this research note was to empirically assess how different each data source was compared to the others, not why they are different. We did not examine specific areas where the data sources may have differed from each other. For example, the current inquiry did not investigate whether differences in reported shootings existed across locations (larger versus smaller cities), racial/ethnic breakdowns of the deceased, or other decedent demographics. Future research could expand on this research note by making further comparisons between open-source data across other pertinent variables, such as race, ethnicity, or armed status (see also Baćak et al., 2019; Conner et al., 2019; Feldman et al., 2017a; Feldman et al., 2017b; Ozkan et al., 2018). Continuing this line of inquiry could assist researchers in finding out if the conclusions of an empirical question would be significantly different depending on which data source was used.
Conclusions
Continual calls have been made for the creation of a national database that accurately catalogues police use of force incidents, especially fatal police shootings. While this call remains unanswered, numerous government and public data sources have been created. Comparisons between open-source and government data reveal government sources report fewer incidents than open-source data (Baćak et al., 2019; Conner et al., 2019; Feldman et al., 2017a; Feldman et al., 2017b; Finch et al., 2019; GBD, 2019 Police Violence US Subnational Collaborators, 2021; Williams et al., 2019; Zimring, 2016). As such, researchers have increasingly relied upon open-data sources. Because of the tremendous influence these data can potentially have on research, police practices, and public opinion, inspections of the data across collection platforms are increasingly important.
The results of the current inquiry indicate rather strong convergence in monthly counts for three of the most commonly used open-source data (FE, MPV, and WP). With that said, some advantages and disadvantages for each data source were uncovered while conducting this research note. For those interested in studying fatal police shootings, the Washington Post has advantages as it has the most restrictive inclusion criteria for this outcome (see also Holmes, 2020; Nix et al., 2017). However, WP data include the fewest number of variables describing the characteristics of each incident in the downloadable data. For example, MPV includes draft information about the nature of the encounter, as well as the ORI agency identification number for the department involved. FE contains additional information about the dispositions and officers’ behaviors. In this regard, researchers interested in studying fatal police shootings may need to turn to either FE or MPV to answer their questions.
When this is the case, careful selection criteria should be used to ensure that fatal police shootings by officers is what is being captured. For example, in FE we uncovered 1,027 cases in the data where the cause of death was listed as “gunshot,” but the shooting was perpetrated by the decedent (i.e., suicide). While these are certainly fatal encounters in the presence of police (which is what the dataset captures), they are not fatal shootings by the police. Furthermore, 18 cases listed in both FE and MPV categorized as “off-duty” were, based on the case information provided, perpetrated by on-duty officers. As a result, it is important for researchers to understand the methodologies behind the inclusion of incidents, as well as the potential for misclassifications across data sources.
It is also important to note that the open-source data collection process is often dynamic with data sources continually adding information. The dynamic nature of this process can offer potential solutions to overcome disadvantages associated with any single data source. For example, MPV includes the identification numbers from both FE and WP in their dataset, potentially allowing for merging of data sources to capture additional variables. While this cannot address potential divergence issues across data sources (i.e., cases included in one dataset but not the other), it does offer a way to triangulate information across the common variables contained in both datasets.
Research could also use all three data sources collectively in studies as another method of triangulation. Renner (2019) used factor analytic methods to produce a reliable police perpetrated homicide construct estimated off of one open-data source (FE) and two government data sources (Supplementary Homicide Reports and NVSS). The GBD (2021) employed network meta-regression analysis to estimate the relative reporting biases between FE, MPV, NVSS, and the Guardian as well as the degree of underreporting between these open-source and government reporting modalities. Future work should continue to extend such approaches for the three open-data sources investigated here. With that said, it should also be noted that the dynamic collection processes also lead to lag times in reporting. For example, FE reporting of incidents lags by about a month in an effort to ensure the most complete documentation of incident-level information. As a result, it is recommended that researchers stop their analyses a few months prior to present day.
Finally, it is important to reiterate that the focus of the current inquiry was on fatal police shootings. How well open-data sources comprehensively reflect police use of deadly force remains unclear. By only capturing police-involved fatalities, they exclude incidents where deadly force was used, but did not result in death (e.g., off-target firearm discharges and non-fatal shootings). Research that has been able to compare fatal to non-fatal outcomes in police shootings has found that Black and younger people are significantly less likely to die as a result of being shot by the police. As a result, open-source data likely underestimate the use of deadly force by police (Nix & Shjarback, 2021).
In the absence of a national police use of force database, researchers will likely continue to rely on open access data. The current results indicate that three of the most commonly used open-data sources had strong convergence from 2015–2019 in terms of monthly counts of fatal police shootings. Although there were not any significant mean differences across the three sources, and - with one exception - linear associations were strong from year to year, there was evidence that each data source's proportional reporting percentages have diverged from each other, particularly in 2018. Increasing differences across sources could point to potential data issues in subsequent years. As such, the accuracy of open-data sources should continue to be investigated over time.
Footnotes
Acknowledgments
The authors would like to thank the anonymous reviewers and the editor for their helpful comments and suggestions that led to a stronger study.
Declaration of Conflicting Interests
The author(s) declared no potential conflicts of interest with respect to the research, authorship, and/or publication of this article.
Funding
The author(s) received no financial support for the research, authorship and/or publication of this article.
