



Abstract
National victimization data suggest less than 50% of violent crime incidents are reported to the police. Official reports of crime to police, however, are often the only type of data used for the analysis of violence problems, the identification of geographic concentrations of violent crime, and the selection of targets for police and prevention resources. Yet, the question remains, are estimates of violent crime prevalence and location distorted from a unilateral reliance on police data? Here, we examine whether emergency medical service (EMS) data collected by the fire department are spatially concentrated in the same way as police data and whether these data can help identify instances of violence unreported to police in the city of Seattle between 2009 and 2011. We find high levels of concentration in both police and EMS data and evidence that new information is learned about the location of violence problems from utilizing multiple data sources. Overall, these findings contribute to a small but growing body of work that demonstrates the utility of nonconventional data in the identification of crime and harm concentrations of interest.
Violent crime often goes unreported to the police. Results from the 2019 National Crime Victimization Survey (NCVS) suggest just 41% of violent victimizations were known by law enforcement (Morgan & Truman, 2020). While NCVS data show close to half of the robberies and aggravated assaults were reported to police, just one in three rapes and sexual assaults came to the attention of law enforcement. With an estimated 12.1 violent crimes per 1,000 people going unreported, police call and incident data are assuredly incomplete. The reasons why victims choose not to report to the police are complex and multifaceted (see Xie & Baumer, 2019, for a review). While the severity of violent crime generally makes it more likely to come to the attention of police than property crime, there are a host of individual and contextual factors that may impact whether police learn of an instance of violence. While this “dark figure” of crime problem has long been recognized in criminology (see Mosher et al., 2011; Schwartz & Vega, 2017), official reports of crime to police are often the only type of data used for the analysis of violence problems. In particular, place-based police violence reduction programs, such as hot-spots policing interventions, typically rely exclusively on police call and incident data for the identification of geographic concentrations of violent crime and the selection of targets for extra police resources (e.g., Ratcliffe et al., 2011; Rosenfeld et al., 2014; B. Taylor et al., 2011).
This raises important questions about whether police data alone accurately and fully identify hot spots of violent crime activity. Are other data sources useful in understanding the nature and location of violence? Here, we examine whether emergency medical service (EMS) data collected by the fire department can help in identifying the location and concentration of injuries caused by violence. Building on prior work that suggests EMS data are a complement to police data (Ariel et al., 2015; Hibdon & Groff, 2014; Hibdon et al., 2017; Telep & Hibdon, 2017), we examine violent crime calls to the Seattle Police Department (SPD) and EMS incidents involving violence in the city of Seattle for a 2-year period. We assess the extent of overlap in violence concentration at the community level, as well as at hot spots identified with each source, to better understand whether EMS data can help identify violence potentially unreported to police. We also examine whether combining EMS and police data results in the identification of new or different hot spots. After reviewing prior work on the concentration of violence using police and EMS data, we describe our data, methods, and results. We conclude with a discussion of the value of considering multiple data sources for violence prevention efforts, whether led by police or other groups.
Prior Research
A series of studies over the past 3 decades demonstrate that crime, as measured by police call or incident data, is highly concentrated at a small number of geographic locations (see Telep & Weisburd, 2018, for a review). The consistency of crime concentration in small geographic areas resulted in Weisburd (2015) proposing a law of crime concentration at the place, arguing that across cities, about half of crime will be located in about 5% of places. While the definition of place varies across studies, ranging from addresses (e.g., Sherman et al., 1989) to street segments (e.g., Weisburd et al., 2012; Wheeler et al., 2016) and to groups of street blocks (e.g., Weisburd & Mazerolle, 2000), the units chosen are all small. And at each level of geographic aggregation, crime is highly concentrated and such concentrations tend to remain stable over time (Weisburd et al., 2012). Considering concentration at these small geographic areas has value because such locations represent the exact contexts in which crime occurs and makes possible a deeper understanding of the dynamics surrounding crime (Nelson et al., 2001).
Concentration of Violent Crime at Place
Research examining crime concentration using disaggregated crime types has also revealed high levels of concentration, sometimes even stronger than overall crime. Given the emphasis of this article, we focus in particular on violent crime. Sherman et al.’s (1989) initial work using a year of call data in Minneapolis found violent crime calls were even more concentrated than calls overall. While about 3.3% of addresses produced 50% of all calls, just 2.2% of addresses produced all of the robbery calls during this period.
More recently, Braga et al. (2010) found that just 4.8% of street segments in Boston were the site of 73.9% of all gun assaults over a 29-year period. Close to 89% of street segments and intersections never experienced a firearm assault between 1980 and 2008. Braga et al. (2011) examined the concentration of robbery incidents at street segments and intersections during the same period. Each year, about 2% of street units accounted for 50% of the robbery incidents in the city.
In Chicago, Schnell and colleagues (2017) found that 50% of violent crime was found on between 5.5% and 7.2% of street segments between 2001 and 2014, suggesting levels of concentration more in line with overall crime. Haberman (2017) examined multiple violent crime types using 1 year of incident data from Philadelphia, finding 50% of street robberies were at 5.1% of intersection areas, while personal violence was slightly less concentrated, with half of the incidents at 8.1% of intersection areas. Schnell and colleagues (2019) examined the concentration of street violence (homicides, aggravated assaults, and outdoor robberies) in Newark between 2008 and 2013, identifying a high violence trajectory group that included just 3.6% of Newark street segments but 23.3% of street violence during the 6-year period.
Such findings have been replicated in other contexts. Violent crime was highly concentrated from 2010 to 2013 in Campinas in São Paulo, Brazil. Just 0.3% of street segments were the location of half of the rapes, and half of all robberies were found on 3.2% of street blocks. An evaluation of the law of crime concentration in Vancouver over a 4-year period found particular crime types were highly concentrated, and these concentrations were generally stable over time (Andresen et al., 2017). Specifically, 50% of assault and robbery offenses in Vancouver were concentrated to just 1% of street segments and intersections. However, Andresen et al. (2017) suggest using caution when examining the concentration of relatively rare crime types, such as robbery, which have a natural tendency to concentrate due to the lower number of robbery incidents than spatial units of analysis.
Recent research has also explored the extent to which crime variability across a jurisdiction can be explained at the street segment level. Neighborhoods, communities, and larger units of geography have been a frequent unit of analysis in criminological work examining violence (Wilcox & Cullen, 2018), and crime also concentrates at these larger units (Hipp & Williams, 2020). Research has generally found smaller units such as street segments explain much more of the variability of crime than larger units. This was the conclusion of the Schnell et al. (2017) study in Chicago reviewed above (see also Steenbeck & Weisburd, 2016). Andresen and Malleson (2011) similarly found much more longitudinal stability in violent crime patterns at the street segment level than at dissemination areas (similar to census block groups) or census tracts in Vancouver. Still, street segments alone do not explain the distribution of crime, and so understanding concentration and stability at the neighborhood or community level is also important for explaining crime patterns (see Hipp et al., 2017; Jones & Pridemore, 2019).
All of the studies reviewed here rely exclusively on official data on crime. Such data generally come from police departments and may include emergency calls for service (i.e., 911 calls), incident reports, and in a small number of studies, arrests. While such data provide important insights into the nature and distribution of crime, a smaller body of recent research suggests the benefits of also looking at alternative data sources to understand the concentration of crime and related problems (Telep & Hibdon, 2017). This includes recent work utilizing death reports from the coroner to understand the concentration of opioid deaths (Carter et al., 2019), social media data to understand changes in population by the time of day (Hipp et al., 2019), and geonarratives on perceptions of hot spots (Porter et al., 2020). Results from these studies suggest a need to move beyond a focus on police-recorded crime data alone. We focus in particular on EMSs data.
EMSs Data
There is reason to believe that EMSs data from fire departments or ambulance companies can also provide valuable insight into understanding the concentration of crime and related problems. As Giacomantonio and colleagues (2014) argue, location information provided in such data could be used by the police to identify hot spots and inform police resource deployment, particularly for areas where crime may be under- or unreported. Much like police, ambulances and EMSs are available on demand 24 hr a day through emergency numbers like 911. Paramedics, firefighters, and other members of ambulance crews serve on the front lines in crisis situations that can overlap with crime scenes. Seim (2020) notes the similarity of work between police officers and ambulance crews, arguing they “share a common task: temporarily cleaning up public spaces of the wounded, the nuisance, and the belligerent” (p. 103).
This similarity in work raises questions about whether ambulance data provide a unique data source relative to police data. We should, of course, expect some level of overlap between the two data sources. Clare et al. (2019), for example, looked at clustering of police, fire, and ambulance calls in Surrey, British Columbia over 3 years, and found a great deal of spatial and temporal overlap. They suggest certain areas, particularly those with high population density, are likely to have high service demand from any emergency service. Dong et al. (2020) did not look at ambulance data but did look at surveys of residents living in Baltimore violent crime hot spots versus non–hot spots. They found hot-spot residents had poorer overall self-reported general health and were more likely to report chronic health conditions. This would suggest the potential for ambulances to be present frequently in police-identified violent crime locations to address health rather than victimization issues.
We focus the current study just on ambulance calls related to violence. Here, we would again expect some overlap. In his quantitative analysis of more than 100,000 ambulance care reports from 2015, Seim (2020) finds that about 20% of callouts include police on the scene. About half of such instances are related to mental or behavioral health crisis situations. About one in five trauma-related calls involved police on the scene. These are likely to be clear violent crime situations in which both police and emergency medical personnel were dispatched. This suggests that most trauma ambulance calls do not involve a police response. Many traumatic injuries are not crime-related, but this reinforces that ambulance data do not necessarily just replicate what is known about violence from police data. Thus, while they sometimes end up together on scenes, police and EMS personnel come from distinct organizations with different priorities that respond to different kinds of emergency situations (see Hibdon et al., 2017). There may also be times when EMS intervenes in situations where a crime has occurred, but police were not dispatched, due to the severity of the incident or the potential that the victim or caller characterized the violence as being noncriminal to specifically avoid police intervention (Ariel et al., 2015; Seim, 2020).
Studies that have more directly compared police and ambulance data tend to show limited overlap between these sources. While not focusing on violence, Hibdon et al. (2017) did use data from Seattle in examining concentrations of drug activity over a 5-year period. They included police data on drug incidents and EMS data on drug overdoses. Their findings revealed that using either data source alone resulted in a loss of important information regarding the overall geographic extent of problematic drug use. While both sets of data suggested drug-related incidents were highly concentrated, there was only limited spatial overlap between these concentrations. Hibdon et al. (2017) argue that certain drug hot spots would be missed relying on either data source alone. These findings were similar to those from Hibdon and Groff (2014), who also found differing locations for police and EMS hot spots of drug activity using an earlier year of data.
Focusing on violence, A. Taylor and colleagues (2016) conducted a critical literature review, finding a small number of studies that have examined the use of ambulance data to reduce violence and, in particular, a small number of violence reduction interventions guided by ambulance data. They conclude that substantial numbers of violent incidents identified in ambulance data are not reflected in police data. Similarly, Philpot and colleagues (2019), in reviewing what is known about alcohol-related violence, argue less than one third of cases from the hospital or ambulance data also appear in police records. They caution that these “wide discrepancies…between police records and ambulance service data” raise questions about “the reliability of police data for analyzing the nature and extent of alcohol-related violence” (Philpot et al., 2019, p. 57).
Two prior studies from England are most relevant to our research questions. Ariel et al. (2015) used 1 year of police and ambulance data in Peterborough to map hot spots of violence and assault. They found a high degree of overlap, but also distinct police and ambulance hot spots. In concluding, they argue that the lack of overlap is more noteworthy because of hot spots that are not getting police attention: emphasis should not be on degree of overlap between crime and ambulance hotspots, but rather on the degree of lack of overlap. Our data suggest that nearly a fifth of ambulance hotspots—that is, small clusters of territory that experience at least 10 assaults in a year—are not recognised by the police as problematic areas that require attention. (Ariel et al., 2015, p. 311)
While we focus here on ambulance data, we also recognize that emergency room or department data have also been utilized to understand the dynamics of violence. Recent studies of gun violence in particular have utilized such data (e.g., D. J. Boyle et al., 2010; Richardson et al., 2016), given that gunshot wound victims may seek medical attention but want to avoid contact with the police. These analyses similarly find that hospital data uncover more violence than relying on police data alone. Melo and colleagues (2020), for example, compared the geographic distribution of rape cases from police and hospital data over a 4-year period in Campinas, Brazil. They found only about 50% overlap between the two sources, suggesting many victims seeking an examination following an assault did not necessarily alert police. Wu et al. (2019) attempted to match up violent injury incidents from an Atlanta trauma center to police reports from two nearby agencies over a year and a half period. They found a substantial proportion of hospital-treated injuries were not reported to police, estimating 83% of injuries did not have a matching police report in one agency and 93% in the other. Additionally, some incidents are likely to show up only in hospital data. In cases where someone has a violent injury but can self-transport to emergency medical care, there will be no call for an ambulance recorded.
Importantly though, ambulance or EMS data do have certain advantages over emergency room reports. For one, they provide a broader source of information on potential violence than emergency department records because some victims of less serious violence are either treated on scene or refuse transport to the hospital (Giacomantonio et al., 2014). For example, Quigg and colleagues (2017) found in their examination of 3 years of violence-related ambulance calls that about one third of the calls did not lead to transfer to an emergency room or other health provider. Thus, these incidents would not appear in hospital data. Additionally, emergency room data may not include geographic information needed for understanding incident concentration if such data are not collected or if patients are unwilling to share where an incident occurred. Lasecki et al. (2018), for example, used geographic information systems (GIS) to map the location of intentional injury emergency room cases over a 6-year period in Mobile County, AL. While they do identify concentration and four hot spots of assaults, they also note the challenge of only having geocoded address data for one third of the incidents.
Limitations of Prior Work
Prior research demonstrates that violence is highly concentrated using police data and such concentrations tend to remain consistent over time. We know less though about the additional information gained from EMSs data on violence and the extent to which these data also suggest geographic concentrations are stable. Studies utilizing both data sources suggest limited overlap in identified concentrations of violence, but this is based on just a small number of studies, all of which have relied on ambulance data from non-American contexts. Additionally, while prior studies from England have explored the extent of overlap, they have not made use of spatial statistics to compare concentration across data sources. Here, we add to the limited evidence base utilizing both police and ambulance data to understand the geographic distribution of violence by exploring concentration and stability at multiple units of analysis in a large American city.
Method
Data
We used calls for service data from two sources, the SPD and the Seattle Fire Department (SFD). Seattle is the largest city in the Pacific Northwest region of the United States and has grown rapidly in recent years. Its 2010 population of 608,660 increased to an estimated 2019 population of more than 750,000. The city has had generally lower rates of serious violent crime, particularly compared to similarly sized cities (see Weisburd et al., 2012, for more on longitudinal crime patterns in Seattle). For the 3-year period 2009–2011, Seattle recorded just 63 homicides total. We acquired call data with x and y coordinates and address information from both agencies for a 2-year period (July 1, 2009–June 30, 2011). Due to issues in acquiring EMS call types for a longer time period, we are limited to 24 months of data for the current analyses.
During this period, both agencies responded to a large number of total emergency calls. In 2011, the SFD responded to 77,304 total calls (SFD, 2012), while the SPD handled 255,753 citizen-initiated calls (see http://www.seattle.gov/police/information-and-data/calls-for-service-dashboard). Both agencies use computer-aided dispatch (CAD) systems. When a member of the public calls 911, they first reach the Seattle Police 911 Center. If the caller describes a fire or medical issue, they are then transferred to the Seattle Fire Alarm Center, which has its own set of call takers and dispatchers who work separately from the police (see https://www.seattle.gov/fire/about-us/about-the-department/resource-management/fire-alarm-center). Thus, while some calls might receive both a police and emergency medical response, SPD and SFD are operating separate call centers and CAD systems, and so our data represent overlapping but distinct collections of information about emergency situations in Seattle.
We chose a subset of call categories in each data set in an effort to restrict our analyses to instances where violence likely took place. Given the limited information available in call data, this is not always easy, but in both data sets, we tried to be conservative in choosing call categories that were most likely tied to violence and associated injuries. For the SPD data, we used calls on assaults, fights, domestic violence, child abuse, rape, and robbery. We removed calls coded as duplicates or canceled but left them in all other call dispositions. For the SFD EMS data, we looked at calls coded as beating/fighting/assault, blunt instrument, child abuse, domestic violence, firearms, sexual assault, sharp instrument, and strangulation. While we pool the 2 years of data in our results, in Table 1, we list counts by call type for each year of the study. We focus on calls, rather than incidents, to provide the broadest set of cases where violence may have occurred. Two additional shapefiles are used for the analysis. The first is a community file, representing 91 designated community areas, obtained from the online data portal from Seattle City Clerk (see https://data.seattle.gov/land-base/city-clerk-neighborhoods/bypb-dve9). The second is a street file, containing data on 24,023 street segments, acquired along with the call for service data from the SPD. 1
Counts of Calls by Type.

Note. SPD = Seattle Police Department; EMS = emergency medical service.
Once the appropriate call types and dispositions were selected, we first pooled the 2 years of data and created point shapefiles. 2 Given the relative similarity in call counts across the 2 years, combining our 24 months of data generates more stable estimates and simplifies the presentation of results below. To obtain counts for the areas of interest, the point files for each data set were spatially joined to both the community polygons and street segment polyline files. Events at intersections were 22% of reported events in the SPD data. Consequently, these events could not be dropped from the analysis, but they also had to be dealt with in a way so that each event would not be counted at each street it touched. We followed the protocol established in prior work (see Hibdon et al., 2017) and tallied the number of events at each segment and then divided that number by the total number of street segments adjoining at the intersection. This number was then summed to the count of SPD calls occurring on the street alone to obtain the most accurate record of violent offenses known to police. EMS events were matched by x and y coordinates provided in the data and spatially joined to the nearest street segment.
Analytic Approach
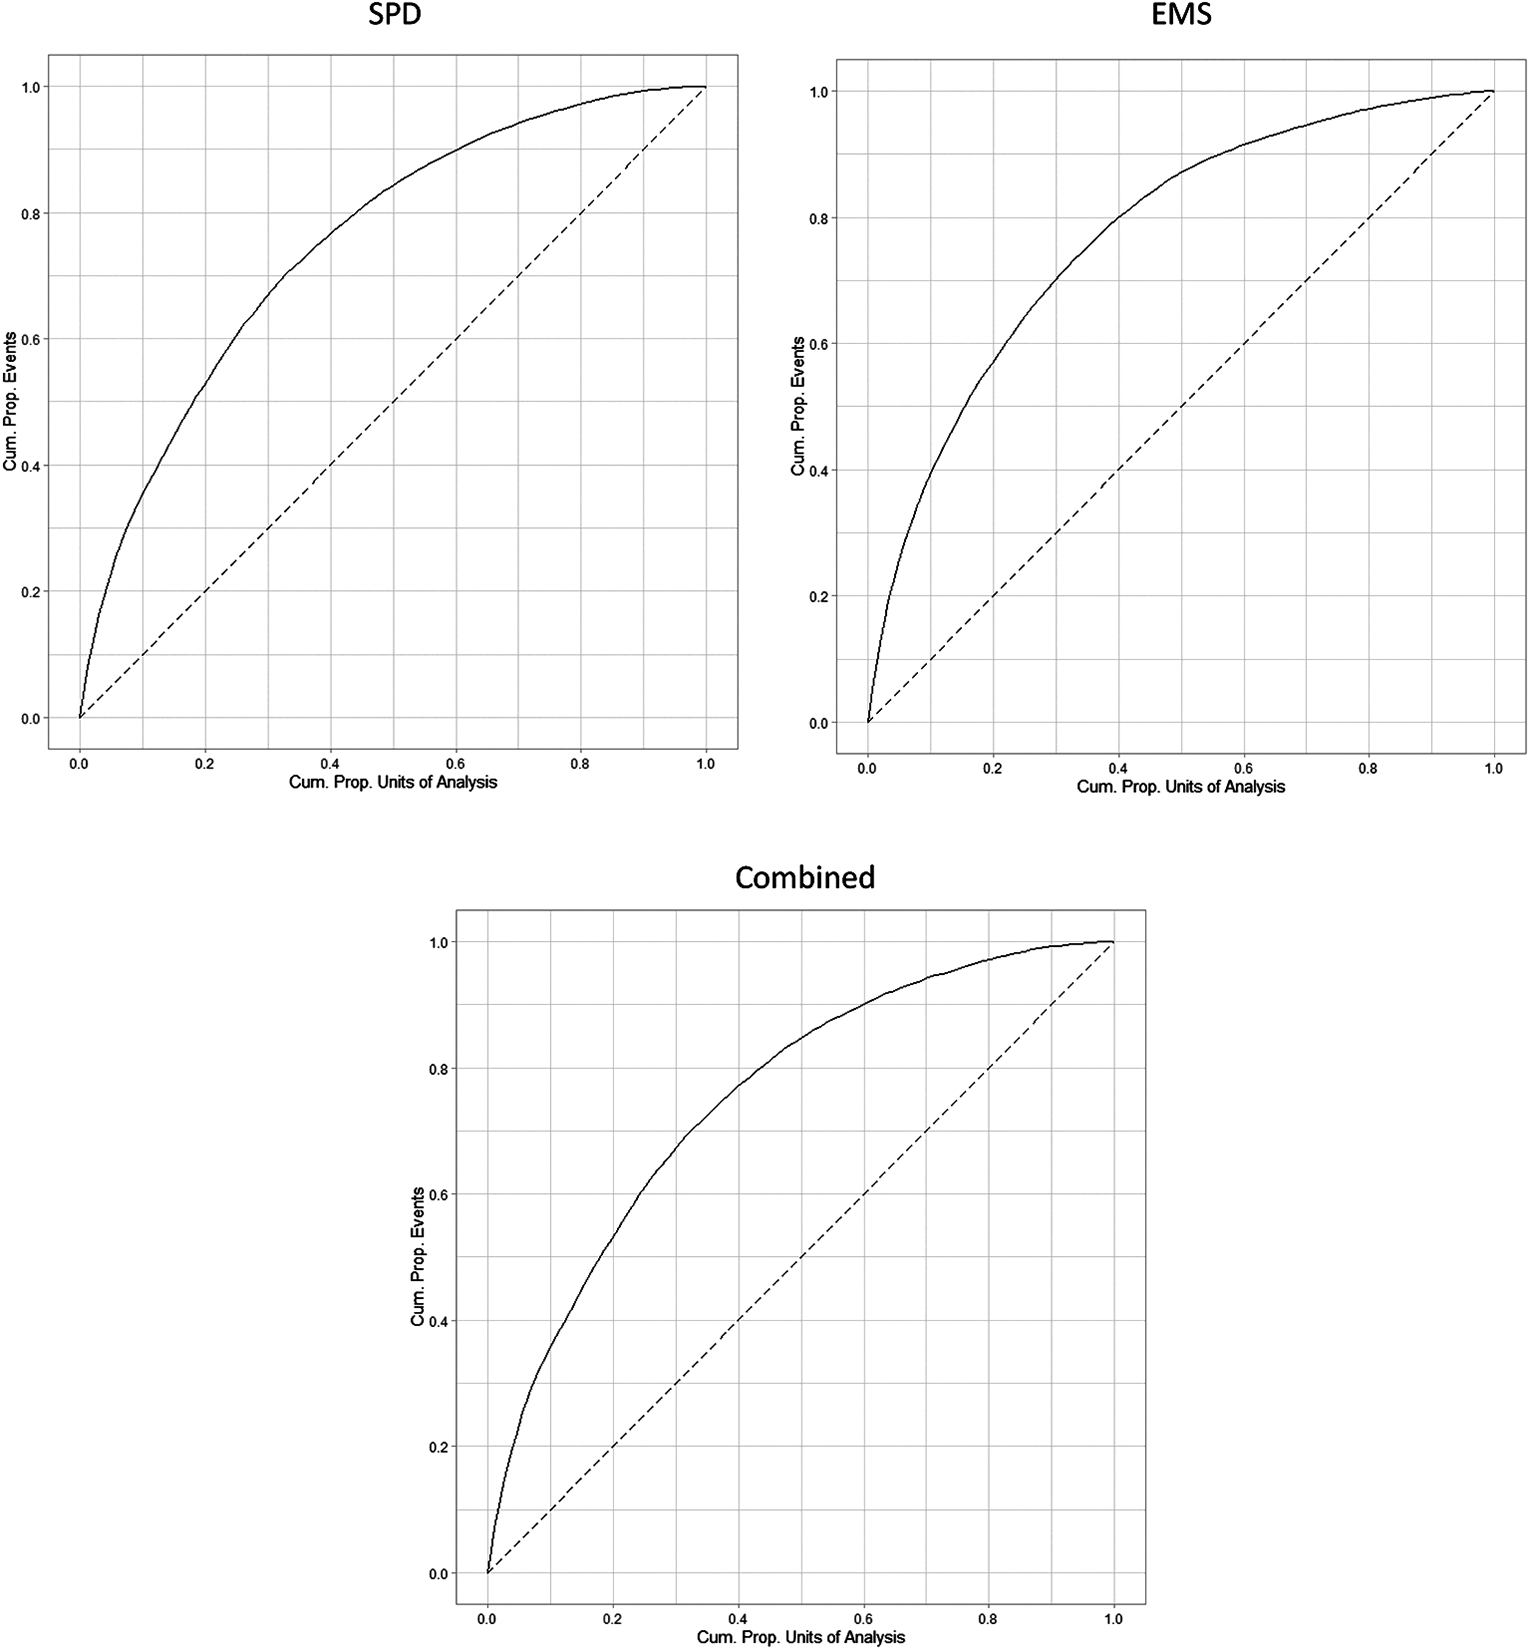
Recall our objectives are to assess the concentration of SPD and EMS data, the degree of overlap between SPD and EMS calls, as well as determine if combining the data sources helps identify places that would not emerge as hot spots in police data alone. To accomplish our objectives, we employ a variety of techniques. First, examine concentration using generalized Gini coefficients and Lorenz curves (see Bernasco & Steenbeek, 2017) as well as the percentage of street segments for traditional concentration points (25%, 50%, and 100%). The generalized Gini coefficient and Lorenz curve are a way to assess crime concentrations, specifically in circumstances where the units of analysis (i.e., geographic area) outnumber the number of events (i.e., reported violence). The generalized Lorenz curve illustrates the distribution of the number of events (i.e., reported violence) within the units of analysis (e.g., geographic area). The visualization for the generalized Lorenz also includes a line that represents maximum equality (or perfect randomness) for data where the number of events is fewer than the geographic areas (represented by c/n). The generalized Gini coefficient is the ratio of the area between a Lorenz curve and the line of maximum equality and can range in value from 0 to 1, with higher values representing stronger concentrations in fewer places. The lorenzgini package was utilized to run the analysis in R (Steenbeek, 2019). 3
Additionally, we employ the spatial point pattern test (SPPT), which assesses the degree of similarity between point patterns in a set area. The SPPT is a global statistic that represents the proportion of times the two-point data sets are similar for the spatial units (e.g., areas of interest). The SPPT has been utilized to assess differences in spatial patterns of different crime types (Andresen & Linning, 2012), in crimes across years (Hodgkinson & Andresen, 2019), in patterns at different units of analysis (Andresen & Malleson, 2011; de Melo et al., 2015), and across different sources of data (Hibdon et al., 2017). Recently, a strengthened, modified version of the SPPT was proposed, which uses a difference of proportions at each unique place rather than confidence intervals (see Wheeler et al, 2018). Here, we use the χ2 estimations for proportion differences with no adjustment for p values to estimate the global S values. For this analysis, we used the community areas as well as 7 m buffers around street segments and intersections to assess point pattern similarity between SPD and EMD data for our combined 2 years of data. 4 Additionally, the global S is computed for the streets concentrated with 25% and 50% of police and EMS calls, respectively. The SPPTs were run using the SPPT package for R (Steenbeek et al., 2020). 5 We report both the standard and robust global S values but rely on the robust estimates since they exclude designated geographic areas that have 0 events in each of the point files being compared.
Last, to assess the degree of change in specific locations based on data sources utilized, we examine the top 19 street segments for EMS calls based on our 2 years of data. We note that we initially identified 25 segments based on streets with 15 or more EMS calls in 2009–2011 but removed six segments to focus on the 19 that make the best potential targets for prevention or intervention programs. 6 These segments include a mix of retail and residential uses, with some parks. We compare the rank of these streets using just EMS data, just SPD data, and a combined count of EMS and SPD calls. Here, our interest is in understanding what additional information we are learning about high call streets from the EMS data. We describe how the streets differ in rank by data type (i.e., are high EMS call streets also high SPD call streets?) and use Kendall’s (1938) rank correlation coefficient (τ b ) to examine the extent of similarity in ranks across data sets. We highlight streets where the combined data lead to a rise in rank compared to just SPD data, suggesting segments that would be more likely to be targets of prevention efforts when utilizing multiple data sources.
Results
Diagnosing Concentration
Table 2 includes our Gini coefficient calculations for both the community and street segment levels for all data sets. Recall a Gini coefficient of 0 would indicate that every unit of analysis (e.g., community or street segment) would have an equal amount of violent event calls whereas a coefficient of 1 suggests that all of the violent event calls are concentrated at just one unit of analysis (e.g., community or street segment). Thus, the closer the value to 1, the more concentrated the violent call events. The left side of the table represents the calculated Gini coefficients for the community analysis and the right side of the table reports the generalized Gini coefficients for the street segment analysis. Figure 1 illustrates the Lorenz curves for the community analysis.
Community and Street Segment Gini Coefficients.

Lorenz curve for community counts.
First, in looking at the community results, the Lorenz curves and the Gini coefficients appear to be very similar for SPD data and EMS data, and when using the data together—ultimately suggesting the data concentrate within these units similarly. Note, however, these metrics do not tell us anything about the patterning of concentration, only about strength. Additionally, the community analysis seems to suggest that EMS data are slightly more concentrated than SPD data; however, when used in combination with SPD data, estimates of concentration improve slightly.
The results for the street segment analysis suggest that like prior studies examining micro-place concentrations, the SPD, EMS, and combined data are highly concentrated, with SPD data having stronger concentration than the EMS data. Note the generalized Lorenz curves in Figure 2 and the line representing the adjusted maximum equality (e.g., c/n). Table 3 reports traditional concentration cutoff points of 25%, 50%, and 100% concentration. Note SPD calls appear to be more strongly concentrated when examining streets with 25% and 50% of call volumes. EMS calls appear to be more dispersed, and when the two data sources are combined, the call percentage of street segments containing 25%, 50%, and 100% of calls grows. Ultimately, the data point to highly concentrated but potentially different dispersion patterns.

Lorenz curve for street segment counts.
Percentage of Street Segments Containing 25%, 50%, and 100% of Calls.

Figure 3 illustrated the street segments with the highest concentration (top 25%) of police and EMS calls for service. In the figure, streets that contain high volumes of police calls are represented with blue and those that contain high volumes of calls for EMS are in red. Streets that contained high concentrations of both police and EMS calls for service are shaded purple. The map demonstrates that while some overlap exists, there also appears to be considerable differences between the concentrations identified in the two data sets.

Location of top 25% of streets for emergency medical service (EMS) and Seattle Police Department (SPD) calls with indication of streets in top 25% for both data sources.
Overlap in Data Sources
The SPPT results are reported in Table 4. According to Andresen (2016), a SPPT value of 0.80 indicates strong similarity in spatial point patterns. The results for both community and street segments suggest that there is a moderate to strong similarity in the police and EMS data for the 2 years of the study. The global S value when comparing police calls to EMS calls within community areas is 0.747. This value was the same for the standard and robust calculation as there were no communities with zero calls in both data sets. The robust global S value that examines the streets which contain 100% of both SPD and EMS calls is relatively high at 0.916. However, given that violent events counts are lower than typical crime counts and likely concentrated within the high number of street segments in the city, we also examined whether there was similarity in the smaller proportion of streets which contained 25% and 50% of police and EMS calls. Interestingly, when just these streets are compared, the robust global S value drops to 0.529 for streets containing 50% of calls and 0.435 for streets containing 25% of calls, suggesting that in this case, the test is sensitive to a number of street segments with very low call volumes (i.e., high counts of segments with one call). Again, these results point to moderate point pattern similarities but also confirm there are differences in patterns in streets that contain the highest volume of calls for each agency.
Global S Values for Communities and Street Segments.

Note. SPD = Seattle Police Department; EMS = emergency medical service.
Shared Hot Spots
In Table 5, we include our table of 19 high EMS call segments with their ranks in SPD data and when adding SPD and EMS call counts. We note that the EMS ranks exclude some segments that were not appropriate for police or other prevention intervention. We also include the difference in ranks between EMS and SPD data sources. Overall, we see variability in the extent to which EMS and SPD high call streets are similar. While the top 7 segments are high call locations in both data sets, we also identify nine segments (bolded in Table 5) that show more substantial differences between rank in the SPD and EMS data sets and which show a rise in ranking in the combined data set relative to relying just on police data. This is important, as these are segments that are less likely to be identified as targets for intervention using only SPD call data. As one example, the 2100 Block of 1st Ave. ranks 81st among all streets using SPD data alone, but because it has the 18th highest count of EMS violence calls, it moves to 46th citywide using the combined data set. Overall, 16 of the 19 segments in Table 5 saw a rise in their ranking in the combined data set relative to SPD data alone. Thus, even among streets that generally had high police call counts, the addition of EMS data can help prioritize resources for locations with more injuries due to violence. These results are visualized in Figure 4, which maps the location of high EMS call segments and indicates those segments that increased in rank when combining EMS and SPD data relative to just SPD data. Figure 4 also demonstrates that most of these high EMS call segments are concentrated in the downtown area.
EMS, SPD, and Combined Call Counts and Rank Order for Highest EMS Call Segments (2009–2011).

Note. Segments where the rank moved up more than 10 spots comparing SPD data to combined data are bolded. Mixed use streets generally are in the downtown area and include a mix of retail and residential. SPD = Seattle Police Department; EMS = emergency medical service.

Location of high emergency medical service (EMS) call streets and streets that increase in total call rank.
Our results from the Kendall’s rank correlation coefficient tests reinforce our findings from Table 5 that while some streets are similarly ranked across data sets, there is a great deal of variability, and EMS and SPD data are not simply repeating the same story. The τ statistic would be 1.0 if the ranks were identical across data sets. We see moderate correlations between a street’s rank in EMS data and SPD data (τ = 0.45) and between EMS data and the combined SPD and EMS data (τ = 0.50). Not surprisingly, given that there are more SPD calls, there is a higher correlation between rank in SPD data and the combined EMS and SPD data (τ = 0.95).
Discussion and Conclusions
Overall, our findings suggest police and EMS data each provide unique information about the concentration and distribution of violence across locations and communities in Seattle. We find both types of calls are highly concentrated, and while we do find some overlap between locations of EMS and SPD calls, we also find dissimilarity in the location of violence concentrations. Here, we discuss the reasons for our findings and the implications and limitations of our work before concluding with a call for greater use of EMS data in criminal justice research. These findings support recent conclusions from UK studies that suggest there is little overlap in violence records (Sutherland et al., 2017) and which point to the utility of using police and EMSs to better understand spatial patterns of violence (Ariel et al., 2015).
Given that violent crimes where someone is seriously injured are likely to lead to a response from both police and emergency medical personnel, we are not surprised to see some level of overlap between the two data sources, particularly when looking at the highest count segments. But even in this group, there are still a number of blocks that rank high in EMS violence calls but not as high in SPD calls. In these cases, the inclusion of EMS data may help prioritize areas that are either resulting in more injuries or represent locations that are less likely to mobilize police services. Our citywide assessment also suggests a general lack of overlap at the street segment and community level. This reinforces the relevance of EMS data but does raise questions about why we do not see more overlap. These questions require additional research to understand better the behaviors of victims and 911 callers to understand how they signal the need for a police or ambulance response as well as the actions of 911 call takers for both police and fire departments, who must interpret requests from callers and make decisions about how to dispatch calls.
We suggest that locations identified as “high violence” through either EMS calls alone or a combination of SPD and EMS calls are important potential sites for further focus and intervention. Given that criminal justice interventions tend to rely on police data alone, it is likely EMS data can shed additional light on violence issues that may not always be coming to the attention of police. Additionally, even for streets where call levels are consistent across sources (i.e., high violence in both EMS and SPD data), EMS call data and records can provide additional insight into the nature of problems on a particular block. We suggest crime analysts and police agency researchers make more use of these data, particularly in the context of problem-oriented policing projects, as a tool for carefully and thoroughly analyzing violence problems. In cases where dispatching for police and fire is done by the same emergency communications center, EMS data should be more easily accessible to police. But even in cities like Seattle, where fire and police use separate call centers, data sharing agreements and regular communication about high call locations should be prioritized.
There are already some examples of successful uses of police and medical data. In the case of EMS data, recent work by Tainter and colleagues (2020) linked EMS records on traffic crashes to police-generated accident reports in Massachusetts to capture the impact of collisions. The authors suggest the “linked dataset in this project served many purposes, from research and trend identification, to surveillance and policy-shaping” (Tainter et al., 2020, p. 14). A similar approach for violence calls could prove useful. The National Emergency Medical Services Information System (NEMSIS Technical Assistance Center, 2020) represents the largest source of EMS calls in the United States. While participation is voluntary, NEMSIS includes call data from more than 10,000 agencies in 47 states (see https://nemsis.org/). Given the amount of data collected, there is also great potential for NEMSIS to inform the location and development of violence reduction interventions. To our knowledge, NEMSIS has been used infrequently by criminologists and police practitioners. While data access at the jurisdiction level requires further approvals, NEMSIS has been utilized in prior studies of violence published outside criminology. Klassen and colleagues (2019), for example, matched up NEMSIS and Federal Bureau of Investigation (FBI) data to examine the EMS response to mass shooting events over a 2-year period. Their analyses provide additional detail on victims, extent of injuries, location of wounds, and treatment provided on-site that would be unavailable with police data alone.
Outside of EMS data, A. A. Boyle and colleagues (2018) provide an example of hospital emergency departments sharing information about the location of violence incidents with police to inform prevention efforts. Over a 10-year period of information sharing at a single hospital in Cambridge, UK, assaults declined 37%. The authors caution this may be due to factors other than the information sharing, but these findings are suggestive of the benefits of further data sharing between police and emergency health personnel (see also Kollar et al., 2020).
We stress that the analyses we conducted here were all designed to be easily interpretable and usable by analysts and practitioners. We completed all analyses for this article using software that would commonly be available to analysts (ArcGIS, Microsoft Excel, and R), and thus we believe the incorporation of EMS data into crime prevention work could occur fairly seamlessly using existing resources. While we acquired point-level data directly from SPD and SFD, the City of Seattle makes police call data publicly available at the street block level and fire call data at the address level (see https://data.seattle.gov/). Though these publicly available data do not have the same level of detail, much of our analysis could be replicated even without acquiring data directly from an agency. But we suspect that police departments in particular would have an easier time than we did in acquiring longitudinal EMSs data (particularly in cities where police and fire share an emergency call center). While we could not directly link SPD and SFD data to a particular incident, crime analysts would likely have more success in matching EMS data to their own calls and records, particularly in instances in which there is a suspect’s or victim’s date of birth available. We hope to see other researchers and agencies replicate these analyses in other contexts to provide further insight into the value of EMS data for understanding the spatial distribution of violence.
We emphasize two additional important points related to our findings here. First, we recognize that violence concentrations on their own do not necessarily mean a street is dangerous or that visitors and residents are at high risk of victimization. Because we rarely have precise population estimates at the street block level, we cannot accurately calculate crime rates at these small units of geography, making it more challenging to understand how context and population density play into crime concentration at the street block level (Telep & Hibdon, 2017). Other sources of data though, including estimates of ambient population and data from social media and smart devices can help moving forward in generating more precise estimates of risk (see Malleson & Andresen, 2015). We also suggest the value of looking at the harm generated by violent incidents (Fenimore, 2019; Weinborn et al., 2017), whether they be recorded by police or EMS. There is generally more harm associated with violence, but using crime harm indices for police data and considering how to adapt those tools for use with EMS data would be useful in future work.
Second, while we think police can make better use of EMS data in their violence prevention efforts, we emphasize that interventions in areas with concentrated violence do not have to be police-led or even police-involved (see Weisburd et al., 2014). Given the current policy context in Seattle and around the United States with concerns surrounding police contributions to violence problems and the amount of funding dedicated to police agencies, we suggest that community-led violence prevention programs may be an easier sell to policy makers and funders. There is also a growing body of research suggesting nonpolice-led programs in small geographic areas can successfully reduce crime. In an example from Seattle, Telep and Hibdon (2018) found two hot-spots projects led by a nonprofit crime prevention organization were associated with declines in total calls for service in one site and drops in disorder in both sites. More directly related to violence, recent evaluations of community-driven greening initiatives suggest links between beautification and blight cleanup efforts and reductions in both violent and property crime (Garvin et al., 2013; Pizarro et al., 2020). Similarly, Sharkey and colleagues (2017) found a causal relationship between the number of crime prevention–focused nonprofits in a city and violent crime.
Limitations
We recognize the limitations in our work. Due to issues in acquiring EMS data on violence events, we use only 2 years of data from a decade ago. We hope in the future to be able to acquire more comprehensive EMS data over a longer time span to further explore the questions we addressed here. We also understand the limits of calls for service. While these data give us a sense of violence problems and their geographic concentration, we do not have sufficient detail to understand fully the dynamics of each police or EMS call. In particular, EMS call categorizations make determining if an event was an accident or an intentional injury challenging. While we can be more confident that events involving a fight or a gun are linked to violence, calls involving a sharp instrument, for example, could refer to a stabbing or to a knife accident in the kitchen. Thus, we are likely including some EMS calls that are not violence-related, while excluding others that may have been connected to a violent crime event but were coded, for example, as a fall. We also recognize our EMS violence measure is limited to the portion of cases where injuries are severe enough that an individual needed assistance with medical aid. In many cases, violence events are unreported to police or EMS and victims may be able to visit their doctor or a hospital without EMS assistance or do not need or seek treatment at all. We are also aware call data include more error than incident data. We chose call data both because of data availability from SFD and because we wanted the broadest possible view of violence problems across the city.
Conclusion
Overall, these findings contribute to a small but growing body of work that demonstrates the utility of nonconventional data in the identification of crime and harm concentrations of interest. EMS data on violence, like police data, show high levels of concentration at particular street segments, but in a number of cases, these concentrations are geographically distinct from police-generated call data. We encourage other researchers and crime prevention practitioners to make use of EMS data, when possible, in making decisions about locations for intervention and prevention programs. To understand fully the nature and distribution of violence problems in a jurisdiction, EMS data can be an important piece of the puzzle and help inform reduction efforts that ideally will be more effective and efficient.
Footnotes
Acknowledgment
We thank Seattle Police Department and Seattle Fire Department for providing the data used in this article.
Declaration of Conflicting Interests
The authors declared no potential conflicts of interest with respect to the research, authorship, and/or publication of this article.
Funding
The authors received no financial support for the research, authorship, and/or publication of this article.