
Abstract
Relative to other cognitive areas, there are few clinical measures currently available to assess social perception. A new standardized measure, the Wechsler Advanced Clinical Solutions (ACS) Social Perception subtest, addresses some limitations of existing measures; however, little is known about this new test. The first goal of this investigation was to preliminarily explore the relationship of the ACS Social Perception subtest to five other measures of social perception and cognition in a sample of control subjects and individuals with Asperger Syndrome and schizophrenia. A secondary goal was to preliminarily explore the differences between groups on six measures of social perception and cognition. Results revealed several significant correlations between the ACS Social Perception subtest and other measures of social cognition, and some evidence for the distinguishing abilities of the measure. The ACS Social Perception subtest appears to be a promising measure for the evaluation of social perceptive skills.
Social perception involves a variety of cognitive components, including attention, perception, and interpretation of a range of socially relevant cues. These cues include verbal and nonverbal stimuli such as facial expressions, gestures, and speech prosody, in addition to others such as body language, interpersonal distance, and body movements (Ekman & Friesen, 1969). The perception of this social information is important to daily functioning and personal success. Specifically, these social perception processes are relevant to the way an individual experiences social interactions, subsequently behaves (Couture, Penn, & Roberts, 2006), and is perceived. It is therefore not surprising that social perception is related to social competence (Karow & Connors, 2003), social behavior (Brune, 2005a), and social integration (Knox & Douglas, 2009). Obtaining a quantitative evaluation of an individual’s social perception skills may represent a useful adjunct to assessing other cognitive strengths and weaknesses. Although several social perception measures are available to assess various aspects of social cognitive skills, few have large-scale normative reference values and little is known about their psychometric properties or their relationships with other cognitive indices.
Impairments in social perception are well documented in disorders associated with cognitive social deficits. Autism Spectrum Disorders, such as Asperger Syndrome (ASP), are commonly reported to include impairments in ability to recognize affect and facial emotional expression (Ashwin, Chapman, Colle, & Baron-Cohen, 2006; Sasson, 2006), as well as demonstrating impairments in theory of mind (ToM; Baron-Cohen, Wheelwright, Hill, Raste, & Plumb, 2001). Individuals with schizophrenia (SCZ) often present with impairments in affect recognition and ToM (Brune, 2005a; Pinkham, Penn, Perkins, & Lieberman, 2003; Wolwer et al., 2005). In addition, these populations may show difficulties in identifying prosodic intonation and a speaker’s intent (Brune, 2005b; Kujala, Lepisto, Nieminen-von Wendt, Naatanen, & Naatanen, 2005). Appreciating the social cognitive and perceptive skills in these populations is necessary, especially in treatment planning (Penn, Sanna, & Roberts, 2008).
Despite the importance of social perception skills to successful human interactions, the quantitative assessment of these skills poses a number of challenges. It has also been noted that not only are there few clinical measures available for the assessment of social perception but also psychometrically sound measures are generally lacking for the evaluation of social perception (Banziger, Grandjean, & Scherer, 2009; Bell, Fiszdon, Greig, & Wexler, 2010; Green et al., 2008; McDonald, Flanagan, Martin, & Saunders, 2004; Vaskinn, Sergi, & Green, 2009). In fact, most assessments of social perception are unimodal, assessing one type of stimuli or process, and many rely on emotion recognition from faces. For example, measures of prosody are often not incorporated in social perception tasks even though prosodic cues play an essential role in the perception of vocally communicated emotions (Scherer, 1986) and increase the level of difficulty in recognizing emotions (Ariatti, Benuzzi, & Nichelli, 2008). Limitations in many of these measures, such as psychometric and stimulus shortcomings, as well as limited or nonexistent norms, hamper clinical utility.
The recent Social Perception subtest of the Wechsler’s Advanced Clinical Solutions (ACS; Pearson, 2009) was developed to assess multiple aspects of social cognitive processing and addresses some of the limitations noted above. The ACS-SP provides opportunities to assess basic to more complex emotion recognition from faces and voices, including higher order meaning, such as sarcasm. The stimuli were designed to “require cross-modal integration” across the three sections. Initial psychometric properties and clinical utility of the ACS-SP test are promising (Pearson, 2009). The normative sample included 800 individuals between the ages of 16 and 90 with race and ethnic proportions similar to the 2005 census. In addition, data from 15 clinical groups are presented. As expected, preliminary data from ASP and SCZ samples revealed significantly lower scaled scores compared with controls, even when overall level of cognitive functioning was statistically controlled. Moderate to high internal consistency were reported for most ACS-SP scores, and test-retest was found to be stable, with good interscorer agreement. Validity was examined between ACS-SP subscales and cognitive, achievement, memory and adaptive functioning measures. Furthermore, the majority of correlations with cognitive and memory tests were low. However, it is unclear how the ACS-SP relates to other measures of social cognition and perception.
The primary aim of the present investigation was to examine the relationships between the new ACS-SP test and existing measures of social perception in a mixed sample of clinical groups known to demonstrate difficulties with social cognition. A secondary aim explored the utility of the ASC-SP test in special populations known to have social deficits by examining between-group differences across the same social perception and cognition measures. We hypothesized that all cognition measures would correlate to a moderate degree of shared variance and that SCZ and ASP groups would perform worse than the healthy controls (CTRL). Since differences across ASP and SCZ groups are still unclear (for review see Sasson, Pinkham, Carpenter, & Belger, 2011), but evidence from the ACS-SP manual suggests, we expected the SCZ group to perform significantly worse than the ASP group.
Method
Participants
Subjects consisted of 20 individuals diagnosed with Asperger Syndrome (ASP), 19 with schizophrenia (SCZ), and 19 healthy controls (CTRL). Male and female young adults between the ages of 17 and 40 with an estimated Full Scale IQ of at least 80 were recruited from outpatient research clinics of the University of Texas at Dallas (UTD) and the University of Texas Southwestern Medical Center at Dallas (UTSW); these included subjects involved in ongoing research and/or their acquaintances who met inclusion criteria. All participants met the same inclusion criteria. Exclusion criteria included acute psychosis or unstable psychiatric status, comorbid diagnoses with cognitive sequelae, and substance dependence within the last 3 months. All ASP participants had a documented diagnosis of ASP except for one diagnosis of PDD-NOS. All ASP participants fell at or above the Autism Spectrum cutoff as rated by a trained professional on the Autism Diagnostic Observational System (ADOS; Lord, Rutter, DiLavore, & Risi, 2002). The mean Communication and Social Interaction Total ADOS score was 9.80 (3.35). The diagnosis of SCZ was confirmed using the Structured Clinical Interview for the DSM-IV (SCID; First, Spitzer, Williams, & Gibbon, 1995) and/or a psychiatrist-led consensus team. CTRL subjects were free from current known medical and psychiatric conditions with two exceptions; one subject reported a history of ADHD and the other, managed depression. All subjects provided written informed consent to participate, and the study was approved by the UTD and UTSW Institutional Review Boards. Order of test administration was varied to reduce order effects. However, not all participants completed all the measures because some measures were added during the study. Thus, changes to the study protocol and failure of subjects to complete all measures resulted in some missing data.
Table 1 shows group demographics. Overall, the SCZ group was significantly older and obtained slightly lower FSIQ scores relative to both the CTRL and ASP groups. No significant differences were found for education. In terms of ethnicity, the samples were primarily White (ASP = 95%, CTRL = 74%, SCZ = 53%). The groups were similar in the number of Hispanic individuals, but the SCZ and CTRL groups included more Asian and African American subjects.
Demographics of Clinical Groups

Note: CTRL = Controls; ASP = Asperger; SCZ = Schizophrenia; FSIQ = estimated Full Scale IQ. p values refer to the omnibus ANOVA tests, which are considered significant if p < .01. Tukey HSD post hoc significance for values in parentheses are set at p < .05.
Significant difference between CTRL and ASP.
Significant difference between CTRL and SCZ.
Materials and Procedure
Cognitive Measure
The Wechsler Abbreviated Scale of Intelligence (WASI; Wechsler, 1999) estimated full scale IQ score was derived from Vocabulary and Matrix Reasoning subtests. WASI IQ has a correlation of .92 with the full Wechsler scale IQ scores.
Digit Symbol Coding from the MATRICS Consensus Cognitive Battery (DS Coding; Nuechterlein & Green, 2006), a measure of processing speed, was administered, and the score was calculated from the total number of correct symbol-number completed within the 90-s time limit.
New Social Cognition Measure
Advanced Clinical Solutions for WAIS-IV and WMS-IV Social Perception Subtest (ACS-SP)
The primary score, the Social Perception Total (SP Total) score, is derived by adding all of the correct matches of pictures of one to two people to words of emotions or to auditory stimuli, with a maximum score of 48 (Pearson, 2009). The SP Affect Naming is the sum of 24 possible correct responses for matching facial emotions to words. The SP Prosody is comprised of scores from matching prosodic statements to pictures and has a maximum score of 24. The last score, the SP Pairs, includes the summation of prosody matching to a picture, a free description of emotion, and the inference of the meaning conveyed by a speaker. The maximum score for SP Pairs is 42. Across ACS-SP scores, average internal consistency is reported as ra = .69 to .81, test-retest stability coefficient as corrected ra = .60 to .70, and interscorer agreement from .98 to .99. Normative scaled scores are available for all ACS-SP subtests (Pearson, 2009).
Other Social Cognition Measures
Facial Expressions of Emotion Stimuli and Tests (Ekman60)
The Ekman60, one of the most commonly used measures of emotion recognition (Gray & Tickle-Degnen, 2010), was used to measure facial affect identification (Young, Perrett, Cabler, Sprengelmeyer, & Ekman, 2002). Participants were asked to choose one of six provided emotion words that best describe the facial expression displayed on the computer. Ekman60 has a maximum score of 60 and a cutoff score of 45 for the 20 to 40 age group. The manual offers little psychometric information but reports “adequate” split-half reliability.
Wechsler Memory Scale: Memory for Faces Subtest (WMS-Faces)
As a measure of nonverbal perception and memory for faces, participants were presented with a series of 24 headshot photographs of neutral faces and asked to remember each one (Wechsler, 1997). Immediately following this presentation, each participant was presented with a second series of 48 faces and asked to recognize whether the current face matched a previously presented face. The total raw score (range 0-48) is the sum of correct hits of previously viewed faces. Normative data derived from a large sample are available. Reliability coefficient for WMS Faces I average r xx = .74 and corrected stability coefficient or r = .70 (Psychological Corporation, 2002).
Reading the Mind in the Eyes-Revised (Eyes)
The Eyes assessed subjects’ ability to identify cognitive or complex emotions (e.g., “desiring”; Baron-Cohen et al., 2001). Participants were instructed to select one of four mental state words that best matched the thoughts or feelings from viewing a series of 36 black and white photographs of male and female actors’ eyes presented one at a time on paper. This task was originally designed as a measure of mentalizing and has been shown to relate to measures of empathy and autistic symptoms. The total raw score (range 0-36) is the sum of correct matching. Large scale normative data is not available. Test-retest reliability has been reported as r = .86, p < .001 (Golan & Baron-Cohen, 2006).
Triangles
Also known as the Social Perception Task (Abell, Happé, & Frith, 2000), the Triangles videos were originally adapted from the Social Attribution Task (Heider & Simmel, 1944) in which subjects are shown six short animation clips of moving triangles and asked to attribute thoughts and feelings onto them. Triangles’ animation and intentionality scoring criteria are based on a 5-point Likert-type scale and methods of Castelli, Happe, Frith, and Frith (2000) with a total score ranging from 0 to 30. Subjects describing higher levels of intentional and mental states of the stimuli are awarded higher scores. For example, a score of zero was awarded when a verbal response only described the shapes moving at random and a score of 5 was awarded when the response indicated a deliberate interaction of the shapes and included a mentalizing description (e.g., “the triangles are angry with each other”). Triangles is an experimental task, that purports to measure ToM, has been scored in a variety a ways, with little psychometric or normative data.
Mayor-Salovey-Caruso Emotional Intelligence Test–Managing Emotion Subtest (MSCEIT-ME)
The ME subtest of the MSCEIT assesses the ability to predict the consequences of self and other’s thoughts, feelings, and actions through 29 questions that are asked following the reading of a series of socially and emotionally laden vignettes (Mayer, Salovey, Caruso, & Sitarenios, 2003; Nuechterlein & Green, 2006). This subtest was selected by the NIMH MATRICS Neurocognition Committee as the Social Cognition domain based on its face validity and good psychometric properties (Green, Olivier, Crawley, Penn, & Silverstein, 2005) including interclass correlation coefficient of .73 (Nuechterlein et al., 2008). The scoring software is used to derive both the raw and T-scores, which reflect agreement with a general consensus.
Data Analysis
To assess relationships between ACS-SP and other social cognition measures, Pearson correlation coefficients, r and coefficients of determination, r2 were computed. To help protect against inflated Type 1 error and to adjust for multiple comparisons, we used an adjusted p value set at p < .01. For ANOVAs, a significant finding was followed by a Tukey HSD post hoc test. Since the Tukey HSD adjusts for multiple tests, we used p < .05 as the significance level for the multiple comparisons. Coefficient reliability estimates were computed using Cronbach’s alpha. Analyses were performed with SSPS version 18.0.
Results
Reliability Estimates
The Cronbach alpha coefficient was .96 for ACS SP Total, .94 for SP Affect Naming, .90 for SP Prosody, .70 for SP Pairs, .74 for Ekman60, .75 for WMS-Faces, .90 for Eyes, and .61 for MSCEIT-ME.
Correlation Between Social Perception Subscales and Social Cognitive Measures
As seen in Table 2, the correlations depicted various relationships among the social cognitive measures. In general, significant correlations were moderate (r’s = .365-.612). The largest correlations were observed between ACS-SP and Ekman60 scores (r’s = .535-.612), with Ekman60 sharing nearly 37% of the variance with SP Prosody. All scores on the ACS-SP were also significantly related to the Eyes measure (r’s = .446-.509). Performance on WMS-Faces was significantly related to the SP Total score (r = .470, r2 = .22, p < .001), SP Prosody (r = .432, r2 = .19, p = .001), and SP Pairs (r = .375, r2 = .14, p = .005). Fewer significant correlations were found between Triangles and MSCEIT-ME and the ACS-SP subtests. The DS Coding was not significantly correlated with any ACS-SP subscale.
Pearson Correlations of ACS Social Perception Subtests by Social Cognition Measures and a Cognitive Measure

Note: WMS = Wechsler Memory Scale; MSCEIT-ME = Mayor-Salovey-Caruso Emotional Intelligence Test–Managing Emotion Subtest. Significance value set at *p < .01.
Examination of Clinical Groups
One-way between-subjects ANOVAs were conducted to evaluate the relationship among CTRL, ASP, and SCZ groups on the ACS-SP scaled scores, as seen in Table 3, and the other measures of social perception and cognition, as seen in Table 4. Significant group differences typically found the CTRLs to score higher than either ASP or SCZ groups. Significant differences were not found on SP Total, SP Affect Naming, MSCEIT-ME, or Triangles although some were approaching significance. The SP Pairs was the only measure that showed a significant difference between ASP and SCZ groups.
ACS-Social Perception Subtest Scaled Scores Across Groups
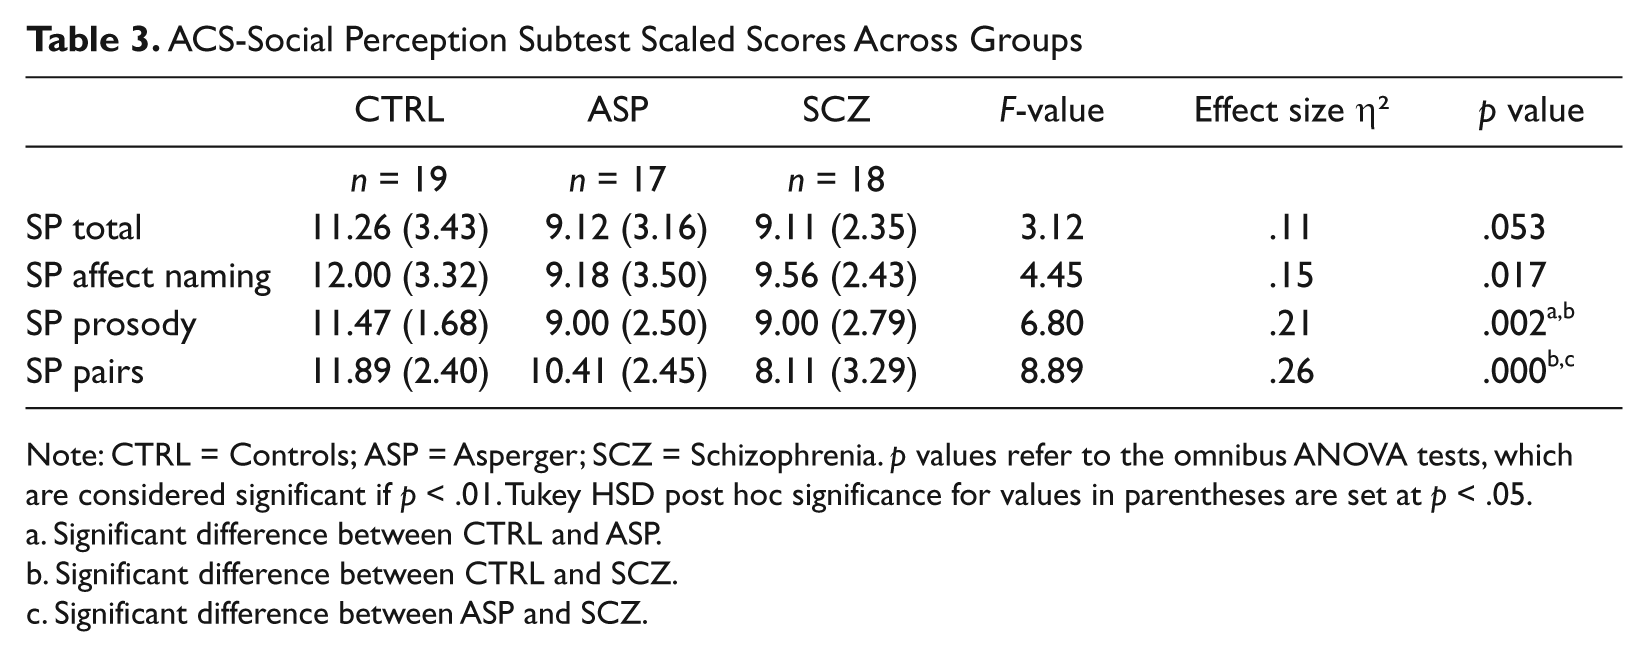
Note: CTRL = Controls; ASP = Asperger; SCZ = Schizophrenia. p values refer to the omnibus ANOVA tests, which are considered significant if p < .01. Tukey HSD post hoc significance for values in parentheses are set at p < .05.
Significant difference between CTRL and ASP.
Significant difference between CTRL and SCZ.
Significant difference between ASP and SCZ.
Social Cognition Scores Across Groups
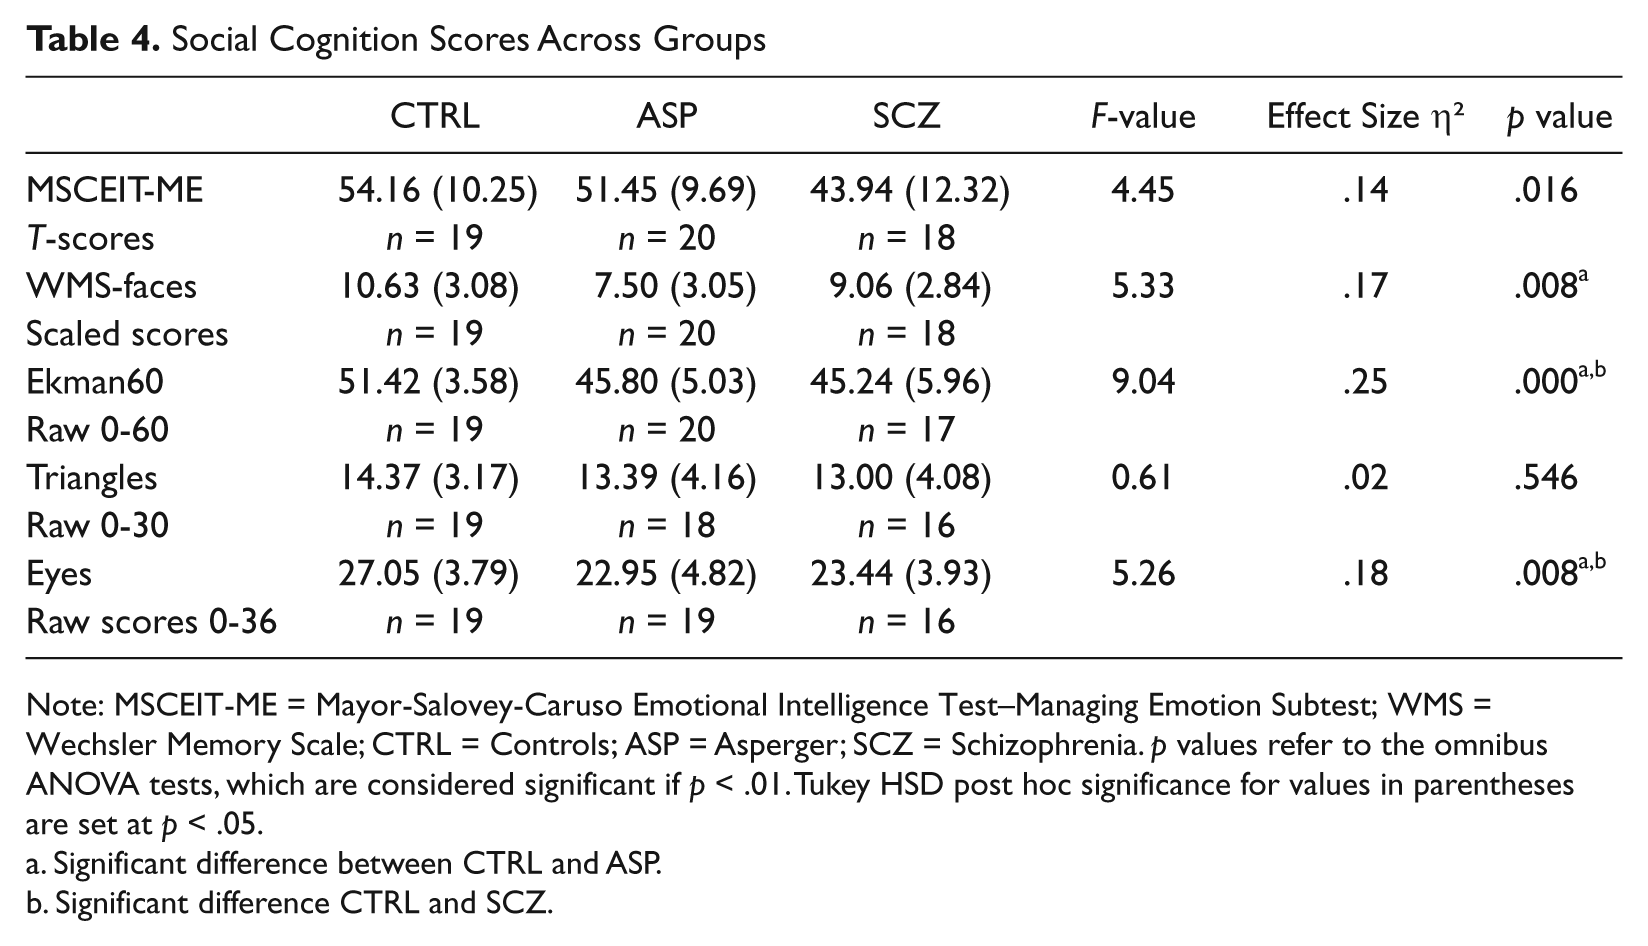
Note: MSCEIT-ME = Mayor-Salovey-Caruso Emotional Intelligence Test–Managing Emotion Subtest; WMS = Wechsler Memory Scale; CTRL = Controls; ASP = Asperger; SCZ = Schizophrenia. p values refer to the omnibus ANOVA tests, which are considered significant if p < .01. Tukey HSD post hoc significance for values in parentheses are set at p < .05.
Significant difference between CTRL and ASP.
Significant difference CTRL and SCZ.
Discussion
These pilot results focus on the relation of the ACS-SP subtest with measures of social cognition in a mixed sample. To our knowledge, these social measures and clinical groups have not been previously studied in this manner and, although there is growing interest, few previous reports describe the relationships among social cognition measures or abilities across populations. Overall, the results of the first aim suggest adequate convergent and discriminant validity of the ACS-SP to other measures of social cognition as evidenced by significant positive, moderate correlations to the Ekman60, the Eyes, and the WMS-Faces and the lack of significant relation to DS Coding. Secondary analyses explored the relationships exhibited by groups across social measures, which also provide further evidence of convergence. As expected, clinical groups obtained lower scores compared to the CTRL group overall, and some differences reached statistically significant levels. Unexpectedly, the ASP and SCZ groups performed similarly on most measures except SP Pairs. Limited power may have affected the results.
Convergent validity, as indicated by greatest amount of shared variance, was found among the ACS-SP subscales and the Ekman60, WMS-Faces, and the Eyes, which suggests similarities among these measures. First, the ACS-SP subtests consistently use pictures of faces as stimuli, similar to the related measures. As such, the shared variance may relate to the processing of facial stimuli resembled in each of these measures. Second, stronger relations were found between ACS-SP and two measures of emotional processing, the Ekman60, and the Eyes tests. These measures direct participants to label or recognize an emotion, such as sad or desiring. Thus the relationship between these measures suggests that they are tapping similar functions of deriving emotional information from facial cues. Since these correlations were moderate, this suggests that the ACS-SP also taps into areas that these social cognition measures do not.
Alternatively, the relation of some of these measures may be a reflection of similar processing regardless of the type of stimuli or task (Golan, Baron-Cohen, Hill, & Rutherford, 2007). Previous studies have found significant correlations on emotion recognition tests that are presented in either a visual or an auditory format (Banziger et al., 2009; Golan et al., 2007; Philip et al., 2010; Poole, Tobias, & Vinogradov, 2000). However, deficits in prosody and facial expression have also been reported to occur independently (Bowers, Bauer, & Heilman, 1993). As such, systematic associations between facial and vocal affect recognition tasks are not uniformly reported, which may relate to the heterogeneity of the social cognition tasks used (Hooker & Park, 2002).
While the ACS-SP related to most social cognitive measures studied, the subscales lacked strong correlations with the MSCEIT-ME or Triangles. This may indicate that these tasks are tapping into domains that are related to, but distinct from, the constructs of the ACS-SP. As the MSCEIT-ME was designed to assess the understanding and modulation of emotions, and Triangles was designed to measure mentalizing or ToM, these tasks involve perception of social information, perhaps, unlike the social perception and emotion identification constructs tapped by the ACS-SP. The MSCEIT-ME and Triangles measures also use stimuli as text and video in contrast to the predominant use of pictures in the ACS-SP. Along those lines, the MSCEIT-ME and the Triangles task appear to involve language to a greater degree, both in the task presentation and task-related response; previous studies have reported the MSCEIT-ME has a relationship with verbal abilities (Bell et al., 2010; Wexler, Zito, Greig, & Bell, 2009). In conclusion, the lack of significant shared variance indicates that ACS-SP is tapping into different social constructs than either of these measures although future research will be necessary to further explore these differences at a cognitive level.
Group results were informative to the convergence of social cognition measures as well as the performances of the three groups. As expected, CTRLs outperformed ASP and SCZ on the Eyes, Ekman 60, and SP Prosody tests and either group on the WMS-Faces and SP Pairs. Statistical differences were not found on the other four measures. Yet differences between the psychiatric groups and the CTRLs appear to be limited by the lack of power such as indicated by the moderate and large effect sizes of the SP Total, SP Affect Naming, and MSCEIT-ME scores. The Triangles test was the only measure that did not evidence differences across groups.
Differences between ASP and SCZ groups did not appear as often. The only statistical finding between these groups was on SP Pairs indicating that the SCZ group performed worse on a higher order social linguistic test (e.g., sarcasm). One reason for the lack of findings is the high functioning level of our samples. Compared to data from the ACS-SP manual (see also Holdnack, Goldstein, & Drozdick, 2011), the average scaled scores achieved by our ASP group were slightly higher, but comparable, while our SCZ group scored much higher than the SCZ group presented in the test manual. Furthermore, we should also note that the mean FSIQ of our ASP subjects was much higher than the ACS sample (i.e., 113.2 vs. 95.8). Overall and compared to other measures, the ACS-SP adequately differentiated CTRLs from the psychiatric groups and suggested evidence for differentiating among groups known to have social cognition deficits.
Limitations to this study may limit the generalizability of the findings. First, our relatively small sample sizes restricted the power for the statistical analyses. Furthermore, the age differences among the groups may have influenced the results. Second, data were missing for some of the analyses, which may have affected the magnitude of correlations. A third concern, present in social cognition research, is the potential association with or influence of general intelligence. This is a complex issue due to the strong relationships between measures of “g” and numerous other aspects of cognition and behavior. It has been noted that IQ and developmental disorders involving cognition are inextricably related (Dennis et al., 2009), thus limiting our ability to separate these two core constructs in human cognition.
Future research will be necessary to further explore the relationships among social perception measures and variations in performance across groups. The need for psychometrically sound measures for each population with social deficits necessitates further investigation, as some measures may be better suited for finding deficits in certain groups. Consolidating clinical and research efforts to explain the similarities and differences among populations with social deficits may also prove to be beneficial in future investigations.
The current study suggests some advantages of the ACS-SP in comparison to other measures of social perception and cognition. Results provide evidence for convergent and discriminant validity of the ACS-SP with other measures of social cognition and perception. The ACS-SP is a published, standardized, and well-normed set of subtests that appears to measure similar constructs as existing and more experimental social cognition measures. In addition, the manual provides information across special populations known to have social cognitive deficits and allows for ACS-SP scores be contrasted to WAIS-IV IQ scores. Thus the ACS-SP appears to have promise as a packaged tool for exploring social cognition in these and other populations.
Footnotes
Declaration of Conflicting Interests
The authors declared no potential conflicts of interest with respect to the research, authorship, and/or publication of this article.
Funding
This work was supported by funding from the Crystal Charity Ball, the Lattner Family Foundation, and John A. and Lee Wacker. The grant is NIMH RO1 MH083957.