
Abstract
Whether or not learning strategies change during the course of higher education is an important topic in the Student Approaches to Learning field. However, there is a dearth of any empirical evaluations in the literature as to whether or not the instruments in this research domain measure equivalently over time. Therefore, this study details the procedure of longitudinal measurement invariance testing of self-report Likert-type scales, using the case of learning strategies. The sample consists of 245 University College students who filled out the Inventory of Learning Styles—Short Version three times. Using the WLSMV estimator to take into account the ordinal nature of the data, a series of models with progressively more stringent constraints were estimated using Mplus 6.1. The results indicate that longitudinal measurement invariance holds for all but two learning strategy scales. The implications for longitudinal analysis using scales with varying degrees of measurement invariance are discussed.
Educational researchers have long been interested in how students learn in higher education. One perspective on this issue is offered by the Students’ Approaches to Learning tradition (SAL), examining learners’ general preferences when it comes to learning (Biggs, Kember, & Leung, 2001). Researchers in the SAL field distinguish several dimensions of these preferences, such as processing and regulation strategies (Vermunt, 1996). The former are the cognitive activities that students apply when studying. The latter capture the different ways in which students regulate their learning. In assessing these learning strategies, self-report Likert-type questionnaires are mostly relied on (e.g., Study Process Questionnaire [SPQ]: Biggs et al., 2001; Inventory of Learning Styles [ILS]: Vermunt, 1996).
Research in the SAL field focuses increasingly on whether and how learning strategies change during the course of higher education (Vanthournout, Donche, Gijbels, & Van Petegem, 2011). Examining how these studies are undertaken statistically reveals a strong reliance on comparisons of manifest scale scores over time. For each student, the scores on the items for each scale are averaged at each wave. Subsequently, in studies with two measurement waves, paired-samples t-tests are relied on to compare the means. When more than two measurement waves are involved, repeated measures ANOVA are used.
However, such a straightforward comparison of manifest scale scores over time may be inappropriate when the measurement of the underlying constructs is not equivalent over time: the manifest mean (e.g., the manifest scale scores for the Memorizing scale) depends not only on the latent mean (e.g., being the true Memorizing score at each wave) but on the whole underlying measurement model (Steinmetz, Schmidt, Tina-Booth, Wieczorek, & Schwartz, 2009). Therefore, a longitudinal comparison always hinges on the assumption of longitudinal measurement invariance (Marsh & Grayson, 1994; Wu, Liu, Gadermann, & Zumbo, 2010). If the ruler does not measure equivalently over time, it is a daunting task to decide whether or not a change in the manifest scale scores is due to actual alterations in learning strategies over time (changes in the latent mean) or due to changes in the measurement over time (Vaillancourt, Brengden, Boivin, & Tremblay, 2003). A measurement can, for example, be age and treatment-sensitive: students having more experience in studying in higher education could interpret learning strategy items differently from novices. Thus, if the assumption of longitudinal measurement invariance is not confirmed, the validity of conclusions stemming from comparisons of manifest scale scores over time could be compromised (Shadish, Cook, & Campbell, 2002).
Nevertheless, an examination of the measurement model is generally neglected prior to the assessment of change over time (Li, Harmer, & Acock, 1996), perhaps due to a lack of familiarity with the assumption, or with the method of analysis required to verify this. Yet, “[. . .] whereas it may be reasonable to assume the invariance of these properties over short intervals, this assumption becomes more problematic as time intervals become longer” (Marsh & Grayson, 1994, p. 334). Recently, research into changes in learning strategies has increasingly allowed for such longer time intervals (e.g., Donche & Van Petegem, 2009). Thus, the assessment of whether or not the longitudinal measurement assumption holds true, is an evidential lacuna in the learning strategies literature which is becoming increasingly more problematic.
In the methodological literature, testing for measurement invariance across samples (e.g., gender or cross-culturally) is well described (Byrne, 2010). Moreover, though rare in the student approaches to learning field, numerous applications of multi-sample invariance testing can be found in other social science domains (e.g., Petscher & Huijun, 2008). A large number of these studies rely on data gathered using self-report Likert-type questionnaires. However, the ordinal nature of the data stemming from this is usually ignored by applying a maximum likelihood estimation procedure (Steinmetz et al., 2009). Studies showcasing measurement invariance testing with a distribution free estimation procedure are scarce. Next to this, measurement invariance testing in longitudinal designs differs from its multi-sample counterpart. Due to the repeated measurements, the responses at different time points are non-independent which, when neglected, can lead to model misspecification (Wu et al., 2010). Moreover, since the number of parameters to be estimated increases rapidly with the number of time points, examining the measurement invariance of all scales together is computationally difficult. Each scale is therefore investigated separately (Vandenberg & Lance, 2000). In sum, the requirements laid on the error terms and the testing procedure differs for longitudinal data compared with multi-sample designs.
In this study, we aim to illustrate longitudinal measurement invariance testing in the SAL domain. By detailing each step in verifying whether or not learning strategy scales measure equivalently over time, we offer a practical guide to longitudinal measurement invariance testing using ordinal data. Moreover, the consequences for the analysis of longitudinal change using scales with varying degrees of measurement invariance are discussed. Therefore, regardless of the research domain tackled here, this study may also be of interest to researchers in other social science fields investigating longitudinal change with self-report Likert-type questionnaires.
Method
Instrument and Sample
As a learning strategy questionnaire, we chose the Inventory of Learning Styles–Short Version (ILS-SV; Donche & Van Petegem, 2008). This instrument is based on Vermunt’s Inventory of Learning Styles (Vermunt, 1996), which was tested cross-culturally (Boyle, Duffy, & Dunleavy, 2003) and is frequently used in longitudinal research (Vanthournout et al., 2011). The ILS-SV has been validated for 1st-year University College students, demonstrating the dimensionality of the Vermunt theory, good reliabilities, and theoretically sound construct validity (Donche & Van Petegem, 2008).
The ILS-SV questionnaire measures learning strategies consisting of processing and regulation strategies (see Table 1). The former are mapped using four scales: Memorizing, Analysing, Critical processing, and Relating and structuring. Three scales map regulation strategies: External regulation, Self-regulation, and Lack of regulation. All items are scored on a 5-point Likert-type scale, ranging from 1 (I never or hardly ever do this), 2 (I sometimes do this), 3 (Neutral), 4 (I often do this) to 5 (I (almost) always do this).
Learning Strategies of the ILS-SV Questionnaire, Scales, Number of Items, Item Examples and Range of Scale Reliability
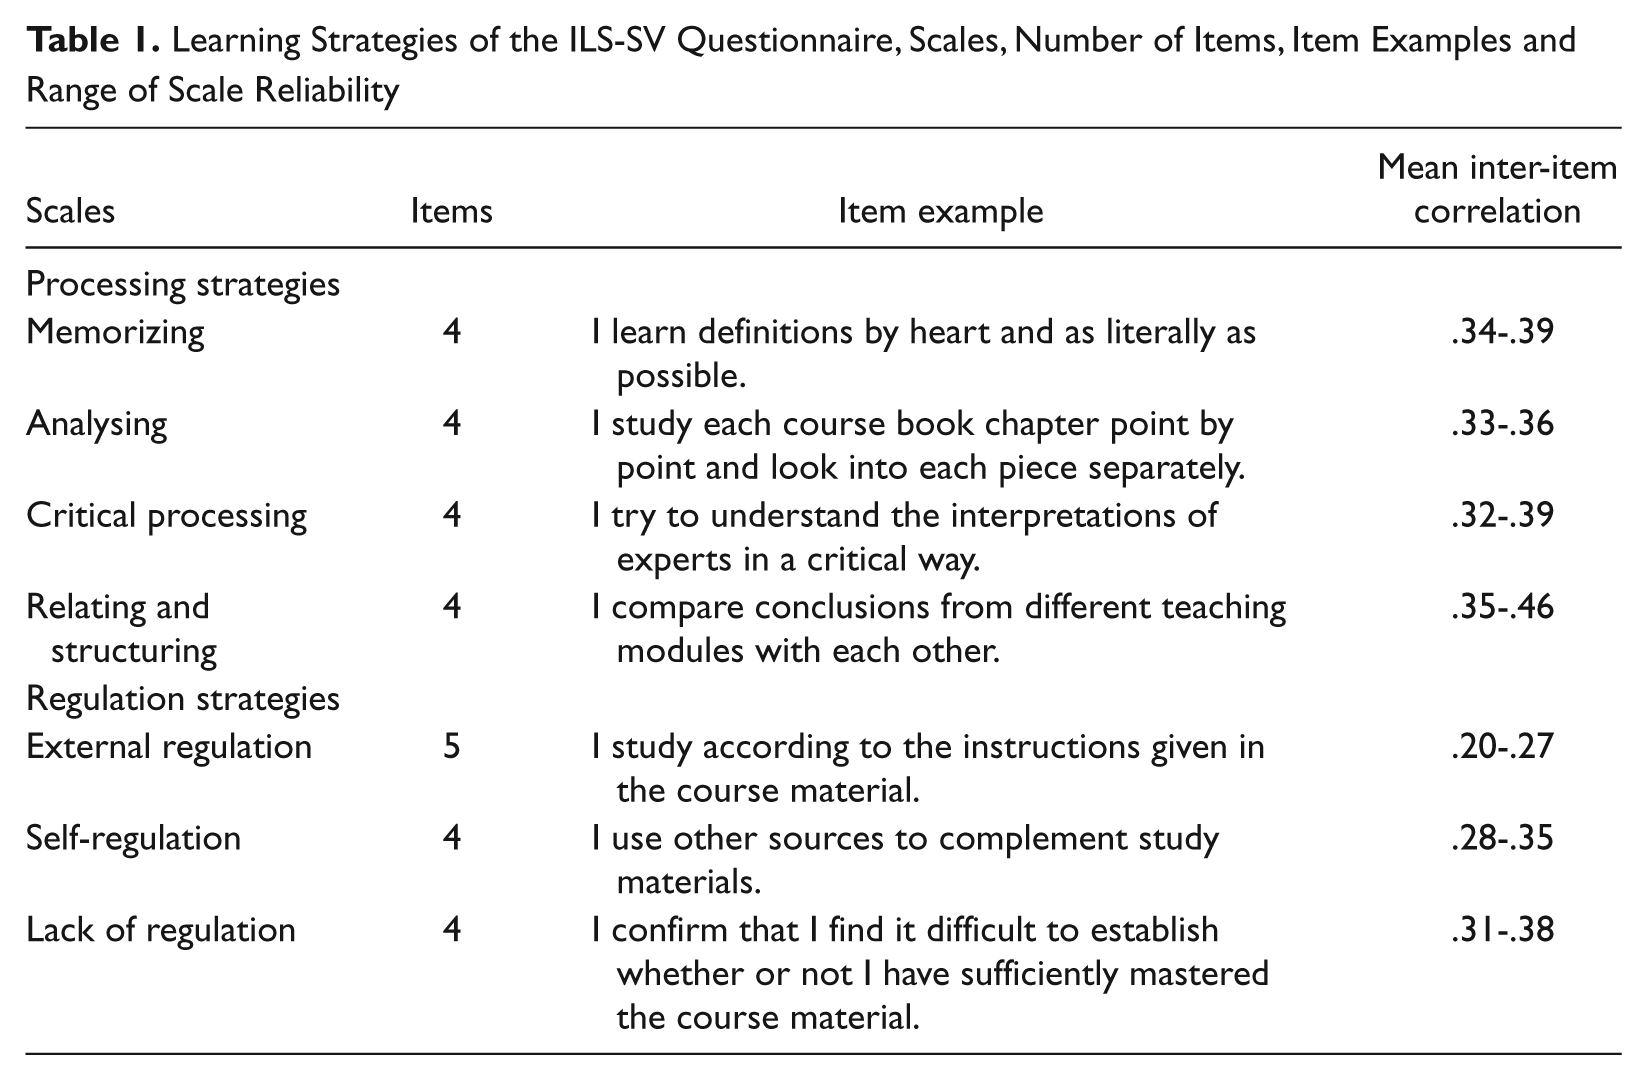
One cohort of students entering a Flemish University College was followed during their 3 years of higher education. In March of the 1st academic year (from September to June), all 1st-year students were administered the ILS-SV during scheduled lecture slots. The same cohort had the questionnaire administered again in May of the 2nd and the 3rd year. Though students were not rewarded or given feedback, adequate response rates were obtained each time (73.6%, 67%, and 69.8%, respectively). Over the three waves, 245 students participated three times. Reliability analysis was conducted using the mean inter-item correlation, since Cronbach alpha values are very sensitive to the number of items (Palant, 2007). At each wave, all scales—containing each 4 to 5 items—met the .2 cut-off for good reliability (see Table 1).
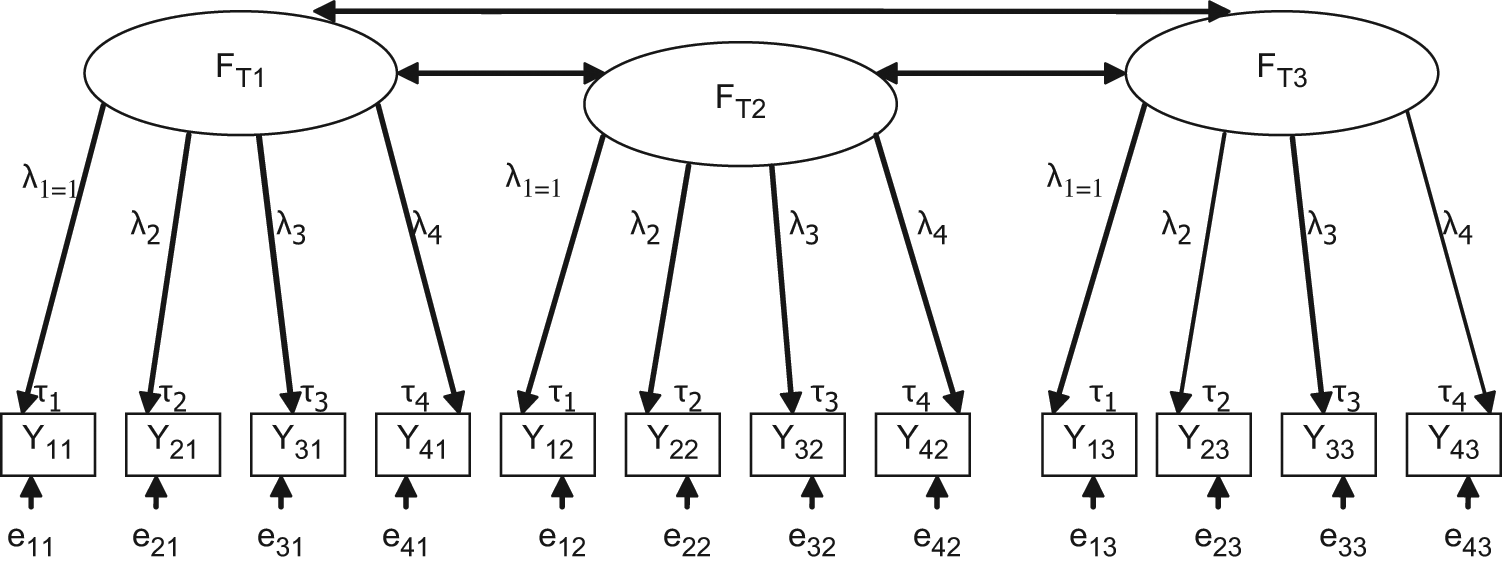
Before detailing the measurement invariance testing procedure, we briefly explain the elements in play when assessing the change in learning strategy scales over time. A factor (e.g., the latent concept of Memorizing) is measured at three moments, each time using the same four items (see Figure 1; Y1−Y4). 1 The model attempts to predict an individual’s score on an item at a certain time (Yijt).
Longitudinal measurement model

In this prediction, three regression-like elements are key: the intercept (τjt), the factor loading (λjt) and the error (eijt) (Byrne, 2010; Wu et al., 2010; see Figure 1). The factor loading (λjt) represents the increase in Y by one increase in the factor (Fit). The intercept (τjt) can be understood as the value of Y when the latent variable (Fit) is zero. Therefore, it reflects the difficulty level or “[. . .] the ease in getting high manifest scores for a particular measured variable” (Marsh & Grayson, 1994, p. 336).
However, in our case, the items are ordinal. Therefore, there is not one intercept, but several thresholds. With a 5-point Likert-type scale, there are four thresholds (the number of scale points—1; Metha, Neale, & Flay, 2004). For example, τ3; time 2; threshold 1 expresses for Item 3 at Time 2 the difficulty level of scoring I sometimes do this (Likert point 2) compared to I never or hardly ever do this (Likert point 1) when the latent variable (Fit) is zero.
The third element in the equation is the measurement error (eijt). Due to the data’s longitudinal nature, it is plausible that errors pertaining to the same item (e.g., e11, e12 and e13, see Figure 1) correlate over time (Vaillancourt et al., 2003). To prevent model misspecification, three item covariances are estimated per item (e.g., for Y1: e11-e12, e11-e13 and e12-e13) 2 (Wu et al., 2010).
To assess change, the scores on the four items (Y’s) are usually averaged for each student per wave. Subsequently, manifest scale scores are compared over time. Conclusions are then drawn in terms of the underlying latent factors (F’s) (e.g., Memorizing decreases during higher education). Yet change in item scores over time (ΔY) can only be attributed to change in this latent factor (ΔFit) when the other elements in the equation remain invariant over time (Byrne, 2010; Marsh & Grayson, 1994). However, due to the correlation between errors over time, and contrary to multi-group comparisons, error invariance is not expected in longitudinal measurement invariance testing (Wu et al., 2010). The longitudinal measurement invariance analysis of ordinal data thus consists of two elements: the invariance of factor loadings (λ’s) and of thresholds (τ’s).
Procedure for Longitudinal Measurement Invariance Testing
In testing whether the measurement invariance hypothesis holds, successively more constrained models are estimated for each scale (see Figure 2; Muthén & Muthén, 2010). Due to the data’s ordinal nature, the use of the maximum likelihood estimation procedure could not be justified. Therefore, a distribution-free estimation procedure, the weighted least squares means-variance (WLSMV) was employed (Metha et al., 2004; Muthén & Muthén, 2009) in Mplus 6.1. 3
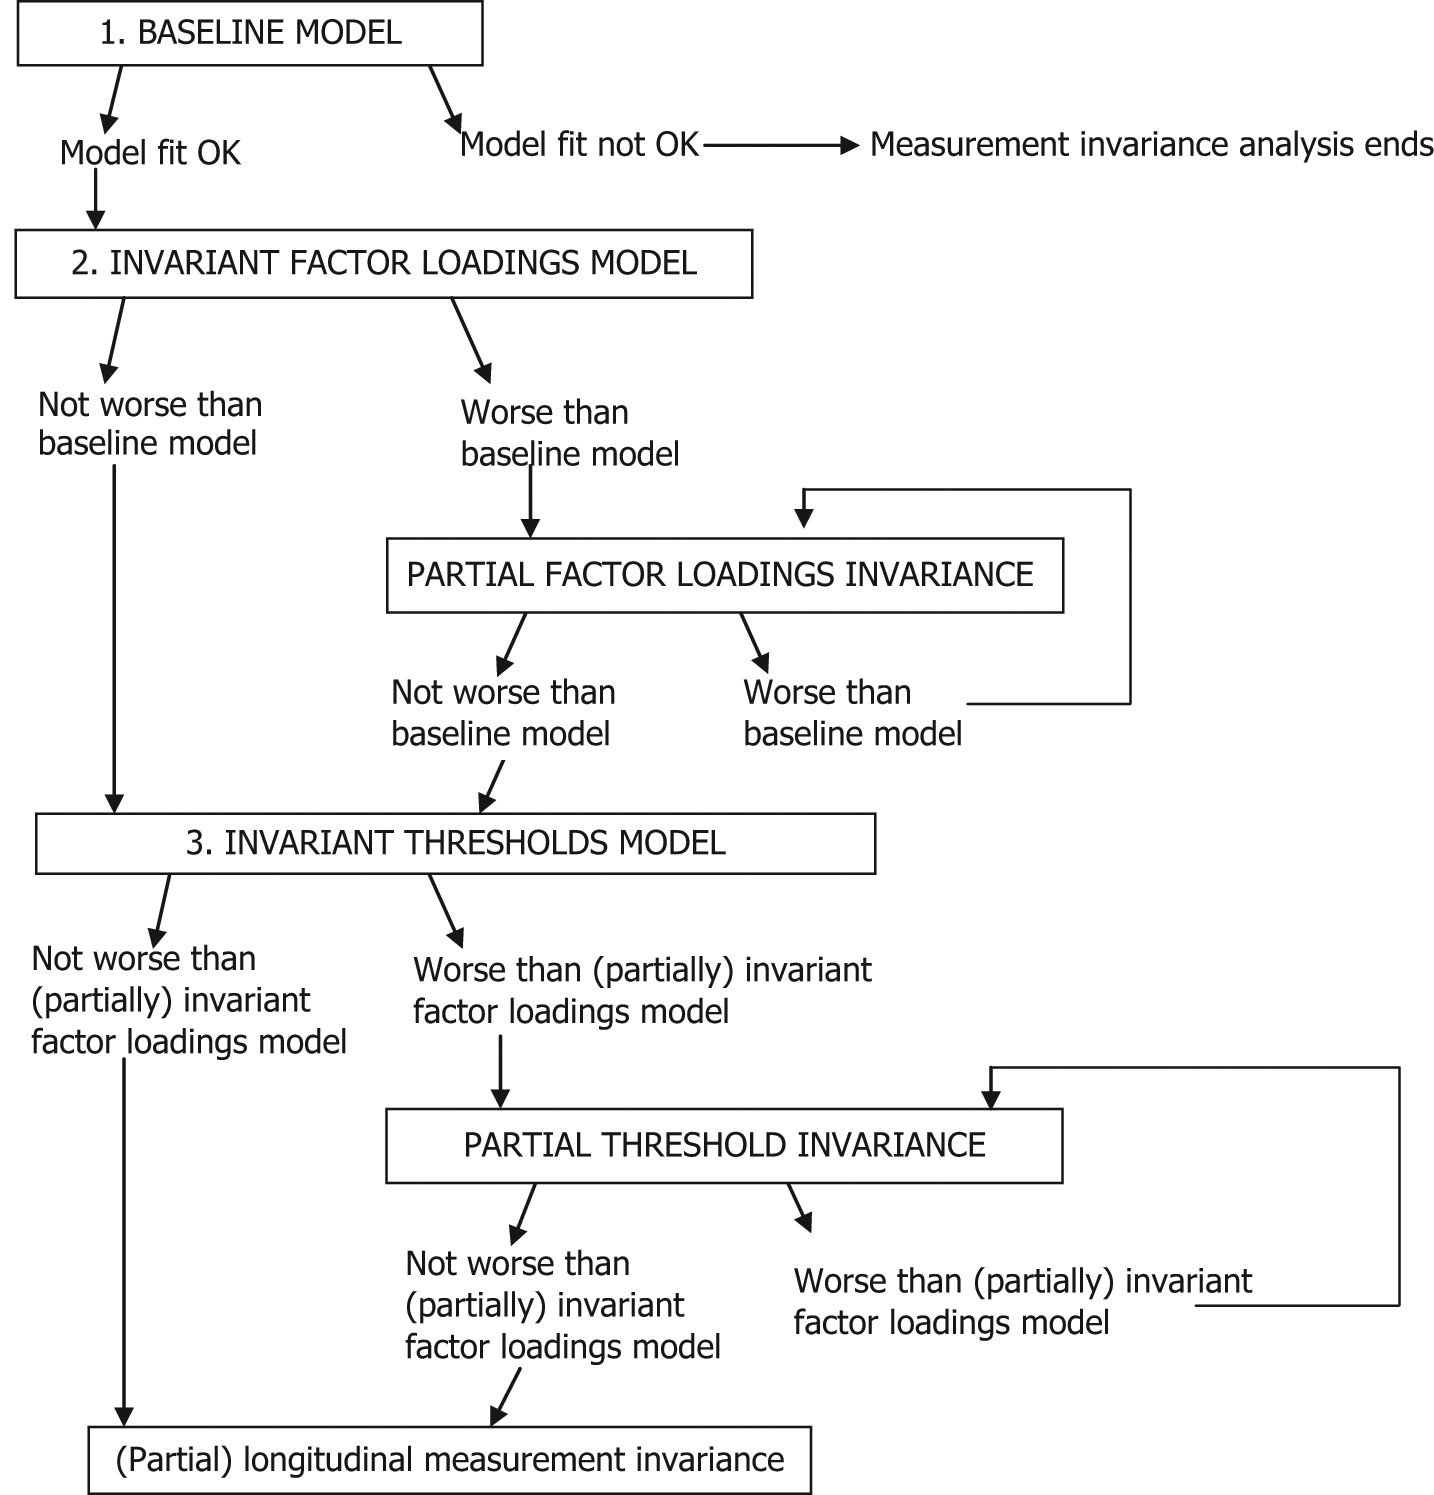
Flowchart longitudinal measurement invariance testing
First, a baseline model is estimated, testing whether for each scale a unidimensional model holds at each measurement point (Vandenberg & Lance, 2000). To evaluate this, neither factor loadings nor thresholds are constrained to be equal over time, while the error covariances are included. Subsequently, an adequate fit is suggested by a CFI close to .95 (Hu & Bentler, 1999) and an RMSEA up to .08 (Byrne, 2010).
In the second model, for each item, the factor loadings (λ’s) are constrained to be equal over time (e.g., λ2 at time 1 = λ2 at time 2 = λ2 at time 3; Wu et al., 2010). Subsequently, the hypothesis of invariance is evaluated by comparing the model fit of the more restricted invariant factor loadings model to the less restricted baseline model. To test this, the chi-square difference test (Δχ2) and the change in Comparative Fit Index criterion (ΔCFI) are relied on (Byrne, 2010; Vandenberg & Lance, 2000). For the former, the hypothesis of equal factor loadings over time is rejected when the chi-square difference test (Δχ2) has a probability lower than 0.05. 4 For the latter, a decrease in CFI by 0.01 or more suggests that the invariance hypothesis should be rejected 5 (Chueng & Rensvold, 2002). Failure to reject the hypothesis is interpreted as evidence that an increase of 1 in the factor score (Fit) procures the same increase (λ2) in the item (Y2) at each wave. If the hypothesis of equal factor loadings is rejected, this signifies that (at least) one of the items is more or less closely related to the underlying construct at one time rather than at the other (Cooke, Kosson, & Michie, 2001).
In this situation, additional models are warranted to identify the source(s) of the lack of equivalence. High values on the modification indices (MI) and the expected parameter change (EPC) suggest that the constraint on the factor loading needs to be freed (Muthén & Muthén, 2009). If such a partial factor loadings invariance model produces a non-significant loss of fit compared to the baseline model (p of Δχ2>.05; ΔCFI>-.01), all factor loadings can be assumed to be equal besides the one freely estimated. If the model fit is still worse in relation to the baseline model, the above procedure is repeated (see Figure 2).
Next, equality constraints on the thresholds (τ’s) are added. For each item, it is verified whether or not the difficulty level of going, for example, from “I often do this” to “I (almost) always do this,” remains constant over time (e.g., τ 2 time 1; threshold 4 = τ 2 time 2; threshold 4 = τ 2 time 3; threshold 4). A non-significant loss of fit of the invariant thresholds model compared to the (partially) invariant factor loadings model (p of Δχ2>.05; ΔCFI>–.01), suggests that the thresholds can be assumed to be equally difficult over time. Rejection of the equal thresholds hypothesis indicates that the difficulty level for (at least) one threshold varies over time (Metha et al., 2004). By freeing the constraint on the threshold causing most trouble according to the MI and EPC, a partial threshold invariance model is estimated.
How many factor loadings and thresholds can be freed without jeopardising future longitudinal analysis constitutes a debate in the literature (Byrne, 2010; Marsh & Grayson, 1994). Differences in factor loadings are, however, perceived to be more serious in relation to bias than differences in thresholds (Cooke et al., 2001). Therefore, we judge complete invariance of factor loadings as a necessary condition for longitudinal analysis. Concerning the number of unequal thresholds that are tolerable, a minimum of two items for which all thresholds are invariant is suggested (Steinmetz et al., 2009).
Results
Processing Strategies
The baseline model of the Memorizing scale showed adequate fit (see Table 2), indicating that the Memorizing scale is unidimensional at each measurement wave. In testing the invariance of the factor loadings, a non-significant loss of fit with respect to the unconstrained baseline model was obtained (Δχ2 = 2,277, Δdf = 6, p = .89; ΔCFI = .008). The discrepancy between the invariant thresholds model and the invariant factor loadings model also satisfied the minimum criteria for invariance Δχ2 = (13,378, Δdf = 22, p = .92; ΔCFI = .003). Complete longitudinal measurement invariance can thus be assumed for the Memorizing scale.
Results From Measurement Invariance Tests for Processing and Regulation Strategy Scales
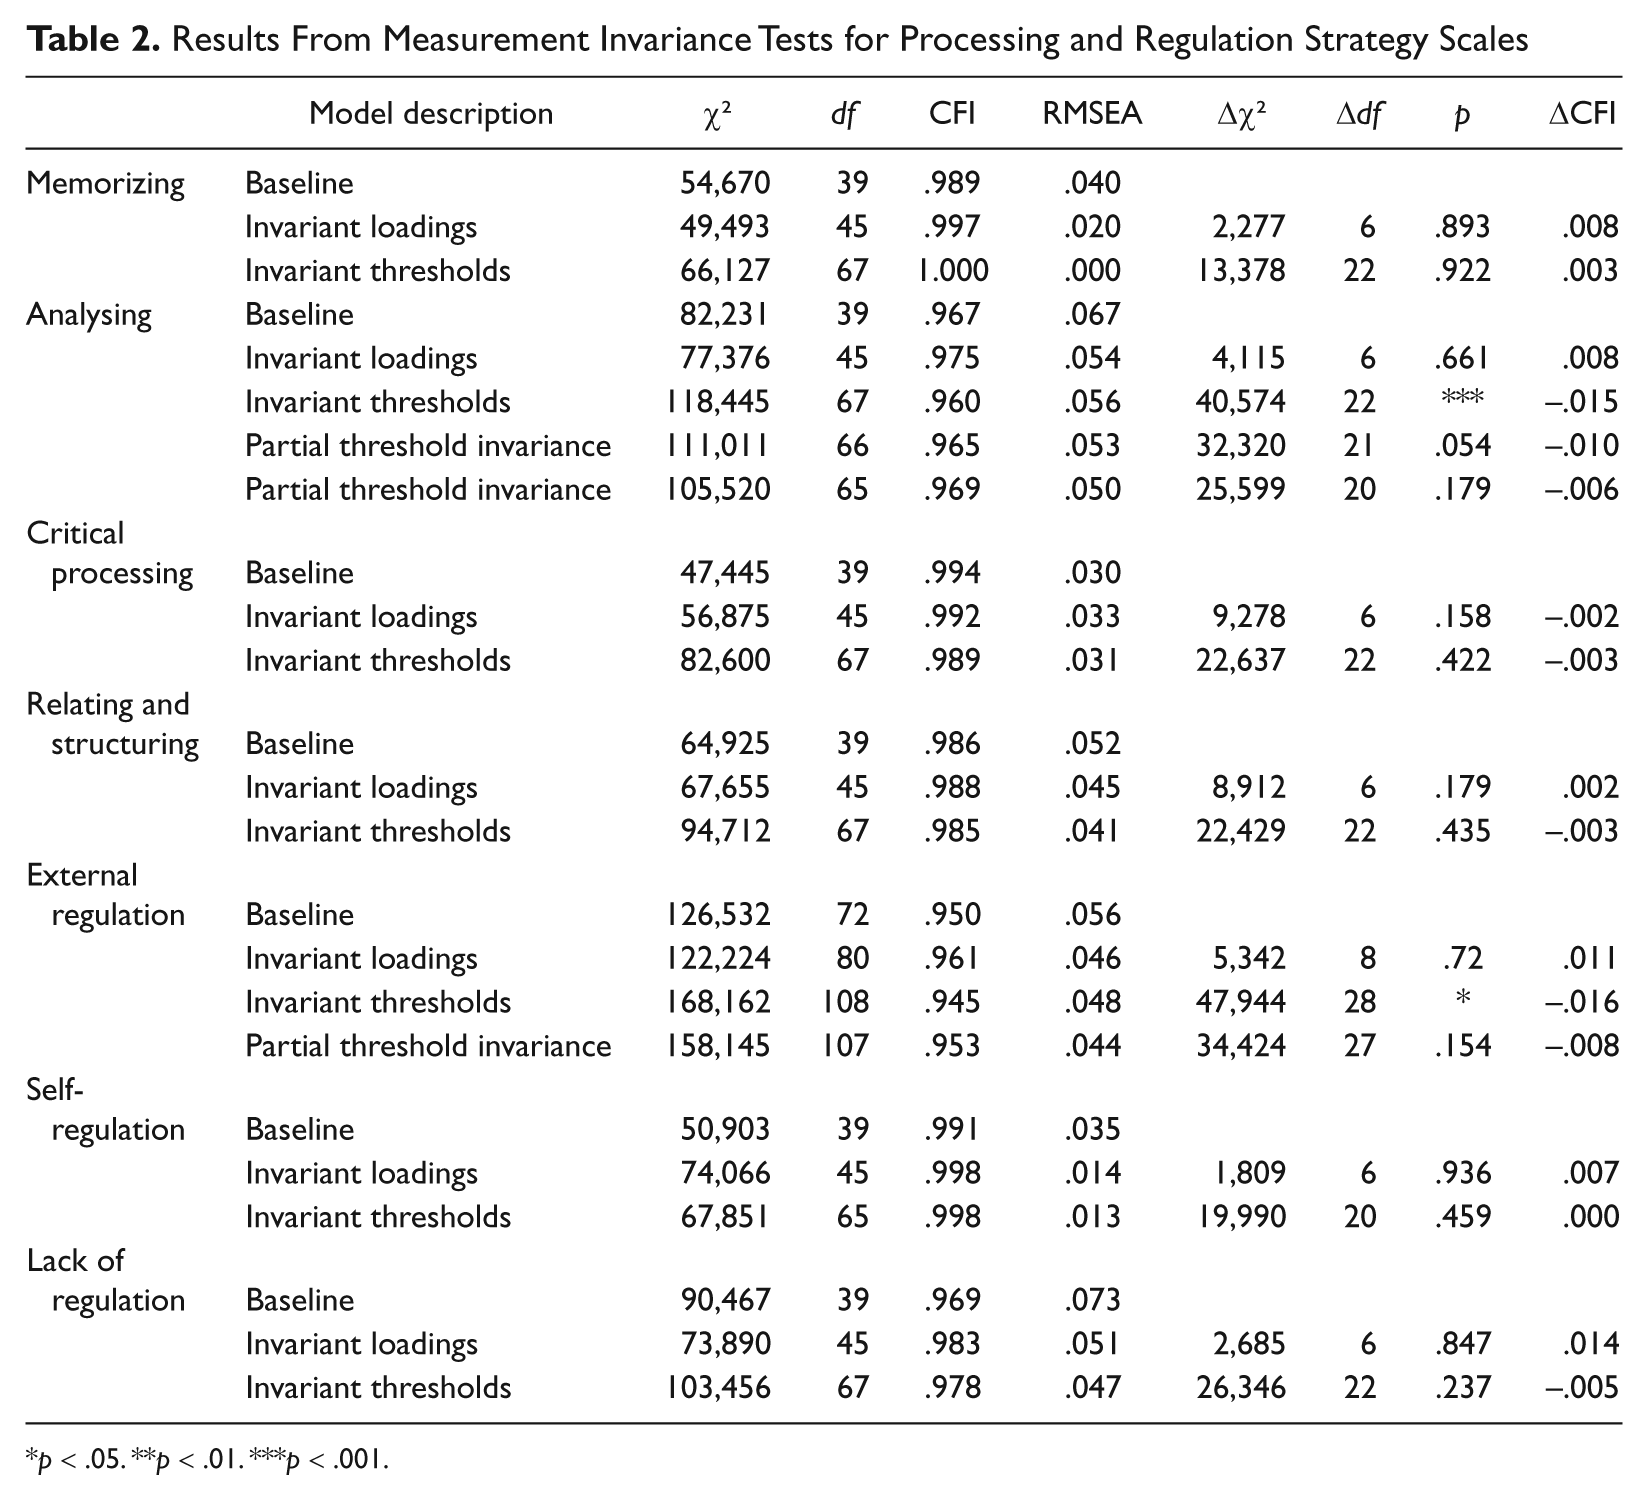
p < .05. **p < .01. ***p < .001.
For the Analysing scale, the baseline model also shows adequate model fit and constraining the factor loadings does not alter the model fit significantly (Δχ2 = 4,115, Δdf = 6, p = .66; ΔCFI = .008). However, the invariant thresholds hypothesis is rejected (Δχ2 = 40,574, Δdf = 22, p < .001; ΔCFI = –.015). The second threshold (going from I sometimes do this to neutral) of the item “I study each course book chapter point by point and look into each piece separately” is less difficult at the third wave (MI = 6.836, EPC = –.180). Relaxing the constraint on this threshold did not improve model fit sufficiently (Δχ2 = 32,320, Δdf = 21, p = .054; ΔCFI = –.01). A re-examination of the modification indices pointed anew to the same item: the difficulty of answering I (almost) always do this is higher at the first wave (MI = 5.732, EPC = .180). Allowing this threshold to be freely estimated provided a model that was statistically indistinguishable from the equal factor loadings model (Δχ2 = 25,599, Δdf = 20, p = .17; ΔCFI = –.006). The results for the Analysing scale thus suggested factor loadings invariance and the equality of all but two thresholds pertaining to the same item.
Concerning Critical processing, the baseline model suggests an adequate model fit. The hypothesis of invariant factor loadings was not rejected (Δχ2 = 9,278, Δdf = 6, p = .16; ΔCFI = –.002) and constraining the thresholds did not decrease model fit (Δχ2 = 22,637, Δdf = 22, p = .42; ΔCFI = –.003). The results for the Relating and structuring scale paint a similar picture. Both the factor loadings and the thresholds can be presumed to be equal over time (respectively, Δχ2 = 8,912, Δdf = 6, p = .18; ΔCFI = .002 and Δχ2 = 22,429, Δdf = 22, p = .44; ΔCFI = –.003). Consequently, for the scales Critical processing and Relating and structuring, the results indicate complete longitudinal invariance of factor loadings and thresholds.
Regulation Strategies
The fit of the baseline model of the External regulation strategy scale suggests that the unidimensionality of the scale holds over the three waves. Constraining factor loadings did not produce a significant worsening of fit (Δχ2 = 5,342, Δdf = 8, p = .72; ΔCFI = .011), while the invariant thresholds model did (Δχ2 = 47,944, Δdf = 28, p < .05; ΔCFI = –.016). The item “I study according to the instructions given in the course material” failed to reveal invariance at the second measurement wave for the fourth threshold (MI = 10.008, EPC = –.536). It was less difficult to answer I (almost) always do this in the 2nd year. Results for the External regulation scale thus suggest invariance over time of the factor loadings and all but one threshold.
Concerning the second scale, Self-regulation, the baseline model shows adequate fit and the hypothesis of factor loading invariance is not rejected (Δχ2 = 1,809, Δdf = 6, p = .94; ΔCFI = .007). Constraining thresholds over time however, proves problematic for the item “I use other sources to complement study materials.” At both the second and the third wave, no students answered I (almost) always do this. At the first measurement wave, this answer is checked by less than 1% of the students. The invariant thresholds model (not estimating the two absent thresholds) fitted the data as well as the invariant factor loadings model (Δχ2 = 19,990, Δdf = 20, p = .46; ΔCFI = .000), indicating that the measurement of Self-regulation can be assumed equivalent over time.
Lastly, for the Lack of regulation scale, the model fit for the baseline model suggests unidimensionality, and the discrepancy between the invariant factor loadings model and the baseline model satisfied the minimum criteria for invariance (Δχ2 = 2,685, Δdf = 6, p = .85; ΔCFI = .014). Moreover, constraining the thresholds over time produces a non-significant loss of fit (Δχ2 = 26,346, Δdf = 22, p = .24; ΔCFI = –.005). It is therefore concluded that the Lack of regulation scale measures equivalently over time.
Discussion
In the student approaches to learning (SAL) field, a growing number of studies have examined whether and how learning strategies evolve over the course of higher education. To assess this, comparisons of manifest scale scores over time by means of t-tests and repeated measures ANOVA are used. An often overlooked assumption of these techniques is that the ruler needs to measure equivalently at each wave. Taking the case of the learning strategies scales, the current study therefore illustrates the longitudinal measurement invariance testing procedure with ordinal Likert-type data.
The results confirm at least partial measurement invariance for the four processing and the three regulation scales of the ILS-SV. All factor loadings pertaining to the scales proved invariant over measurement waves as well as did at least all thresholds belonging to two items. This is a promising result since significance testing on found mean differences is only permitted if this minimal degree of partial invariance is confirmed (Steinmetz et al., 2009). However, which analytical technique is most adequate, depends on the degree of invariance of a scale.
For five learning strategies scales complete measurement invariance was confirmed, ensuring a comparable definition of the latent construct over time. In this situation, traditional statistical comparison procedures such as t-tests or repeated measures ANOVA on manifest scale scores are non-problematic (Steinmetz et al., 2009; Vandenberg & Lance, 2000). For the External regulation and Analysing scale, respectively, one and two thresholds failed to reveal equivalence over measurement moments. These variances can seriously hamper the comparison of manifest scale scores, since it is difficult to disentangle genuine changes in the underlying latent variable from nuisance due to shifts in the difficulty level (Steinmetz et al., 2009). Therefore, it is suggested that researchers refrain from traditional statistical procedures and explicitly model the small number of variations via a structural equation modelling procedure such as a multiple indicator latent growth model (Marsh & Grayson, 1994; Vandenberg & Lance, 2000).
Limitations and Future Studies
Certain limitations of the current study suggest additional avenues for future research. First, there are different techniques to assess measurement invariance. Here, the approach based on confirmatory factor analysis was used, while Fidalgo and Scalon (2010), for example, relied upon an IRT-based differential item functioning technique. It would be interesting to assess the impact of these different techniques for longitudinal measurement invariance testing. Second, when equivalence of the measurement model is established, the structural invariance can be assessed. For example, the evolution of the correlation between scales can be substantively relevant (Chueng & Rensvold, 2002). In the SAL field it is, for example, theoretically viable for scales to be differently related over time. Third, the results from this study cannot be generalized to other educational contexts, cultures, learning strategy questionnaires, or samples. Comparable to reliability, longitudinal measurement invariance should be assessed anew in each specific sample (Guttmannova, Szanyi, & Cali, 2008).
The limitations of the present study notwithstanding, the results provide apparent support for the need for longitudinal measurement equivalence testing. As was succinctly stated by Wu and colleagues (2010), “[. . .] establishing temporal measurement invariance is the prerequisite for analyzing change” (p. 126). We therefore hope to have provided a clear illustration of the longitudinal measurement invariance testing procedure in the case of ordinal data stemming from Likert-type questionnaires.
Footnotes
Acknowledgements
The authors would like to thank Huub van den Bergh (University of Utrecht) for his thorough comments on earlier drafts of this article. They would also like to express their gratitude to Linda Muthén for her advice and swift replies on data modeling issues.
Declaration of Conflicting Interests
The authors declared no potential conflicts of interest with respect to the research, authorship, and/or publication of this article.
Funding
The authors disclosed receipt of the following financial support for the research, authorship, and/or publication of this article: The research reported in this article was supported by a grant from the “Special Research Fund: New Research Initiatives” from the Research Board of the University of Antwerp. Opinions reflect those of the authors and do not necessarily reflect those of the granting agency.