
Abstract
The purpose of the current study was to evaluate a screening instrument. The sample contained 496 elementary children from the rural southeast. Properties of the Teacher, Parent, and Student Forms of the Behavioral and Emotional Screening System were examined. Results indicated that all forms had high levels of internal consistency. There were low to moderate correlations between the Teacher Form and reading, behavior, and attendance variables. The Parent Form was significantly correlated with attendance and reading. The Student Forms were significantly correlated with office discipline referrals, attendance, and reading. The Teacher Form identified 28% of students as being at-risk (elevated or extremely elevated), followed by 20% and 32% on the Parent and Student Forms, respectively. The risk groups were significantly different in terms of attendance, behavior, and achievement. However, interrater agreement regarding risk status across different raters was low. All forms demonstrated low positive predictive power and low to moderate sensitivity relative to an outcome of office discipline referrals but did show reasonably strong negative predictive power and specificity. Future directions for research are presented.
Calls for screening of students for school-related behavioral problems have become increasingly frequent. Some of the interest in behavioral screening is due to the dissemination and widespread adoption of Schoolwide Positive Behavior Support models (SWPBIS; www.pbis.org) and the increase in academic and behavioral Response to Intervention models (RTI; SpectrumK12, 2010). Other scholars have long called for behavior screening specifically for the early identification and treatment of students with emotional and behavioral disorders (EBD; O’Shaughnessy, Lane, Gresham, & Beebe-Frankenberger, 2002; Sprague et al., 2001; Walker, Horner, Sugai, & Bullis, 1996).
Emotional and Behavioral Disorders
Students with EBD currently comprise 7% of the special education population (U.S. Department of Education, n.d.). The costs and consequences of EBD, for students, families, schools, and society in general, warrant special consideration. Many students with EBD have academic difficulties (Lane, Barton-Arwood, Nelson, & Wehby, 2008; Lane, Little, Menzies, Lambert, & Wehby, 2010), as well as higher rates of substance use and arrests (Walker & Reid as cited in Walker, Colvin, & Ramsey, 1995), suspensions and expulsions (Wagner, Kutash, Duchnowski, Epstein, & Sumi, 2005), and high school dropout (U.S. Department of Education, n.d.). An additional cost of behavioral difficulties is the disruption to the overall classroom environment (Walker et al., 1995). Students with EBD have difficulty interacting in socially acceptable ways with peers and teachers; they are more likely to exhibit aggressive and bullying behaviors (Walker et al., 1995). Unfortunately, traditional exclusionary disciplinary practices may exacerbate rather than remediate these difficulties (Sugai & Horner, 2008; Walker et al., 1996). Removing a disruptive child from a situation which causes distress may serve the function of that behavior (escape/avoidance), making the disruption more likely to reoccur. In addition, exclusionary methods result in the loss of instructional time for all students. Thus, children with EBD threaten school safety (Walker et al., 1996) and interfere with the learning and well-being of other students in the school.
Screening
Scholars have advocated for screening initiatives for EBD. Intervention for students with EBD often occurs too late in the development of the disorder (Kazdin, 1987). The earlier intervention occurs, the more likely it is that positive outcomes may be achieved (Walker et al., 1995). Although early intervention is considered essential to divert at-risk children from the path of antisocial behavior, interventions provided later in the development of behavior disorders have been found to be effective to some degree (Loeber & Farrington, 1998; Walker et al., 1995).
Universal screening
There is consensus that universal screening is in the best interests of children with behavior difficulties and schools generally (Walker et al., 1995, 1996). The increase in popularity of SWPBIS and behavioral RTI models provided an additional catalyst. Some screening methods, such as the Systematic Screening for Behavior Disorders (Walker & Severson, 1992), Behavioral and Emotional Rating Scale (Epstein & Sharma, 1998), and Student Risk Screening Scale (Drummond, 1994), were not designed specifically for use in concert with SWPBIS or RTI. Other methods of detecting those children who exhibit or may be at-risk for behavior problems include office discipline referrals (ODR), suspensions, report card ratings of behavior, classroom observations, and teacher referral (Muyskens, Marston, & Reschly, 2007). ODRs are widely used for screening and to evaluate the effectiveness of SWPBIS (e.g., McIntosh, Frank, & Spaulding, 2010; McIntosh, Horner, Chard, Boland, & Good, 2006); however, ODRs and suspensions indicate that behavior is already occurring at a level that requires disciplinary action and methods may be inconsistent within schools. Report card ratings are broad; classroom observations time-consuming (Muyskens et al., 2007) and teacher referral unsystematic, at best (Donovan & Cross, 2002). In addition, the above methods are inconsistent with the universal screening practices proposed in the RTI and positive behavior support literature (Gresham, 2004).
Thus, despite interest, there are few methods available for universal behavior screenings that are also amenable to schoolwide behavior models. The recent development of instruments designed for this purpose, such as the Behavioral and Emotional Screening System (BESS; Kamphaus & Reynolds, 2007) and the Behavior Screening Checklist (Muyskens et al., 2007), is promising. The standards for educational and psychological testing (American Educational Research Association [AERA], American Psychological Association, & National Council on Measurement in Education, 1999) recommend that tests and instruments are only used with populations in which their reliability and validity have been examined. There are several forms of validity evidence, such as content, response processes, internal structure, and external relationships with other variables. Furthermore, an accumulation of evidence, rather than the results of one study, provides greater support for the use and inferences drawn from such tests (AERA et al., 1999). In addition to specific standards for evaluating screening measures, Lane, Parks, Kalberg, and Carter (2007) recommended examinations of positive and negative predictive power (PPP, NPP), sensitivity, specificity, and feasibility (cost, time).
The purpose of this study was to examine the properties of the BESS within a rural elementary school. To our knowledge, this is the first study of the BESS that does not use the publisher’s standardization sample or that was conducted by independent authors. This study examined validity in terms of internal consistency, convergent relationships with another indicator of school behavioral risk, and external concurrent relationships with criterion measures of school performance.
Method
Participants
Participants were 496 students in a public elementary school in the rural southeast (Table 1). Every regular education teacher (n = 25) completed screeners in reference to their classrooms. In addition, 241 parents completed parent screeners (PF). Data were examined to determine if differences were present between those who did and did not complete the PF. When controlling for home language (described below), the groups did not differ in terms of gender; they did differ in terms of grade (χ2 = 20.06, df = 5, p < .01), ethnicity (χ2 = 13.81, df = 4, p < .01), and free/reduced lunch (FRL; χ2 = 12.16, df = 2, p < .01). The PF sample included a disproportionally large number of kindergartners and a small number of families eligible for FRL and those who were Hispanic, even when controlling for home language. Finally, 207 children in Grades 3 through 5 completed the student screener (SF). No group differences were found.
Demographics

Note: Ethnicity/race: EA = European American, AfA = African American, AsA = Asian American, HA = Hispanic American, M = Multiracial; Lunch status: F/R = free or reduced lunch, Full = full-priced lunch.
Measures
BASC-2 Behavioral and Emotional Screening System
The BESS (Kamphaus & Reynolds, 2007) was adapted from the Behavioral Assessment System for Children, Second Edition (BASC-2; Reynolds & Kamphaus, 2004) and was developed to be a more efficient measure for screening purposes than the BASC-2.
The BESS system is composed of three forms (Parent, Teacher, Student) for children in preschool through Grade 12 to be used individually or in combination. The BESS TF (27 items) is to be completed by an adult who has had experience with the child in an educational setting. The PF (30 items) is intended to be completed by the child’s caregiver. The SF (30 items) is for children in Grades 3 through 12. Each form takes 5 to 10 min. Items are scored on a 4-point Likert-type scale. A T-score is used to classify students as having normal, elevated, or extremely elevated levels of risk. No subscale scores are provided for the BESS. Classification levels were determined by using distance from the T-score mean. Scores between 1 and 2 standard deviations (SD) above the mean are considered elevated; scores more than 2 SDs above the mean are considered extremely elevated.
Reliability and validity evidence is provided for each BESS form by age group. Given the diversity of item content on the varying forms, split-half reliability was used for internal-consistency. The median split-half reliability (across ages) was .96, .94, and .92, for the TF, PF, and SF, respectively (Kamphaus & Reynolds, 2007). The test-retest reliability of the BESS was .91 (TF), .84 (PF), and .80 (SF). Interrater reliability correlations (e.g., between two teachers) were .70 (TF) and .87 (PF).
Convergent validity was reported for the BESS total score and other behavior-rating scales. The following adjusted correlation coefficients were obtained between the BESS TF and the BASC-2 (Reynolds & Kamphaus, 2004) TF composites: .79 (Externalizing Problems), .62 (Internalizing Problems), .89 (School Problems), –.85 (Adaptive Skills), and .90 (Behavioral Symptoms Index; Kamphaus & Reynolds, 2007). With the exception of Internalizing Problems, the correlation coefficients were found to be similar when the BESS TF and BASC-2 TRS were used with a different sample of children (Kamphaus, DiStefano, Dowdy, Eklund, & Dunn, 2010). These correlations, obtained on a sample of children in an urban school district, were .76 (Externalizing Problems), .52 (Internalizing Problems), .82 (School Problems), and –.82 (Adaptive Skills).
Correlation coefficients for the BESS PF and BASC-2 PF were .79 (Externalizing Problems), .59 (Internalizing Problems), –.87 (Adaptive Skills), and .90 (Behavioral Symptoms Index). Similar coefficients were reported for the BESS SF and BASC-2 SF. Those coefficients were .69 (School Problems), .84 (Internalizing Problems), .74 (Inattention/Hyperactivity), –.78 (Personal Adjustment), and .86 (Emotional Symptoms Index). There is overlap of items on the BESS and on the BASC-2. In fact 24 of the 27 TF items, 26 of the 30 PF items, and 29 of the 30 SF items on the BESS are also found on the corresponding BASC-2 forms. This overlap partially explains these coefficients; however, the authors stated this comparison is justified because the BASC-2 forms contain many more items than those in common with the BESS (Kamphaus & Reynolds, 2007).
Furthermore, convergent validity evidence was calculated between the BESS and the Achenbach System of Empirically Based Assessment (ASEBA; Achenbach & Rescorla, 2001). The correlations between the BESS TF and the ASEBA Teacher Rating Form (ASEBA TRF) Total Problems scale was .76, .69 with the TRF Externalizing scale, and .29 with the TRF Internalizing scale. Similar statistics were reported for the BESS PF and the parent form of the ASEBA (ASEBA CBCL). The adjusted correlation between the BESS PF score and the ASEBA CBCL Total Problems scale was .76; correlations of .66 and .64 were found with the CBCL Externalizing and Internalizing scales, respectively. Correlations between the BESS SF and the ASEBA youth report were .77 (Total Problems scale), .66 (Externalizing scale), and .69 (Internalizing scale).
Student-level data
ODRs, suspensions, and attendance were obtained from electronic school records at midyear. For attendance, tardies and absences were converted to a percentage of days present and on-time relative to the number of days enrolled. As an indicator of midyear reading achievement, scores from the November administration of the Dynamic Indicators of Basic Early Literacy Skills (DIBELS), 6th edition, were used. Three oral reading (ORF) probes were administered and scored according to standard procedures to students in Grades 1 through 5. The median score was used (Good, 2004). ORF and similar reading probes (Curriculum-Based Measurement) are moderately to highly correlated with other measures of reading achievement (Reschly, Busch, Betts, Deno, & Long, 2009). The DIBELS ORF probes have evidenced strong test-retest reliability at every grade level, ranging from .96 (in one study of 1st-grade ORF) to .99 (in another study of 1st-grade ORF and a study of 2nd-grade ORF; Dynamic Measurement Group, 2008).
Procedures
BESS data were collected from parents/guardian, teachers, and students 10 weeks into the school year. Parents were notified via a letter sent home 1 week prior to fall conferences. Upon arrival for conferences, parents were asked to complete the BESS PF. Parent–teacher conferences were chosen as an optimal time because of the traditionally high turnout. The BESS published a Spanish version of the PF; however, due to limited availability of those forms at the time of data collection, they were not used. Instead, Spanish-speaking families (n = 89, 18%) were given the option to complete an English PF. Most (n = 81, 91%) did not. Those children were still included in the study, as TF and SF data were available. The overall PF response rate for the school, when controlling for the Spanish-speaking families who chose not to complete the English PF, was 62% (n = 255).
The TF was distributed following conferences. Teachers were given 1 week to complete the forms and provided a substitute for 30 min to aid completion. Thus, TF data were available for 99% of students. Two students did not have a TF because they moved into the school after the administration but were present to complete the SF.
The BESS SF was distributed to 3rd, 4th, and 5th graders during school hours. Group instructions were presented within classrooms (88% response rate). Students who did not complete the SF either withdrew, were absent, or were involved in individualized instruction during the administration.
Each BESS form was hand-scored using item weights and normative data provided in the BESS manual (Kamphaus & Reynolds, 2007). To ensure accuracy of entry, 15% of data were checked; 99% of the data entered were accurate. Errors were corrected.
Results
The oral reading passages used to determine the ORF scores varied by grade. Therefore, ORF scores were converted to z scores using each respective grade’s mean and SD for the analyses because the purpose was to compare risk groups on an indicator of reading achievement. Spearman’s rho correlations were used with ODR, suspensions, and attendance variables because of skewed distributions.
Descriptive data and correlations among variables may be found in Tables 2 and 3. There were low to moderate correlations between the TF and all outcome variables. The PF was negatively correlated with attendance and ORF. The SF was correlated with ODR, attendance, and ORF.
Descriptives of Major Variables
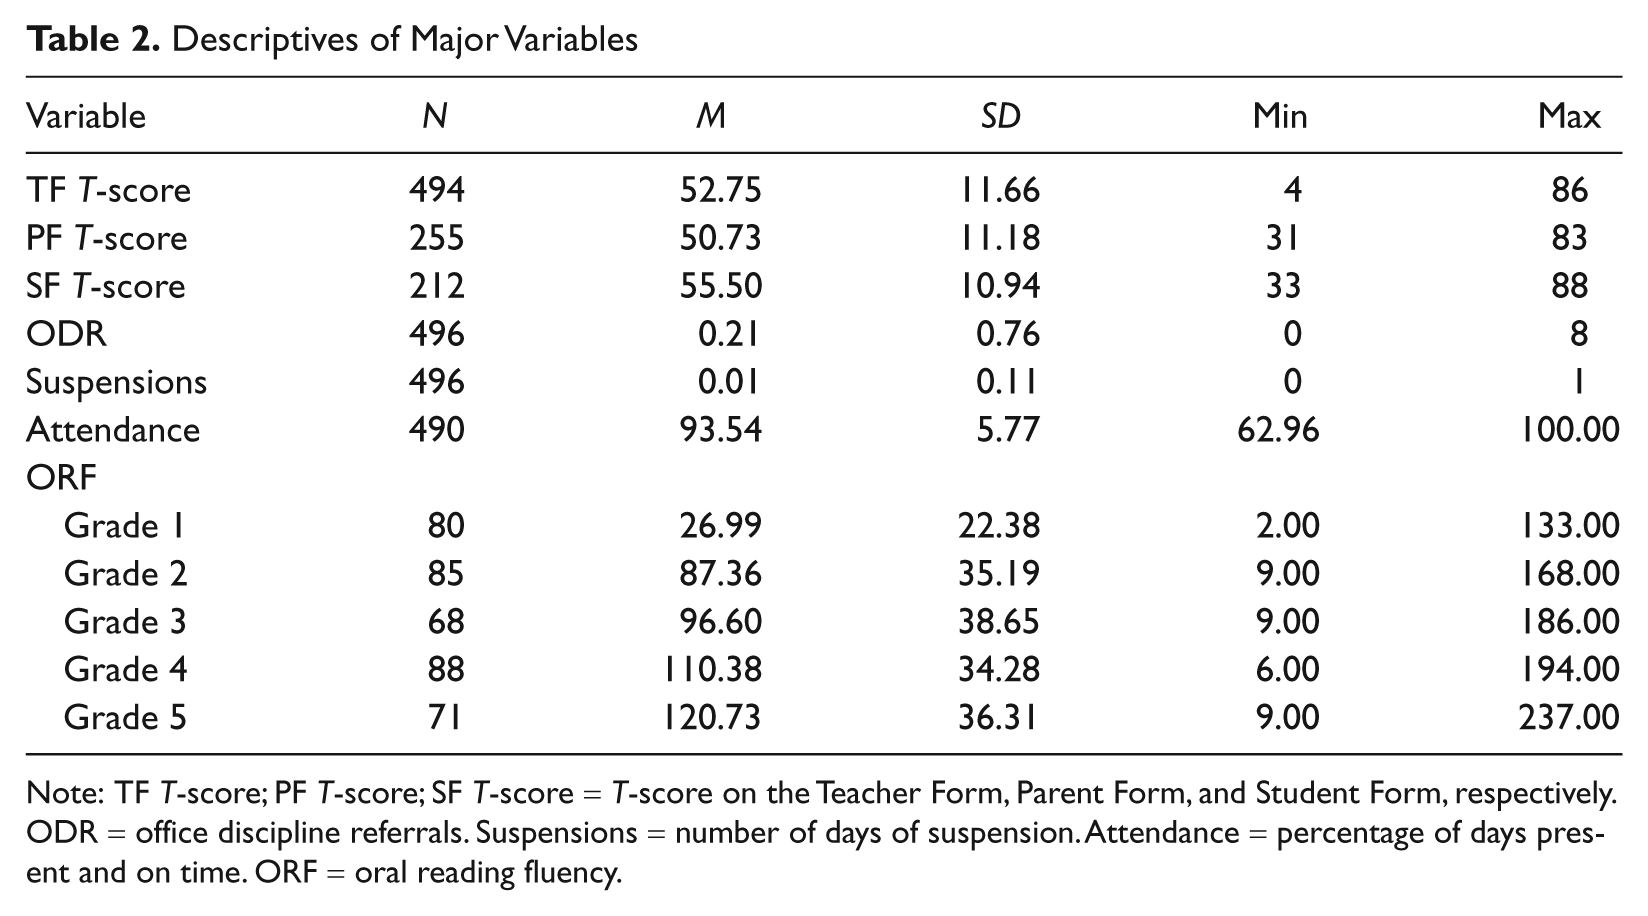
Note: TF T-score; PF T-score; SF T-score = T-score on the Teacher Form, Parent Form, and Student Form, respectively. ODR = office discipline referrals. Suspensions = number of days of suspension. Attendance = percentage of days present and on time. ORF = oral reading fluency.
Correlations

Note: ODR = office discipline referrals; Sus = suspensions; Att = attendance; ORF = oral reading fluency. Spearman’s rho used for the correlations with ODR, Suspensions, Attendance. ORF1 converted to z score based on grade-level means and SDs. Pearson coefficients used for other correlations.
Significant at .05. **Significant at .01.
Internal Consistency
The internal properties of BESS forms were examined via internal consistency reliability. As in previous studies, split-half reliability was used because the screener measures heterogeneous test items (Kamphaus & Reynolds, 2007). Spearman-Brown Split-half reliability was 0.962 (TF), 0.939 (PF), and 0.904 (SF).
External Validity
The external concurrent validity properties of the BESS forms were also examined. Nonparametric Independent Samples Kruskal-Wallis Tests were used to examine criterion-related validity between each of the forms and the academic (ORF) and behavioral (ODR, suspensions, attendance) measures. A comparison of group means via MANOVA was considered; however, it was determined that the data set violated a number of the assumptions (including distributional normality). Based on the Box’s Test of Equality of Covariance Matrices, the dependent variables violated the assumption of equality of covariance (p < .001). In addition, Levene’s Test revealed unequal variance across groups. Finally, the ODR, suspensions, and attendance variables were not normally distributed, as the vast majority of the children in the sample had never had an ODR or suspension and were present and on time for school. Based on these violations, nonparametric tests to compare means were required. Because of a low number of students in the extremely elevated category of both the PF (n = 11) and SF (n = 19), the elevated and extremely elevated groups were combined for analyses.
Results of the omnibus Kruskal-Wallis Test comparing BESS TF groups of normal (n = 353), elevated (n = 102), and extremely elevated (n = 37) on ORF, ODR, suspensions, and attendance revealed significant effects. For the TF, significant differences were found for ORF, χ2(2, n = 388) = 51.025, p < .001; ODR, χ2(2, n = 494) = 73.957, p < .001; and suspensions, χ2(2, n = 494) = 26.907, p < .001. Follow-up Kruskal-Wallis Tests revealed that significant differences existed between the normal and elevated groups in terms of ORF, χ2(1, n = 359) = 40.078, p < .001; and ODR, χ2(1, n = 457) = 25.217, p < .001. Additional Kruskal-Wallis Tests further revealed significant differences between the elevated and extremely elevated groups on ODR, χ2(1, n = 139) = 9.939, p = .002; and suspensions, χ2(1, n = 139) = 5.233, p = .022, using a Bonferroni corrected significance of .025.
The Kruskal-Wallis Tests for the PF were significant in the areas of ODR, χ2(1, n = 255) = 4.614, p = .032; and attendance, χ2(1, n = 250) = 4.394, p = .036. The Kruskal-Wallis Tests for the SF revealed significant differences in the areas of ORF, χ2(1, n = 204) = 7.790, p = .005; ODR, χ2(1, n = 212) = 13.098, p < .001; and attendance, χ2(1, n = 210) = 4.409, p = .036, while suspensions approached significance (p = .061). Characteristics of students by risk level may be found in Tables 4, 5, and 6.
Characteristics of Students by Risk Level on Teacher Form
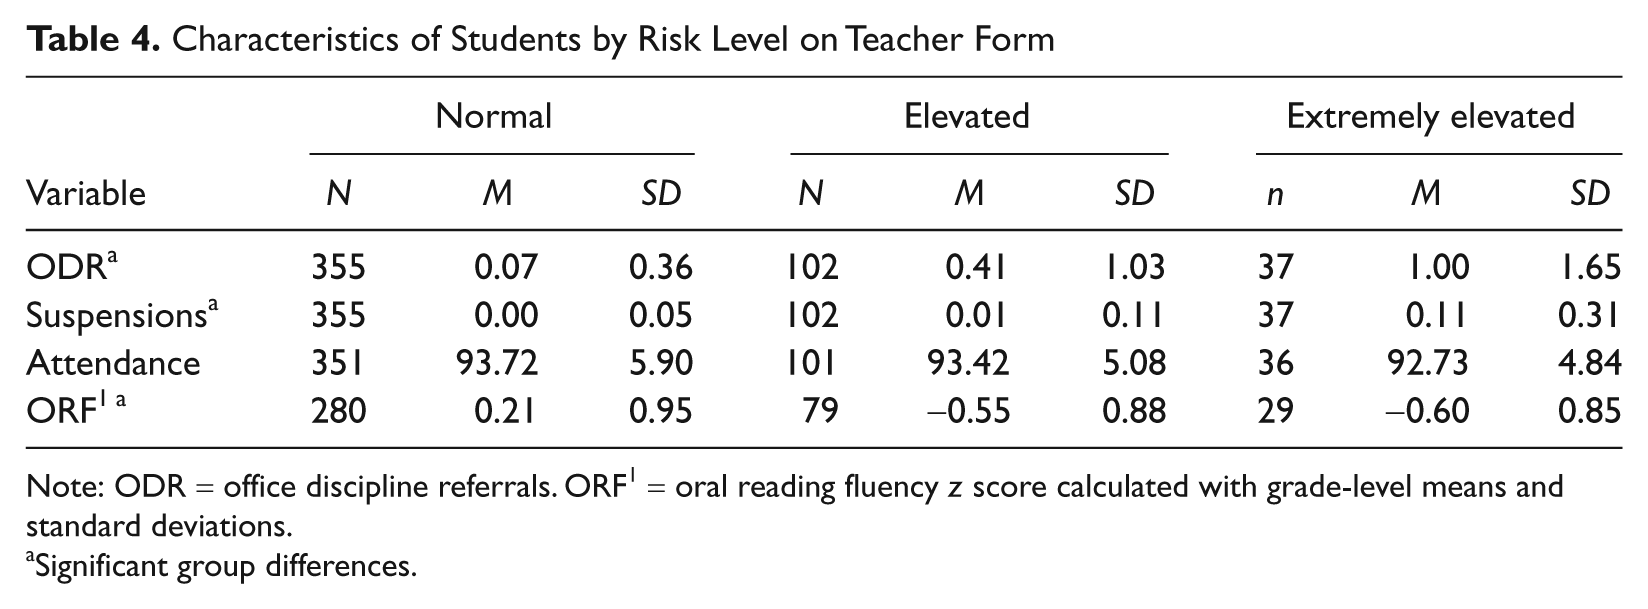
Note: ODR = office discipline referrals. ORF1 = oral reading fluency z score calculated with grade-level means and standard deviations.
Significant group differences.
Characteristics of Students by Risk Level on Parent Form
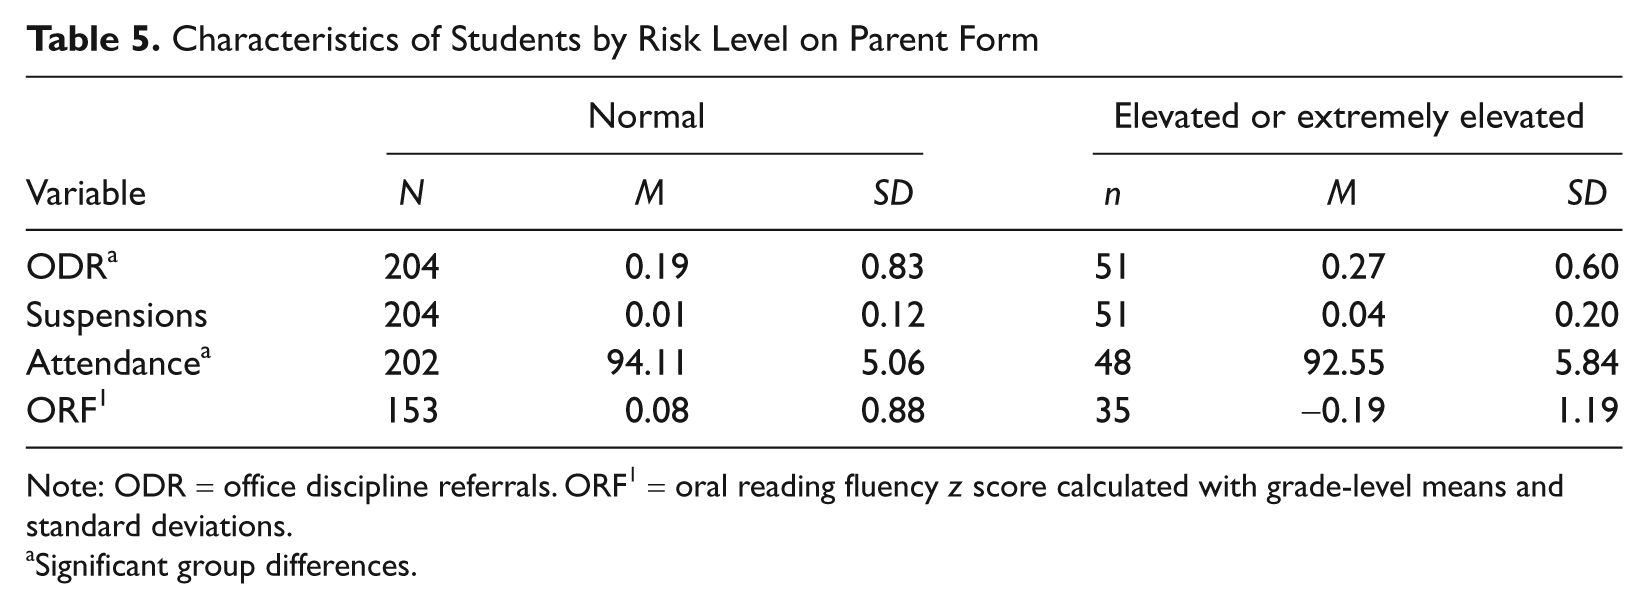
Note: ODR = office discipline referrals. ORF1 = oral reading fluency z score calculated with grade-level means and standard deviations.
Significant group differences.
Characteristics of Students by Risk Level on Student Form

Note: ODR = office discipline referrals. ORF1 = oral reading fluency z score calculated with grade-level means and standard deviations.
Significant group differences.
Diagnostic Accuracy
Diagnostic accuracy can be examined using conditional probability analyses or the likelihood of a predicted outcome given knowledge of the true outcome (see Hintze & Silberglitt, 2005). The methods include PPP (proportion of students predicted to develop the result of concern who actually develop it), NPP (proportion of students predicted to avoid the result of concern who actually avoid it), sensitivity (proportion of students developing the result of concern who are indicated as such by their diagnostic category), and specificity (proportion of students who avoid the result of concern who are indicated to do so by their diagnostic category). These four metrics are helpful for discerning the relationship between diagnostic categories and the extent of risk across students, the likelihood that limited intervention resources will be used efficiently, and the chances that at-risk students are likely to be found.
The PPP, NPP, sensitivity, and specificity of each of the BESS forms were calculated. For this analysis, the criterion was defined as receiving one or more ODRs by midyear. ODRs in the first semester of schooling are used for screening purposes in schools using SWPBIS and as a primary criterion variable in evaluating SWPBIS (e.g., McIntosh et al., 2006). Recent research found consistent mean growth in ODRs across the academic year and cut-points of 1 and 2 or more ODRs in fall were moderately accurate in predicting end-of-year ODRs (McIntosh et al., 2010). In addition, because the purpose of this analysis was to determine the usefulness of the BESS forms in correctly identifying children as at-risk, the elevated and extremely elevated groups were collapsed into one risk group for each form. The TF results had PPP of 39/139 = 28.1%, NPP of 337/355 = 94.9%, sensitivity of 39/57 = 68.4%, and specificity of 337/437 = 77.1%. The PF results had PPP of 10/51 = 19.6%, NPP of 186/204 = 91.2%, sensitivity of 10/28 = 35.7%, and specificity of 186/227 = 81.9%. The SF results had PPP of 19/67 = 28.4%, NPP of 131/145 = 90.3%, sensitivity of 19/33 = 57.6%, and specificity of 131/179 = 73.2%.
Interrater Reliability and Agreement
Interrater reliability and interrater agreement were examined (Table 3). Pearson correlations were calculated as a measure of interrater reliability. In addition, interrater agreement, or the extent to which raters identified the same children as “normal,” “elevated,” and “extremely elevated,” on the BESS forms was calculated. Data were included in this analysis if information was available from both raters. TF data were available for 494 students; PF and SF data were available for 255 and 212 students, respectively.
Pearson correlations revealed that the TF was significantly correlated with the PF (r = .389) and SF (r = .393). There was not a significant correlation between PF and SF. Interrater agreement is reported as the percentage agreement between raters of risk status according to the BESS forms. For this analysis, the BESS classifications of elevated and extremely elevated were combined (i.e., raters were considered to agree if the child was determined to be at either level of elevated risk). Results revealed that teachers and parents agreed on 72.7% of children who were identified as normal and 31.1% of children identified as at-risk (n = 255). Students and teachers agreed on 62.9% of children who were identified as normal and 37.0% of those identified as at-risk (n = 207). Students and parents agreed on 65.6% of those identified as normal and 15.4% of at-risk children (n = 101).
Discussion
The severity of EBD, paired with recent interest in SWPBIS and RTI, has led to the development of universal school screening instruments. The purpose of this study was to examine the properties of an instrument with a population of students in a rural, southeastern elementary school. This is the first study conducted by researchers other than the BESS authors or with the BESS standardization sample. The current study sought to compare the BESS with criteria that have been proposed for the evaluation of screening instruments (Lane et al., 2007). The internal consistency of the three BESS forms was measured to be well above the recommended standard for screening instruments (>.70) and were similar to those found in previous research (Kamphaus & Reynolds, 2007).
Criterion-related external validity was examined with measures of reading achievement, attendance, and behavior. Correlations among the TF, PF, and SF with criterion variables were significant, in expected directions, and low to moderate in magnitude. Examination of the risk groups (normal, elevated, extremely elevated) revealed that the TF showed significant group differences on the ORF, ODR, and suspensions variables. The PF risk groups revealed significant differences in attendance and ODR. The SF risk groups varied on ORF, ODR, and attendance. The criterion-related validity results are similar to those of Kamphaus et al. (2007). Both studies revealed that the TF was negatively related to academic variables (math and reading scores in Kamphaus et al., 2007; oral reading in this study). Results are consistent with previous work showing a relationship between behavioral and academic difficulties (Lane et al., 2008, 2010; Wagner, Kutash, Duchnowski, & Epstein, 2005; Walker et al., 1995; Walker, Shinn, O’Neill, & Ramsey, 1987).
Agreement among raters was reported in terms of interrater reliability and agreement. Interrater reliability, although significant for the TF and PF, was low (Cohen, 1977). There was not a significant correlation between SF and TF. In a large meta-analysis of cross-informant behavioral ratings, Achenbach, MsConaughy, and Howell (1987) found small correlations between raters, particularly between students and others (i.e., parents). Achenbach et al. suggested that low correlations may be due to actual changes in behavior by setting and argued for the use of multiple raters for additional information. The low level of agreement regarding risk status is an important area for future research. A regression model may be useful to determine what, if any, variance is explained with the addition of parent and student reports to screening. Based on the findings of the current study, including reliability and validity analyses, practitioners may consider the cost of additional forms and the usefulness of information provided when deciding to include parent and student input for screening.
As suggested by Lane et al. (2007), screening instruments should adhere to and report certain evidence. The current study sought to examine several of those properties; others have yet to be examined. The internal consistency and convergent validity of the BESS have now been examined in a few studies (see Kamphaus & Reynolds, 2007; Kamphaus et al., 2010; present study) and have been found to be adequate. Convergent validity with another behavior screening instrument, such as the BSC (Muyskens et al., 2007) should be a focus of future research.
In terms of diagnostic accuracy relative to ODRs, all forms demonstrated poor PPP, ranging from 19.6% to 28.4%. These results indicated that of those with elevated or extremely elevated risk, at most, a little more than a quarter will receive one or more ODRs. The accuracy of all forms, in indicating those students who would later receive an ODR, ranged from sensitivities of 35.7% to 68.4%, or at worst the diagnostic risk categories accounted for one third of the total number of students receiving at least one ODR and at best a little more than two third of the total. The forms performed better in terms of NPP (90.3% to 94.9% of those in the normal group not receiving an ODR) and specificity (73.2% to 81.9% of students not receiving an ODR also not in the elevated groups). Diagnostically, the instrument was better at predicting who would not receive an ODR than who would. Of the forms, the TF performed the best with both the SF and PF faring less well. ODRs are widely used for screening and evaluation purposes in SWPBIS across the United States. Research examining the diagnostic accuracy with other indicators of risk is needed.
Universal behavior screening is intended to identify children in need of intervention. Screening measures must also be cost-effective and easy to administer (Lane et al., 2007). However, there is a tension between research and feasibility. The authors of the BESS set sensitivity and specificity to overidentify children at-risk for behavioral difficulties. Overidentification significantly increases the cost and time required to complete screening. Although it is important to identify potential significant problems, the practical limitations found in applied settings need to be considered.
Finally, limitations of the current study must be discussed. At the time of data collection, only the English version of the PF was available. Future research should examine the psychometric properties of the Spanish version. There were also significant group differences between parent responders and nonresponders in terms of home language, ethnicity, grade, and FRL status. Furthermore, the sample used in the current study was drawn from one rural elementary school. The sample contained 496 students (nearly every child in the school); however, when examined by grade level, the sample size narrows considerably. Future research should seek to draw a more comprehensive sample of students and parents.
Footnotes
Declaration of Conflicting Interests
The authors declared no potential conflicts of interest with respect to the research, authorship, and/or publication of this article.
Funding
The authors received no financial support for the research, authorship, and/or publication of this article.