
Abstract
Maze and reading comprehension rate measures are calculated by using measures of reading speed and measures of accuracy (i.e., correctly selected words or answers). In sixth- and seventh-grade samples, we found that the measures of reading speed embedded within our Maze measures accounted for 50% and 39% of broad reading score (BRS) variance, respectively. Combining reading speed with Maze accuracy to form Maze rate increased explained BRS variance by <2%. For our comprehension measures, reading speed accounted for 22% and 36% of BRS variance, which increased significantly to 49% and 44% when our reading comprehension rate measures were added to our models. Discussion focuses on the relationships between the measure of aloud reading speed embedded within many brief reading rate measures and the validity and sensitivity of these measures.
Deno and Mirkin (1977) described how special educators could use oral reading fluency (ORF) measures to evaluate remedial reading strategies by making within-student time-series comparisons. More recently, ORF measures have been used in response-to-intervention models to help identify students with reading deficits and to evaluate remedial procedures (Shapiro, 2011). Although psychometric evidence supports the application of ORF as a proxy for measures of broad reading skill development for Grade 1 through 5 readers (see, for example, Reschly, Busch, Betts, Deno, & Long, 2009), there are concerns with the reliability and validity of ORF measures (Chall, 1983; Poncy, Skinner, & Axtell, 2005; Samuels, 2007; Skinner, Neddenriep, Bradley-Klug, & Ziemann, 2002). Partially because ORF does not include a direct measure of comprehension, some have questioned the face validity of ORF measures, characterizing them as measures of word calling or word barking (Chall, 1983; Samuels, 2007). To some degree, these face validity concerns are mitigated by numerous studies supporting the concurrent validity of ORF with comprehension and broad reading skills measures (Fuchs & Fuchs, 1992; Williams et al., 2011). However, the empirical research base supports another, perhaps related concern; the sensitivity and validity of ORF appears to begin to diminish around fifth or sixth grade (Hintze & Shapiro, 1997; Jenkins & Jewell, 1993). Other brief reading rate measures may address these concerns.
Maze assessments require students to read passages where every nth word (e.g., every seventh word) is replaced with three options, the deleted word and two distracters. As students read passages, they attempt to circle correct words. The number of correctly selected words is often expressed as a rate measure. Evidence suggests that Maze rate measures are reliable and valid measures of global reading (e.g., Parker, Hasbrouck, & Tindal, 1992; Tichá, Espin, & Wayman, 2009) and may be more sensitive and valid than ORF when assessing advanced readers (Jenkins & Jewell, 1993).
ORF and Maze rate measures are calculated with the number of words correctly read aloud (ORF) or the number of correctly selected words (Maze rate) in the numerator and reading speed in the denominator. Often these rate measures are expressed as or converted to a common denominator (e.g., 1 min). Skinner (1998) proposed using similar procedures to more directly measure comprehension rates; students are timed as they read equivalent length passages aloud and then answer multiple-choice comprehension questions. Comprehension rate is calculated with the percentage of questions answered correctly in the numerator and seconds to read in the denominator. Comprehension rate measures can be converted to a per minute rate measure, the percentage of questions correct per minute, which provides an estimate of the percentage of the passage understood for each minute spent reading (Freeland, Skinner, Jackson, McDaniel, & Smith, 2000; Skinner et al., 2002).
Although reading comprehension rate measures may provide a more direct assessment of reading comprehension than some other brief measures, there are some limitations with these comprehension rate assessment procedures (Skinner et al., 2002). A variety of other factors may influence item response accuracy (Kuhn, Schwanenflugel, & Meisinger, 2010). For example, someone may comprehend a passage but responded poorly to comprehension questions because they failed to recognize or remember some minor facts. Poor test-taking skills, test anxiety, and failure to understand questions may deflate comprehension scores (Bell & McCallum, 2008). Alternatively, researchers have found evidence that reading comprehension rates were artificially inflated when students were instructed to read silently (Hale et al., 2005; McDaniel et al., 2001). Evidence suggested that students were scanning as opposed to reading the entire passage and applying prior knowledge or test taking, scanning, and recognition skills to select correct answers. Because scanning reduced the measure of time spent reading, these students reading comprehension rates scores were inflated when they did not read the entire passage. Other challenges associated with measuring comprehension rates include controlling for item and passage difficulty while holding passage length constant (Williams et al., 2011).
Reading Speed
Most researchers investigating the validity of brief reading measures have focused on the different numerators used to calculate various rate measures. However, both cognitive and behavioral theories support a relationship between reading speed and broad reading skill development. For example, as they are reading, rapid readers are likely to be expending less effort and cognitive capacity (e.g., attention and working memory) than slower readers; thus, rapid readers have more cognitive capacity available which should enhance their reading accuracy, fluency, prosody, and comprehension (Kuhn et al., 2010; Samuels, 2007). Typically, response effort and choice are inversely related (Friman & Poling, 1995) and rapid, automatic, or fluent reading is assumed to require less effort. Thus, all else being equal, slower readers are less likely to choose to read than faster readers because reading requires more effort. Because it takes them longer to read, slower readers are likely to receive more delayed and lower rates of reinforcement for reading than faster readers. In addition, because slow readers tend to comprehend less, the quantity and quality of reinforcement for reading is likely to be reduced (Skinner, 1998).
Slower readers are less likely to choose to read than faster readers because reading requires more effort and reinforcement for reading is weaker. This relationship between reading speed and choosing to read is critical because practice enhances skill development, including the ability to respond accurately, more rapidly, and with less effort. Thus, as rapid readers choose to read more, a broad range of reading skills are enhanced (Kuhn et al., 2010); further increasing the probability that rapid readers will choose to read. The opposite occurs with slow readers who may fall further behind in their reading skill development unless educators provide additional encouragement that increases the probability of them choosing to read (Skinner, Skinner, & Burton, 2009; Stanovich, 1986).
Deconstructing Brief Reading Rate Measures
Both cognitive and behavior theories support a causal relationship between reading speed and broad research skill development. Recently, researchers applied these theories to brief reading rate measures. Rather than investigating different numerators (e.g., words read aloud correctly, correct words selected), some researchers have focused on the amount of broad reading skill variance accounted for by the measure of aloud reading speed embedded within many brief reading rates measures (Skinner et al., 2009; Williams et al., 2011).
Williams et al. (2011) sequentially regressed Woodcock-Johnson Tests of Achievement (WJ-ACH; Woodcock, McGrew, & Mather, 2001) Brief Reading Composite (Brief) scores onto reading speed (i.e., seconds to read same length passages) followed by ORF (words correct divided by reading speed). Results showed that reading speed accounted for more than 40% of the Brief score variance in 4th-, 5th-, and 10th-grade samples. For all samples, when ORF was entered into the model the increases in reading composite score variance accounted for were small (2-7%) and not statistically significant. A similar evaluation of a comprehension rate measure revealed that the measure of reading speed embedded within the comprehension rate measure accounted for 63%, 60%, and 56% of the variance in WJ-III Broad Reading Cluster (BRC) scores in the 4th-, 5th-, and 10th-grade samples, respectively (Skinner et al., 2009). When reading speed was supplemented with percentage of questions answered correctly and converted to a comprehension rate measure, the amount of additional BRC score variance accounted for increased for the 4th- and 5th-grade samples but not the 10th-grade sample.
Although Skinner et al. (2009) and Williams et al. (2011) analyses suggest that the measure of reading speed embedded within brief reading rate measures may have similar or even more influence on the validity of these measures than what is measured in the numerator, there are several limitations associated with these studies. Two of the three analyses were conducted with the same data. Only two brief reading rates measures were analyzed, and only students from Grades 4, 5, and 10 were included. This final limitation is particularly troublesome given the decreasing correlations of ORF with broad reading skill measures that begin about fifth or sixth grade (Jenkins & Jewell, 1993).
Brief reading rate measures are being used as a proxy for broad reading measures (Shapiro, 2011). Although more directly measuring comprehension rates may enhance the face validity of brief reading rate measures, because much of this predictive validity may be accounted for by the measure of reading speed embedded within comprehension rate measures, assessing comprehension per se, may do little to enhance the validity of comprehension rate measures (Skinner et al., 2009). Our purpose was to extend the research on the amount of broad reading skill variance that can be accounted for by the measure of reading speed embedded within brief reading rate measures to sixth- and seventh-grade samples and to Maze rate and comprehension rate measures. Specifically, we used sequential regression to examine the BRC variance accounted for by reading speed and the additional variance accounted for when Maze and comprehension rate measures were entered into the models.
Method
Participants and Setting
For our secondary analysis, we used data from all the sixth- and seventh-grade participants from the Hale et al. (2011) study. We did not analyze the data from the fourth- and eighth-grade samples because there were fewer than 30 participants at each grade. We excluded the fifth-grade sample because there appeared to be some transposition errors in our data set, which could not be rectified. All sixth- and seventh-grade students from a private and a public school located in the Southeastern United States were given the opportunity to participate. All who provided parental consent, their assent, and completed all phases of the study were included. Table 1 provides a description of our samples by gender, ethnicity, and grade level. Our sixth-grade sample included more boys, and our seventh-grade sample more girls. Most participants were White, with few members of any other ethnic groups. Trained school psychology graduate students administered all measures at quiet areas within the schools (e.g., empty classrooms, offices).
Demographic Information for Sixth- and Seventh-Grade Samples

Materials and Measures
Reading comprehension predictors
Passages from the Timed Reading Series (Spargo, 1989) were used to collect comprehension data. For each grade level, the Timed Reading Series includes a book that contains 50 expository, 400-word passages that become slightly more difficult as they progress. Spargo used the Fry (1968) readability formula to confirm passage-reading levels. Passages address a variety of content areas, including science, history, health, sports, and leisure activities. Each passage is followed by 10, three-option, multiple-choice comprehension questions, 5 factual and 5 inferential questions. For each grade level, the first 20 passages were used in the study. Passages were randomly assigned to each student. Each student read three 400-word passages aloud and answered the 10 comprehension questions immediately after reading each passage.
Our comprehension rate measure (C-rate) was percentage of comprehension questions answered per minute of reading. C-rate was calculated by multiplying our comprehension accuracy measure (C-acc = the percentage of questions answer correctly), by 60 s and dividing by our reading speed measure (C-speed = the number of seconds the student took to read the passage aloud). For example, if a student read a passage in 240 s and answered 80% of the questions correctly, C-rate would equal (80% x 60 s) / 240 s = 20% per minute, which would indicate that the student comprehended 20% of the passage for each minute he or she spent reading (Skinner, 1998). Seconds spent reading and responding to questions were not included in our reading speed measure. For each student, C-rate was calculated for each of the three passages. To reduce the influence of sequence effects, extreme scores caused by prior knowledge of passage content (Skinner et al., 2009), and none equivalent passages (Poncy et al., 2005), each student’s median C-rate was analyzed. Each student’s median scores for each component of the C-rate measure (i.e., C-speed and C-acc) were also analyzed.
Neddenriep, Hale, Skinner, Hawkins, and Winn (2007) used passages from the Timed Reading Series (Spargo, 1989) to assess comprehension rate when students read silently and aloud and found that the aloud C-rate measures produced stronger correlations with BRC scores (r = .90, .96, .65) than silent C-rate (r = .62, .56, .53) across 4th-, 5th-, and 10th-grade sample, respectively. Confirming previous research (Hale et al., 2005; McDaniel et al., 2001), the weaker correlations for silent reading appeared to have been caused by students not reading passage, but skimming or pretending to read the passages. Hale et al. (2011) also found a strong correlation between median aloud C-rate scores and BRC scores with sixth-, seventh-, and eighth-grade samples (r = .723). Researchers using group and within-student repeated-measures designs demonstrated that aloud C-rate was sensitive and stable enough to evaluate treatments and detect differential treatment effects (Freeland et al., 2000; Hale et al., 2005; McDaniel et al., 2001; Ridge & Skinner, 2011; Skinner, Robinson, Adamson, Atchison, & Woodward, 1998).
Maze predictors
To collect Maze rate (M-rate) data, researchers altered AIMSweb (2006) Maze passages so each included 400 words, and each passage provided 10 opportunities for students to select the correct word from three options. Thus, our Maze measures were similar to the Timed Reading Series (Spargo, 1989) passages with respect to passage length (400 words), the number of multiple-choice items (10), and the number of response options for each item (3). The 10 opportunities to select words were distributed fairly evenly across each passage (i.e., every 35-45 words), and the word options were taken directly from the AIMSweb (2006) Maze passages. For each grade level, the first 20 passages were selected for inclusion in the study, and three passages were randomly assigned to each student.
We calculated our M-rate measures (i.e., items correctly selected per minute of reading) for each passage by multiplying our Maze accuracy measure (M-acc = the percentage of words selected correctly), by 60 s and dividing by our Maze reading speed measure (M-speed = seconds required to read the passage). We also analyzed the two measures used to calculate M-rate, M-acc, and M-speed. For all three measures each student’s median scores were analyzed.
Parker et al. (1992) reviewed 14 studies and reported a median validity coefficient of Maze measures with other tests of .63. Jenkins and Jewell (1993) found that for students in Grades 2 through 6 correlations of Maze scores with the Gates-MacGinitie Reading Tests (MacGinitie, Kamons, Kowalski, MacGinitie, & McKay, 1978) and the Metropolitan Achievement Tests (Prescott, Balow, Hogan, & Farr, 1984) ranged from .58 to .88. Tichá et al. (2009) found statistically significant alternate-form reliability for Maze measures (r > .80) and reported correlations between Maze and Minnesota Basic Standardized Test (Minnesota Department of Children, Families, and Learning, and NCS Pearson, 2001-2002) and the WJ-III (Woodcock et al., 2001) that ranged from .80 to .88. These studies support others who concluded that Maze rate measures are a valid and reliable measure of broad reading skills (e.g., Miura-Wayman, Wallace, Ives-Wiley, Tichá, & Espin, 2007).
Criterion measures, WJ-III scores
The primary criterion measure used for this study was BRC, which provides a comprehensive measure of decoding, speed, and comprehension (Woodcock et al., 2001). The WJ-III technical manual (McGrew & Woodcock, 2001) provides validity and reliability data on the BRC and the three subtests that comprise the BRC: Letter–Word Identification (LWI), Reading Fluency (RF), and Passage Comprehension (PC). The median reliability for the BRC ages 5 to 19 is .93, and the 1-year test-retest coefficient for ages 11 to 13 is .89. LWI measures a person’s ability to correctly identify letters and words that are arranged in an ascending order of difficulty. The median reliability for ages 5 to 19 for LWI is .91, and the 1-year test-retest reliability for ages 11 to 13 is .84. During RF, a person is given 3 min to quickly read simple sentences and answer a yes/no question regarding the accuracy of each sentence. For RF the median reliability for ages 5 to 19 is .90, and the 1-year test-retest coefficient for ages 11-13 is .70. PC measures a person’s skill at reading short passages and identifying a key missing word that makes contextual sense. The items become increasingly more difficult. For PC the median reliability for ages 5 to 19 is .83, and the 1-year test-retest coefficient for the 11- to 13-year-old group is .76. McGrew and Woodcock report correlations between the BRC score and the reading composite of the Kaufman Test of Educational Achievement (Kaufman & Kaufman, 1985) and the Wechsler Individual Achievement Test (Wechsler, 1992) of .76 and .67, respectively.
Procedures
General procedures
Each participant was assessed over three sessions: a reading comprehension session, a Maze session, and a WJ-III session. All sessions were completed within 1 week, with only one session completed each day. The three sessions were presented in counterbalanced order across students. School psychology students who administered the Maze and comprehension assessments were trained using description, demonstration, modeling, practice, and immediate corrective feedback. All students had taken a course and practica where they learned to administer and score the WJ-III and had been formally approved to administer the WJ-III by their university training program. Sessions were audio-taped, and tapes were used to collect procedural integrity and interscorer agreement data.
Reading comprehension
Reading comprehension assessment sessions generally lasted about 13 to 17 min. Each student read three passages randomly selected from the first 20 passages in the Timed Reading Series passages at her or his grade level. After the examiner and participant were seated in a quiet room, the examiner started the tape recorder and read standardized instructions indicating that the student was going to be asked to read three separate passages, aloud. Each student was encouraged to read quickly but was also informed to read carefully because after he or she finished reading each passage, the passage would be removed and he or she would be asked to answer some comprehension questions. Each student was told that the examiner could not answer any questions regarding the content of the passage. While reading, if the student paused for more than 3 s, the examiner provided the correct word. If the students skipped or began rereading a line the examiner redirected the student. On completion of the passage, the examiner stopped the audio recording, recorded the time required to read the passage, and removed the passage. Next, the examiner provided the multiple-choice comprehension questions and instructed the student to select the correct answer to each question by writing a checkmark in the appropriate box.
Maze
Maze sessions lasted about 11 to 15 min. After the examiner and participant were seated, the examiner started the recorder and began with a Maze practice passage. The examiner worked with the student on the example explaining how to complete a Maze passage. Once the student demonstrated that he or she understood the instructions, the examiner indicated that he or she was ready to work independently. The student was instructed to read out loud, and when he or she came to a group of three words to circle the word that made the most sense. The student was instructed to work as quickly as he or she could without making mistakes. After answering any questions, the examiner instructed the student to begin and started the stopwatch. While reading the passage, but not when selecting words, if the student paused for more than 3 s the examiner provided the word to the student and/or redirected the student when he or she skipped or began repeating a line. For each student, randomly selected passages were administered in random order.
WJ-III Ach
The WJ-III Ach assessment sessions generally lasted 15 to 20 min. The examiner and participant were seated in a quiet room. The examiner started the tape recorder and told the participant that he or she would be working on some reading activities. Test 1 (LWI), Test 2 (RF), and Test 9 (PC) were administered in order, using standardized procedures. The scores from all three of these subtests were used to calculate BRC scores.
Design and Analysis Procedures
Separate analyses were run for comprehension and Maze measures and for each grade level. We calculated three predictor variables for each measure; each student’s median speed, accuracy, and rate. BRC scores served our primary criterion variable.
We used Pearson’s r to analyze relationships among the various criterion and predictor variables. Then, we analyzed our data using sequential regression. First, we determined how much variance in the BRC scores was accounted for by reading speed. Next, we added the rate measure to determine how much additional BRC variance was accounted for. All analyses were considered statistically significant at the p < .05 level.
Procedural Integrity and Interscorer Agreement
An independent researcher randomly selected recordings of sessions and listened to the first 20% of all sessions where recordings were clear, audible, and the recording equipment functioned as designed. While listening to recordings, this researcher recorded procedural integrity data and the number of seconds required to read each passage. Data indicated that examiners followed procedures with 100% accuracy across all sessions reviewed. In addition, the recorded number of seconds required to read each passage never varied more than 2 s. The same researcher randomly selected and scored 20% of the Maze and comprehension passages. Interscorer agreement for comprehension questions answered correctly (C-acc) and correctly selected words (M-acc), scored on an item-by-item basis, was 100%.
Results
Data were screened for data entry errors and predictor variables were analyzed to test assumptions regarding normality, linearity, and outliers. Because screening procedures suggested several cases from the fifth-grade sample may have had transposition errors, we eliminated this group from our analysis. Our screening procedure revealed no data entry errors for the sixth- and seventh-grade data. In addition, we found no multivariate outliers (z > 2) when examining scatterplots for normality, linearity, and outliers. Consistent with previous research (e.g., Williams et al., 2011), reading speed scores demonstrated some positive skewness and were somewhat leptokurtic; however, both skewness and kurtosis values were <2.0. Scores on the WJ-III composites and subtests yielded some negative skewness.
Descriptive Statistics
Table 2 provides mean and standard deviation data. WJ-III scores are normed with a mean of 100 and a standard deviation of 15. Across both grade levels, WJ-III mean scores were negatively skewed, higher than the normative sample, but within the standard deviations obtained in the normative sample. WJ-III standard deviations were lower than the normative sample ranging from 8.01 to 12.77.
Means and Standard Deviations for C-speed, C-acc, C-rate; M-speed, M-acc, M-rate; and WJ-III Broad, WJ-III LWI, WJ-III RF, and WJ-III PC
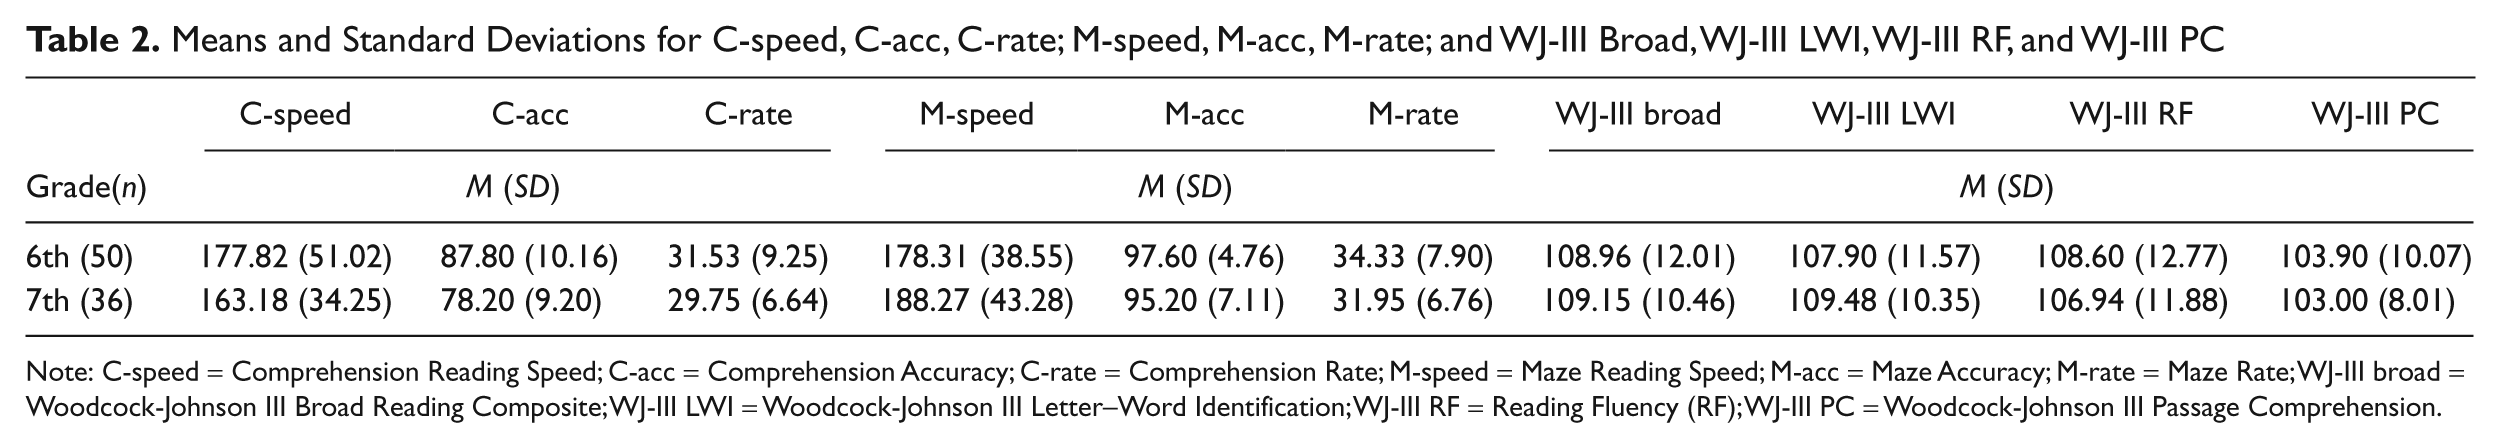
Note: C-speed = Comprehension Reading Speed; C-acc = Comprehension Accuracy; C-rate = Comprehension Rate; M-speed = Maze Reading Speed; M-acc = Maze Accuracy; M-rate = Maze Rate; WJ-III broad = Woodcock-Johnson III Broad Reading Composite; WJ-III LWI = Woodcock-Johnson III Letter–Word Identification; WJ-III RF = Reading Fluency (RF); WJ-III PC = Woodcock-Johnson III Passage Comprehension.
On comprehension passages, mean reading speed (C-speed) decreased from the sixth-to seventh-grade sample. On Maze passages, mean reading speed (M-speed) increased as grade level increased. While this pattern may be of interest, across both measures mean differences across grade levels never exceeded 1 SD. With respect to accuracy levels, across both measures (M-acc and C-acc) the sixth-grade samples had higher means than the seventh-grade sample. For both samples, average M-acc scores exceeded 95% and were higher than average C-acc scores. These findings suggest that ceiling effects may have influenced M-acc score more than C-acc scores, which may account for the smaller standard deviations on M-acc scores relative to C-acc scores.
Correlations
Correlational data are presented in Tables 3 and 4. In most instances the relationships between the variables trended either positively or negatively as expected. Across both grade levels and measures (Maze and reading comprehension) we found significant negative correlations between measures of reading speed (C-speed and M-speed) and each of the WJ-III measures. For both samples, there was a significant positive correlation between each rate measure (C-rate and M-rate) and each WJ-III measure, with one exception; the correlation between the M-rate and PC (r = .34), was not significant for the seventh-grade sample. Neither M-rate nor C-rate yielded consistently stronger correlations with WJ-III subtest scores and their correlations with BRC score were almost identical, .67 and .68 for the sixth-grade sample and .60 and .64 for the seventh-grade sample.
Correlation Matrix for Sixth-Grade Students
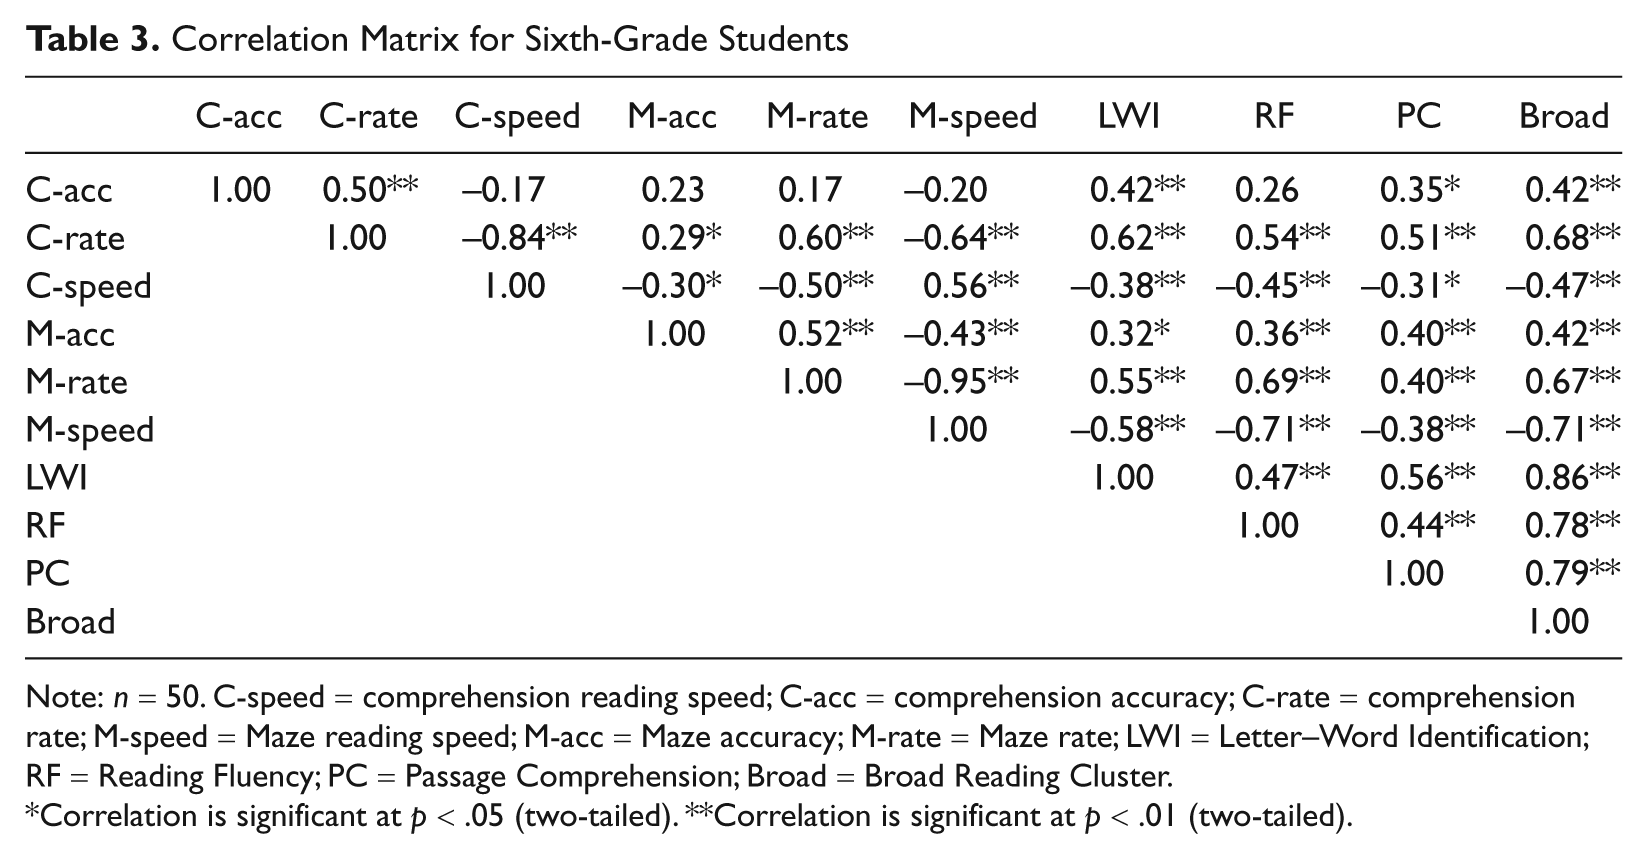
Note: n = 50. C-speed = comprehension reading speed; C-acc = comprehension accuracy; C-rate = comprehension rate; M-speed = Maze reading speed; M-acc = Maze accuracy; M-rate = Maze rate; LWI = Letter–Word Identification; RF = Reading Fluency; PC = Passage Comprehension; Broad = Broad Reading Cluster.
Correlation is significant at p < .05 (two-tailed). **Correlation is significant at p < .01 (two-tailed).
Correlation Matrix for Seventh-Grade Students
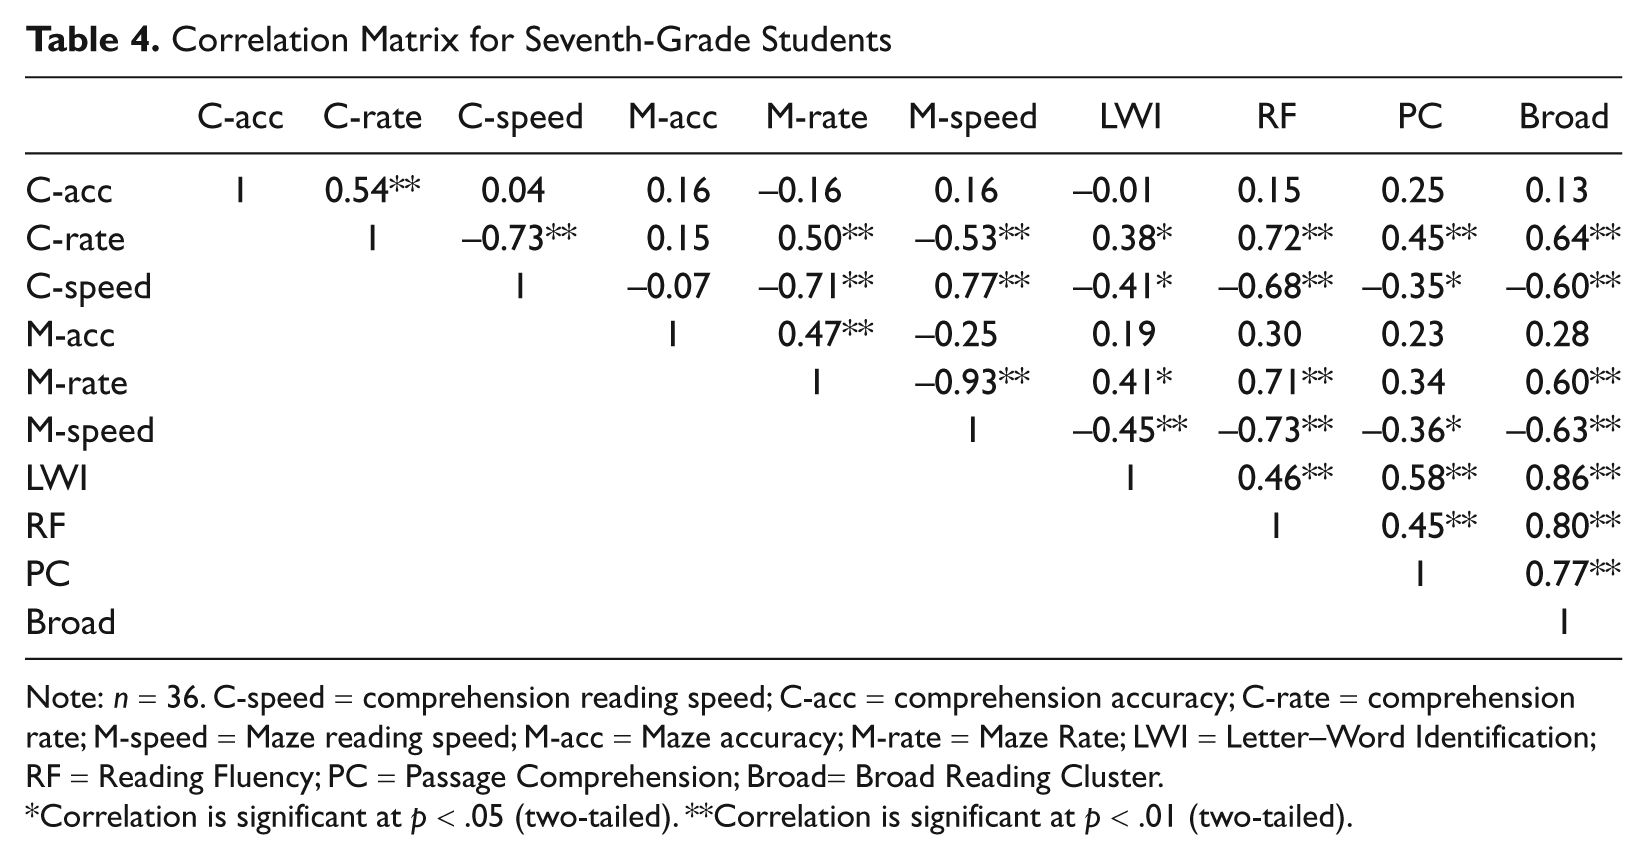
Note: n = 36. C-speed = comprehension reading speed; C-acc = comprehension accuracy; C-rate = comprehension rate; M-speed = Maze reading speed; M-acc = Maze accuracy; M-rate = Maze Rate; LWI = Letter–Word Identification; RF = Reading Fluency; PC = Passage Comprehension; Broad= Broad Reading Cluster.
Correlation is significant at p < .05 (two-tailed). **Correlation is significant at p < .01 (two-tailed).
Some findings presented in Tables 3 and 4 are noteworthy. For the sixth-grade sample, both the accuracy measures (C-acc and M-acc) were significantly positively correlated with all WJ-III measures, with one exception, the correlation between RF and C-acc (r = .26) was not significant. However, for the seventh-grade sample, neither C-acc nor M-acc significantly correlated with any WJ-III scores. Across-measure comparisons of correlation with each WJ-III measure across both grades showed reading speed correlations were always stronger for the Maze measure (M-speed) relative to the comprehension measures (C-speed).
Some within-measure comparisons across predictor variables were noteworthy. For the comprehension measures, with one exception (LWI in the sixth-grade sample), the rate measure (C-rate) had the strongest correlations with WJ-III scores, the accuracy measure (C-acc) correlated weakest, and the reading speed measure (C-speed) fell in between. A different pattern emerged for the Maze measure. With one exception (PC in the sixth-grade sample), reading speed (M-speed) correlated strongest with WJ-III scores, accuracy (M-acc) weakest, and the rate measure (M-rate) fell in between. To further investigate these patterns, which suggest that converting reading speed to a rate measure may have enhanced the predictive validity of the comprehension measure, but not the Maze measure, we ran two sequential regressions.
Sequential Regressions
Table 5 displays the regression analyses for Grades 6 and 7 in which reading speed and rate measures were applied sequentially to predict BRC scores. Across both grade levels, reading speed (C-speed and M-speed) accounted for a significant amount of BRC score variance. When comprehension rate (C-rate) was entered into the regression equation, it accounted for an additional 27% of the BRC score variance in the sixth-grade sample and 9% in the seventh-grade sample. Both of these increases were statistically significant (df = 1,46; p < .001). However, for both samples when M-rate data were entered into the equations it accounted for either very little (1%) or no (0%) increase in BRC variance.
Summary of Sequential Regression Analyses for Comprehension (Speed and Rate) and Maze (Speed and Rate) Measures on WJ-III Broad Reading and Brief or Alternate Brief Reading Scores for Sixth- and Seventh-Grade Samples
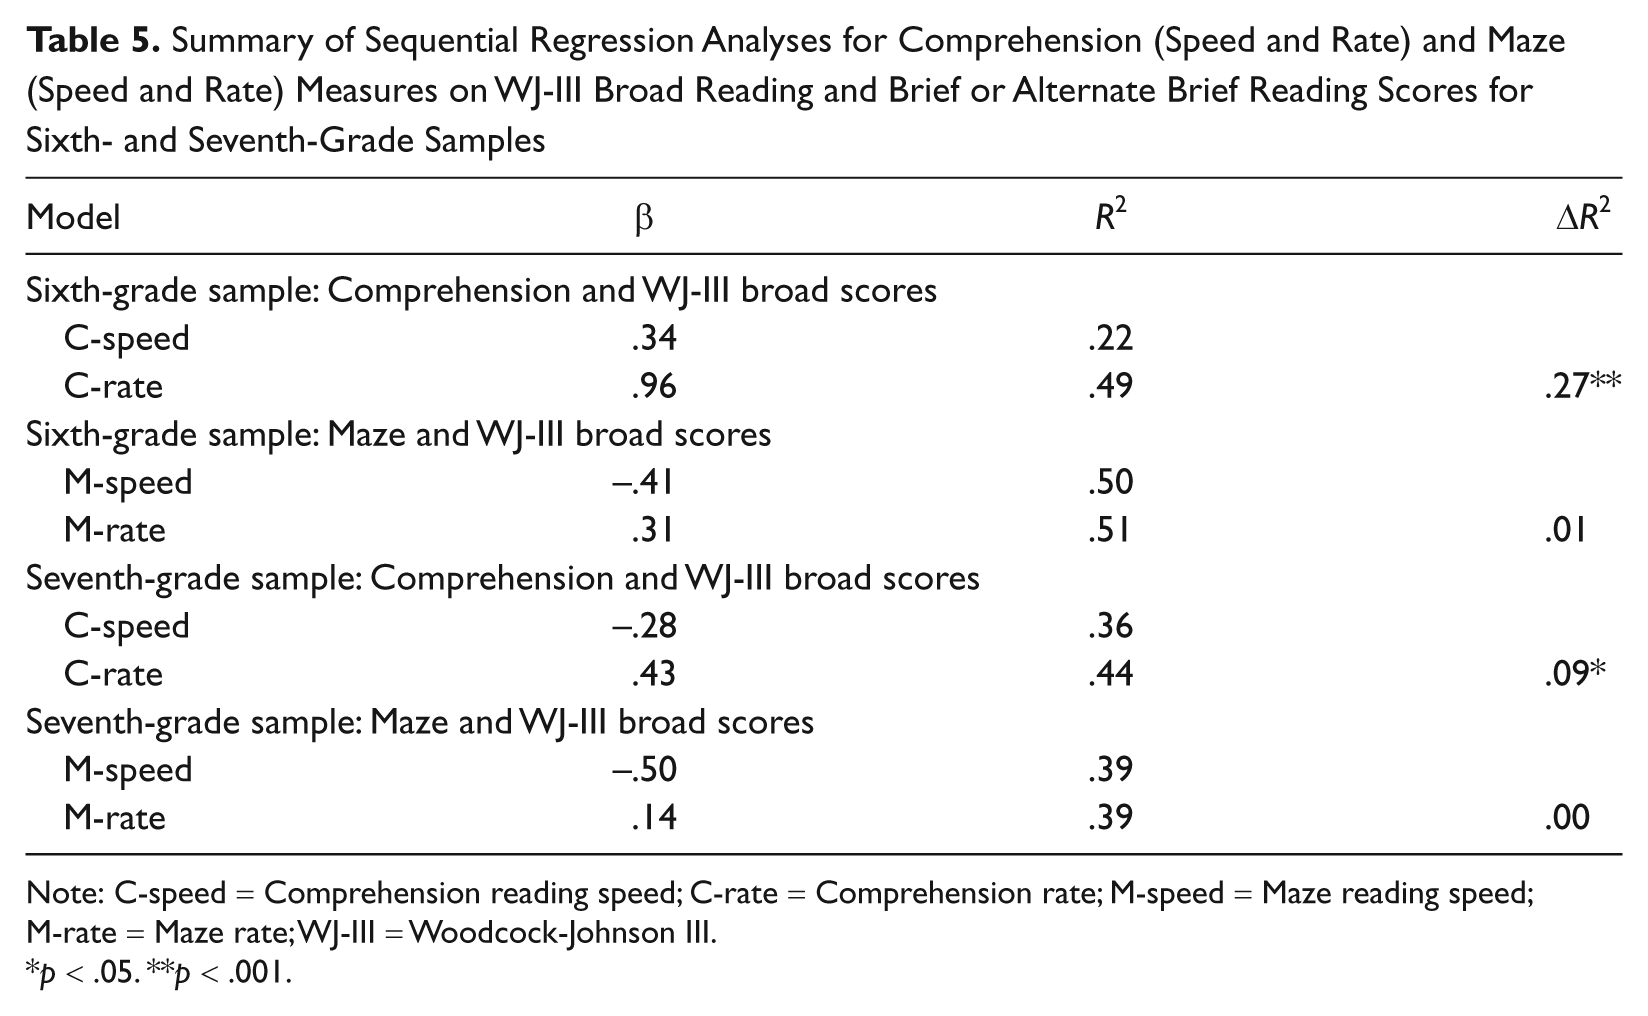
Note: C-speed = Comprehension reading speed; C-rate = Comprehension rate; M-speed = Maze reading speed; M-rate = Maze rate; WJ-III = Woodcock-Johnson III.
p < .05. **p < .001.
Discussion
With the current study, we provided the first analysis of reading speed embedded within Maze rate measures and extended the research on comprehension rate measures to sixth- and seventh-grade samples. For the sixth- and seventh-grade samples, the measure of reading speed embedded within Maze and reading comprehension rate measures significantly correlated with BRC scores. Although we did not test a causal model, our correlational findings are consistent with behavioral and cognitive theories that describe a causal relationship between reading speed and reading skill development (Samuels, 2007; Skinner, 1998). In addition, our findings are consistent with previous research on ORF and reading comprehension rates in 4th-, 5th-, and 10th-grade samples (Skinner et al., 2009; Williams et al., 2011). Together these results provide evidence that the measure of reading speed embedded within brief reading rate measures can account for a significant amount of broad reading score variance.
For our sixth-grade sample, both accuracy measures were significantly correlated with almost all WJ-III measures and for the BRC these correlations were identical (r = .42). Alternatively, with the seventh-grade sample neither accuracy measure was significantly correlated with any WJ-III scores. As previous researchers investigating brief reading rate measures found similar patterns (Skinner et al., 2009; Williams et al., 2011), our findings support their hypothesis that as reading skill increases, what is measured in the numerators becomes less important than the measure of reading speed embedded within the reading rate measures.
For Maze, our regressions suggest that the reading speed and reading rate measures had strong covariance across both samples. Consequently, altering the reading speed measure by combining it with words accurately selected and converting it to a Maze rate measure accounted for almost no additional unique variance in BRC scores. Williams et al. (2011) found similar results when they examined the relationship between ORF and WJ-III scores in 4th-, 5th-, and 10th-grade students. Alternatively, for our comprehension measure altering the reading speed measure to a rate measure caused a significant increase in the amount of BRC score variance accounted for in both samples. These results are consistent with Skinner et al. (2009) who found that converting reading speed to a comprehension rate measure increased BRC reading score variance accounted for in fourth- and fifth-grade samples.
Additional studies are needed to determine why converting comprehension speed to a rate measure enhanced BRC variance accounted for but converting Maze reading speed to a rate measure did not. Although we attempted to hold much constant across Maze and comprehension assessments (e.g., passage length, number and type of items), differences in how reading speed was measured may account for our discrepant regression findings across measures. During Maze assessments, the reading speed measure included time required to select words, but during reading comprehension assessments the time required to read and select correct answers was not incorporated into the reading speed measure. Researchers should determine if including time required to answer comprehension questions enhances the validity of the C-speed and C-rate measures.
As WJ-III subtests have test re-test reliabilities less than .8 and our sample sizes were small, interpretations based on correlational and descriptive data must be tempered. However, these data may provide directions for researchers attempting to explain our inconsistent regression results. For example, our accuracy data may explain why converting C-speed to a rate measure enhanced BRC variance accounted for, but converting M-speed to a rate measure had little impact on BRC variance accounted for. The high M-acc scores (97.6% and 95.2%) relative to C-acc scores (87.8% and 78.2%) and smaller variance in M-acc (SDs = 4.76 and 7.11) relative to C-acc (SDs = 10.16 and 9.20) suggest that M-acc data may have been more influenced by ceiling effects than C-acc data. These ceiling effects may have restricted M-acc score variance and the amount of BRC variance accounted for by the M-acc and the M-rate measures. However, if M-acc variance was artificially restricted by ceiling effects, then these same effects should have reduced the correlations between M-acc and all WJ-III scores. Our data show that M-acc scores were more strongly correlated with WJ-III scores than C-acc scores across five of the eight analyses, C-acc were more strongly correlated for two of the eight analyses and for the sixth-grade sample the M-acc and C-acc yielded identical correlations with BRC.
An alternative interpretation is supported by our correlations. Across both samples the M-speed accounted for more variance in all WJ-III scores than C-speed, which suggests that the amount of variance accounted for by our speed measures may explain our conflicting regression findings. Thus, in addition to investigating ceiling effects, future research should determine if the large amount of variance accounted for by M-speed prevented us from finding any additional variance when supplementing M-speed with M-acc and combining these two measures to form M-rate.
When students read Maze passages their reading was interrupted by the requirement to select words; yet, M-speed was a stronger predictor of WJ-III scores than the measure of reading speed taken during uninterrupted comprehension assessments. This finding does not support Skinner’s (1998) suggestion that using procedures that more closely approximate typical reading will enhance the validity of brief reading rate measures. Rather, researchers should investigate whether interrupting or interfering with aloud reading enhances the validity of reading speed, and consequently, the validity of brief reading rate measures, particularly with more skilled readers.
Researchers should address several limitations associated with the current study. The samples were small and participants were selected based on parent permission and student assent. In addition, we only analyzed data from two grade levels. As another brief reading rate measure (ORF) appears to begin losing some of its validity and sensitivity around fifth or sixth grade (Jenkins & Jewell, 1993), similar studies are needed with larger, systematically selected samples, across more grade levels. We analyzed only two brief rate measures and one broad reading criterion measure. Studies are needed with other reading rate and criterion measures.
We held constant reading topography (aloud), passage length (400 words), item number (10), item response form (multiple choice), and response options (3), which caused us to violate several procedures typically used during Maze assessments. Often every seventh word is converted to an item and students read silently, without prompting, for a specific amount of time such as 1, 2, or 3 min (Fuchs & Fuchs, 1992; Tichá et al., 2009). Because our findings cannot be generalized to other Maze assessment procedures, researchers should conduct similar studies where they alter the comprehension assessment procedures to match typical Maze procedures.
Our evidence of ceiling effects on accuracy measures supports the need for similar studies with passages that allow for more opportunities to select words and answer comprehension questions (Skinner et al., 2009). In addition, researchers may find that altering comprehension questions to free response production tasks (as opposed to multiple-choice selection tasks) may reduce ceiling effects and provide a more sensitive and valid measure of comprehension, as opposed to recognition, memory, test-taking skills, and/or guessing (Neddenriep et al., 2007). Similar changes in Maze item responding (i.e., altering selection to free responding) would result in researchers investigating another brief reading rate measure known as Cloze (Fuchs & Fuchs, 1992).
Summary
As numerous decisions are being made based on the assumption that brief reading rate measures are an adequate proxy for measures of broad reading skills, researchers should continue to attempt to improve these measures (Shapiro, 2011). Our results support others who found that the measure of reading speed embedded within brief reading rate measures may account for much broad reading variance (Skinner et al., 2009; Williams et al., 2011). Together, these findings suggest that rather than altering what is measured in the numerator, those interested in improving brief reading rate measures may want to focus on enhancing the predictive validity of the measure of reading speed embedded within most brief reading rate measures. For example, given that speed accounted for so much variance, future researchers could determine if increasing passage length enhances correlations of reading speed with broad reading skills measures (see Tichá et al., 2009). Although this shift may appear counterintuitive, this novel approach may allow researchers to develop brief reading measures that more accurately indicate broad reading skill development.
Footnotes
Declaration of Conflicting Interests
The authors declared no potential conflicts of interest with respect to the research, authorship, and/or publication of this article.
Funding
The authors disclosed receipt of the following financial support for the research, authorship, and/or publication of this article: This paper was completed with the support of the Korn Learning, Assessment and Social Skills (KLASS) Center at The University of Tennessee.