
Abstract
The current study assessed the measurement equivalence of the Wong & Law Emotional Intelligence Scale (WLEIS) with three groups of Chinese university students. Two research sessions were conducted—one in Beijing, China with university students (N = 680), and the other in Calgary, Canada where two groups of Chinese students were administered the WLEIS in either Chinese (N = 151) or English (N = 151). The WLEIS had satisfactory reliability, the four-factor structure was replicated, and metric invariance was supported across the three groups. The present study provided empirical support to the growing emotional intelligence measurement invariance literature and demonstrated the robustness of both the English and Chinese versions of the WLEIS.
The last decade has seen an increased interest in the concept of emotional intelligence (EI). In an analysis of 20 years of emotional intelligence research, the percentage of cross-cultural focused articles was 1.8% (Stough, Saklofske, & Parker, 2009). Moreover, the most commonly used EI measures have been developed in North America and Europe, but only a few of these scales such as the Emotional Quotient Inventory (Bar-On, 1997, 2000) have been validated in other cultures and languages. Cross-cultural studies addressing measurement invariance and equivalence of EI scales are important as more use is made of such scales in the international context (e.g., Ekermans, Saklofske, Austin, & Stough, 2011; Parker et al., 2005; Rahim, Psenicka, Polychroniou, Zhao, Yu, Cjan et al., 2002; Van Rooy, Alonso, & Viswesvaran, 2005) When tests developed in one culture are employed in another, the comparability of psychological measurements across different cultural groups cannot be assumed. Parker et al (2005) cautioned that special care is needed when examining the EI construct in different cultures because culture can influence the experience and expression of emotions.
The aim of this study was to test the measurement invariance, specifically, the metric invariance of the Wong and Law Emotional Intelligence Scale (WLEIS; Wong & Law, 2002) with three Chinese student groups. Originally developed in Hong Kong in English, this study focused on whether the four-factor model of the WLEIS, defined by Self-Emotion Appraisal (SEA), Other’s Emotion Appraisal (OEA), Use of Emotion (UOE), and Regulation of Emotion (ROE), is invariant across three different groups of Chinese university students. Our specific objective was to examine both cultural and linguistic influences by assessing invariance across two countries (i.e., Canada and China) and two versions of the scale (i.e., English and Chinese). In addition, the two language comparison with groups of Chinese students allows for consideration of cultural influences beyond what may be problems primarily associated with the quality of the translation. Moreover, Candell and Hulin (1986) noted that such comparisons would allow for examinations of different sources of bias (i.e., language and culture). The basic design of this study was to compare groups of university students in Beijing and Canada who were administered the Chinese version of the WLEIS, and then further compare these results to those of Chinese students in Canada who completed either a Chinese or English version of the same scale. The samples in this study allowed for an examination of the comparability of the EI construct and questionnaire responses and to determine if either or both language and culture affected the results. The lexicon of different countries and cultures shows both overlap and uniqueness in describing, interpreting, and expressing human characteristics such as personality and intelligence (e.g., Fukuda et al, 2011; Yan, Saklofske, & Oakland, 2009). Furthermore, increasing fluency in another language and exposure to another culture, to the point of acculturation, will certainly alter how human behavior is perceived, described, expressed, and even valued. Although the WLEIS was developed in Hong Kong where the two official languages are English and Chinese (Cantonese), the samples in our study were from Beijing, China and speak Mandarin. The two Canadian samples were ethnic Chinese who were also bilingual (Chinese-English). Comparison across the three groups provides a deeper exploration of how EI is defined and measured in a different country and language and whether this scale is invariant with increasing exposure to another culture, language, or both.
Emotional Intelligence
From both a theoretical and measurement perspective, EI can be divided into ability and trait models. Salovey and Mayer (1990) first proposed a systematic theory of EI as an intelligence or ability. Their model focuses on “the interplay of emotion and intelligence” (Mayer, Salovey, & Caruso, 2000, p. 399). They argue that the ability to identify, use, understand, and manage one’s emotions can lead to better problem-solving skills in one’s emotional life.
In contrast is the proposal that EI is more akin to a personality trait (Bar-On, 1997). Measures based on this view describe EI as a trait (Austin, Saklofske, Huang, & Kenney, 2004; Petrides & Furnham, 2000, 2001, 2003; Saklofske, Austin, & Minski, 2003). Trait EI is conceptualized as “a constellation of behavioral dispositions and self-perceptions concerning one’s ability to recognize, process, and use emotion-laden information” (Petrides & Furnham, 2003, p. 278). The majorities of EI studies have focused on self-report trait measures because they are somewhat easier to construct, administer, and score. However, the challenge is to determine the robustness and validity of these measures across different groups.
Whichever measure is used to assess EI cannot sidestep the invariance question. Although the “best” method of measuring EI is currently an area of controversy, it is recognized that emotions, even though biologically based, are socially and culturally shaped and maintained (Kitayama & Markus, 1994), and this includes the learning, control, expression, and perception of emotion (Matsumoto & Ekman, 1989). Furthermore, culture affects societal norms and standards related to emotional expressions and recognitions (Matsumoto & Ekman, 1989). Self-report EI measures tap into typical attributes of the individual’s thoughts, feelings, and behaviors in certain situations and data can be gathered quickly and efficiently. Therefore, using self-report tests in cross-cultural settings is an efficient and common approach to assessing emotional intelligence but only if equivalence of the construct and the psychometric integrity of the scale in use can be established.
Measurement Invariance
A major task ahead is to establish whether EI and the measures emanating from it are relevant across culturally diverse groups (e.g., Byrne & Campbell, 1999; Byrne & Watkins, 2003; Greenfield, 1997; van de Vijver & Leung, 1997; van de Vijver & Poortinga, 1997). Meaningful and valid cross-group comparisons can only be made after measurement invariance has been established (Byrne & Campbell, 1999; Poortinga, 1989; van de Vijver & Leung, 1997, 2000). Measurement invariance refers to the comparability of the quantitative estimation of psychological variables or constructs. Measurement invariance exists when items measuring a given construct are perceived and interpreted in the same way, and the response scale is used in the same way across different samples (Robert, Lee, & Chan, 2006), providing support for the hypothesis that the instrument is measuring the same psychological construct(s) across different groups.
Measurement invariance analyses are used to evaluate two broad assumptions underlying construct validity (Little, 1997; Steenkamp & Baumgartner, 1998; Vandenberg & Lance, 2000; Widaman & Reise, 1997). The first assumption is that the observed mean differences across groups reflect the latent mean differences, and are indeed because of true group differences. The second assumption is that convergent and discriminant validity correlations can be interpreted on face value. Without an examination of equivalence or evidence of measurement invariance, it is impossible to know to what extent different scores obtained from an instrument can be unambiguously interpreted in these ways, central to the evaluation of construct validity (e. g., Horn & McArdle, 1992; Steenkamp & Baumgartner, 1998). The demonstration of measurement equivalence is a logical prerequisite to the evaluation of hypotheses regarding group differences, regardless of whether the comparison is a simple between-group mean differences or more complex between theoretical structural models.
Cross-Cultural EI Research and the Current Study
In reviewing the growing literature on EI, comparatively few cross-cultural studies have reported measurement invariance results (Stough, Saklofske, & Parker, 2009). More empirical evidence is needed to determine whether the EI construct, originally developed in Western culture, replicates as an identical set of psychological constructs in other cultures and languages (Matthews, Zeidner, & Robert, 2002). Drawing from other studies, cultural differences might result in bias that influences the meaningfulness and generalizability of results when Western EI measures are applied to non-Western cultures (e. g., van de Vijver & Poortiga, 1997; van de Vijver & Tanzer, 1997). Of course, the same argument applies to those very few EI measures developed in Eastern countries, such as the WLEIS.
Although the Chinese version of the WLEIS has been validated with Chinese students in Mainland China, we do not have evidence to support the measurement invariance when Chinese students respond in a different language (e.g., English) and have lived and studied in different countries (e.g., Canada). However, while the validity and factor structure of the WLEIS has been supported in several studies conducted in Hong Kong (Law, Wong, & Song, 2004; Wong & Law, 2002), China (Shi & Wang, 2007), Japan (Fukuda et al., 2011), and Korea (Fukuda, Saklofske, Tamaoka, & Lim, 2012), including a sample of international students (Ng, Wang, Zalaquett, & Bodenhorn, 2008), only the Fukuda et al (2011) Japanese study provided preliminary support for the measurement invariance of the WLEIS. Data from the Korean study showed that several items had less definite factor assignments (Fukuda et al., 2012). More extensive study with larger samples from other countries is needed to validate the robustness of the EI construct and the scales used to assess the EI scale. Thus the purpose of this study is to determine how well the WLEIS “travels” when completed by Chinese students in China in contrast to those who have come to Canada to study and have been exposed to Western culture and further, have acquired a good foundation of the English language. Specifically, it was hypothesized that the WLEIS factor structure would show measurement invariance across groups, when examined in pair-wise comparisons. In the categorical item measurement model, scalar or strong measurement invariance is defined as equality of loadings and thresholds across group comparisons (Millsap & Yun-Tien, 2004; Widaman & Reise, 1997). In the event that the null hypothesis of full measurement invariance is rejected, the hypothesis of partial measurement invariance will then be evaluated (Byrne, Shavelson & Muthen, 1989). Partial measurement invariance may involve failure to observe invariance for some combination of item loadings and thresholds across groups.
Method
Sample
The present research included three samples of students who completed the WLEIS. The first cohort was from Beijing, China and was comprised of 680 Chinese university students from universities in Beijing (females = 435; males = 239; 6 not identified), who all passed the China University Entrance Examinations. The mean age of the Beijing (BJ) sample was 20.85 years (SD = 2.36). Information about this study was given to students in class, and those who volunteered to participate were administrated the WLEIS in Chinese (Mandarin). The second and third group of students were registered at the University of Calgary, but who came from China. They all had provided proof of proficiency in English when admitted to this Canadian University. Information about this study was posted on campus and those who volunteered to participate were assigned randomly to the CC group and CE group. The WLEIS was administered to the CC group (71 = males, 80 = females) in Chinese (Mandarin), their mean age was 23.03 years (SD =3.12). The CE group (72 = males, 79 = females) completed the English version and their mean age was 20.37 years (SD = 3.28).
Measures
The WLEIS is a 16-item self-report trait EI measure using a 5-point Likert-type scale (1 = totally disagree to 5 = totally agree). The measure consists of four correlated scales each comprised of 4 items: Self-Emotion Appraisal (SEA), Other’s Emotion Appraisal (OEA), Use of Emotion (UOE), and Regulation of Emotion (ROE). Sample items include “I have a good sense of why I have certain feelings most of time (SEA), “I always know my friend’s emotions from their behavior” (OEA), “I always set goals for myself and then try my best to achieve them” (UOE) and “I have good control of my own emotions” (ROE).
English and Chinese versions of the WLEIS were provided by the developers, and these versions were used in this study.
Data Analysis
The first step in testing measurement invariance is to assess whether the factor structure of the WLEIS can be replicated across different groups (Byrne, 1998; Widaman & Reise, 1997). A confirmatory factor analysis (CFA) examined whether the four-factor structure of the WLEIS replicated in each of the three groups. We used the weighted least squares estimator with mean and variance adjustments (WLSMV) suited to CFA models with ordered categorical items and Mplus version 6.12 (Muthén & Muthén, 2011). Although the maximum likelihood (ML) estimator may perform satisfactorily with five or more ordered categories derived, for example, from Likert-type scales (Kline, 2010), as noted below, some of the item responses were very skewed and not all of the five response categories were used by respondents in all samples. Therefore the WLSMV estimator was used throughout. With the WLSMV estimator, values of χ2 and degrees of freedom are subject to the Sartorra-Bentler correction (Muthén & Muthén, 2011). Values of the WLSMV χ2 and degrees of freedom are, as the term implies, subject to sample mean and variance adjustment, so degrees of freedom may vary with the same CFA model across different samples (Muthén & Muthén, 2011). In addition, values of the WLSMV χ2 and degrees of freedom reported as differences between nested invariance models are not interpretable on face value in the way that is possible with maximum likelihood estimation. Baseline model fit was evaluated with the two-step approach of Hu and Bentler (1999), which places most emphasis on χ2 and the Root Mean Square Error of Approximation (RMSEA), followed by the Tucker-Lewis Index (TLI, or Non-Normed Fit Index: NNFI) and Comparative Fit Index (CFI) to identify the best fitting model. The four-factor model of the WLEIS was contrasted with a one-factor model in each sample to ensure that the four-factor model provided statistically significant improvement in fit compared with a single, general EI factor.
If the results of the baseline CFA suggest that the same four-factor model fits best in the three groups, configural invariance can be assumed to apply across groups. Baseline or configural invariance assumes only that the same pattern of indicators correspond to the same number of factors across groups (Widaman & Reise, 1997). Furthermore invariance tests can then be conducted to assess metric invariance across groups. The invariance testing process involves several steps of increasingly restrictive measurement assumptions (Millsap & Yun-Tien, 2004; Vandenberg & Lance, 2000; Widaman & Reise, 1997). Metric invariance tests that the relationship between the factors and the items are equivalent. In other words, if metric invariance is supported, the conclusion can be made that the Chinese students comprising different samples interpret and respond to the items in the same way (Byrne, 1998; Millsap & Yun-Tien, 2004; Vandenberg & Lance, 2000; Widaman & Reise, 1997).
Loss of fit with incremental restrictions on invariance models was evaluated with the WLSMV χ2 together with changes in the RMSEA, CFI and TLI. Because χ 2 is sensitive to slight loss of fit with incremental invariance restrictions, especially in larger samples, consideration of the implications of practical fit indices such as the RMSEA, CFI and TLI are recommended (Brown, 2006; Cheung & Rensvold, 2002; Kline, 2010). Vandenberg and Lance (2000) suggest that when comparing successive invariance models across groups, RMSEA values below .06, and TLI values of .95 or above reflect excellent fit. Cheung and Rensvold (2002) have argued that changes in CFI of—.01 or less indicate that the invariance hypothesis should not be rejected.
Results
Descriptive and Reliability Analysis
Table 1 shows the mean scores for Self-Emotional Appraisal (SEA), Other’s Emotional Appraisal (OEA), Use of Emotion (UOE), and Regulation of Emotion (ROE) for the three groups were comparatively smaller than those reported by Wong and Law (2002). Internal consistency reliability, calculated by Cronbach’s alpha coefficients for each subscale and the total WLEIS across samples, yielded similar results to those reported by Wong and Law (2002; see Table 1) with coefficients ranging from .78 to .91.
Descriptive Statistics and Reliability of the WLEIS in the Three Chinese Groups and the Wong and Law (2002) Sample
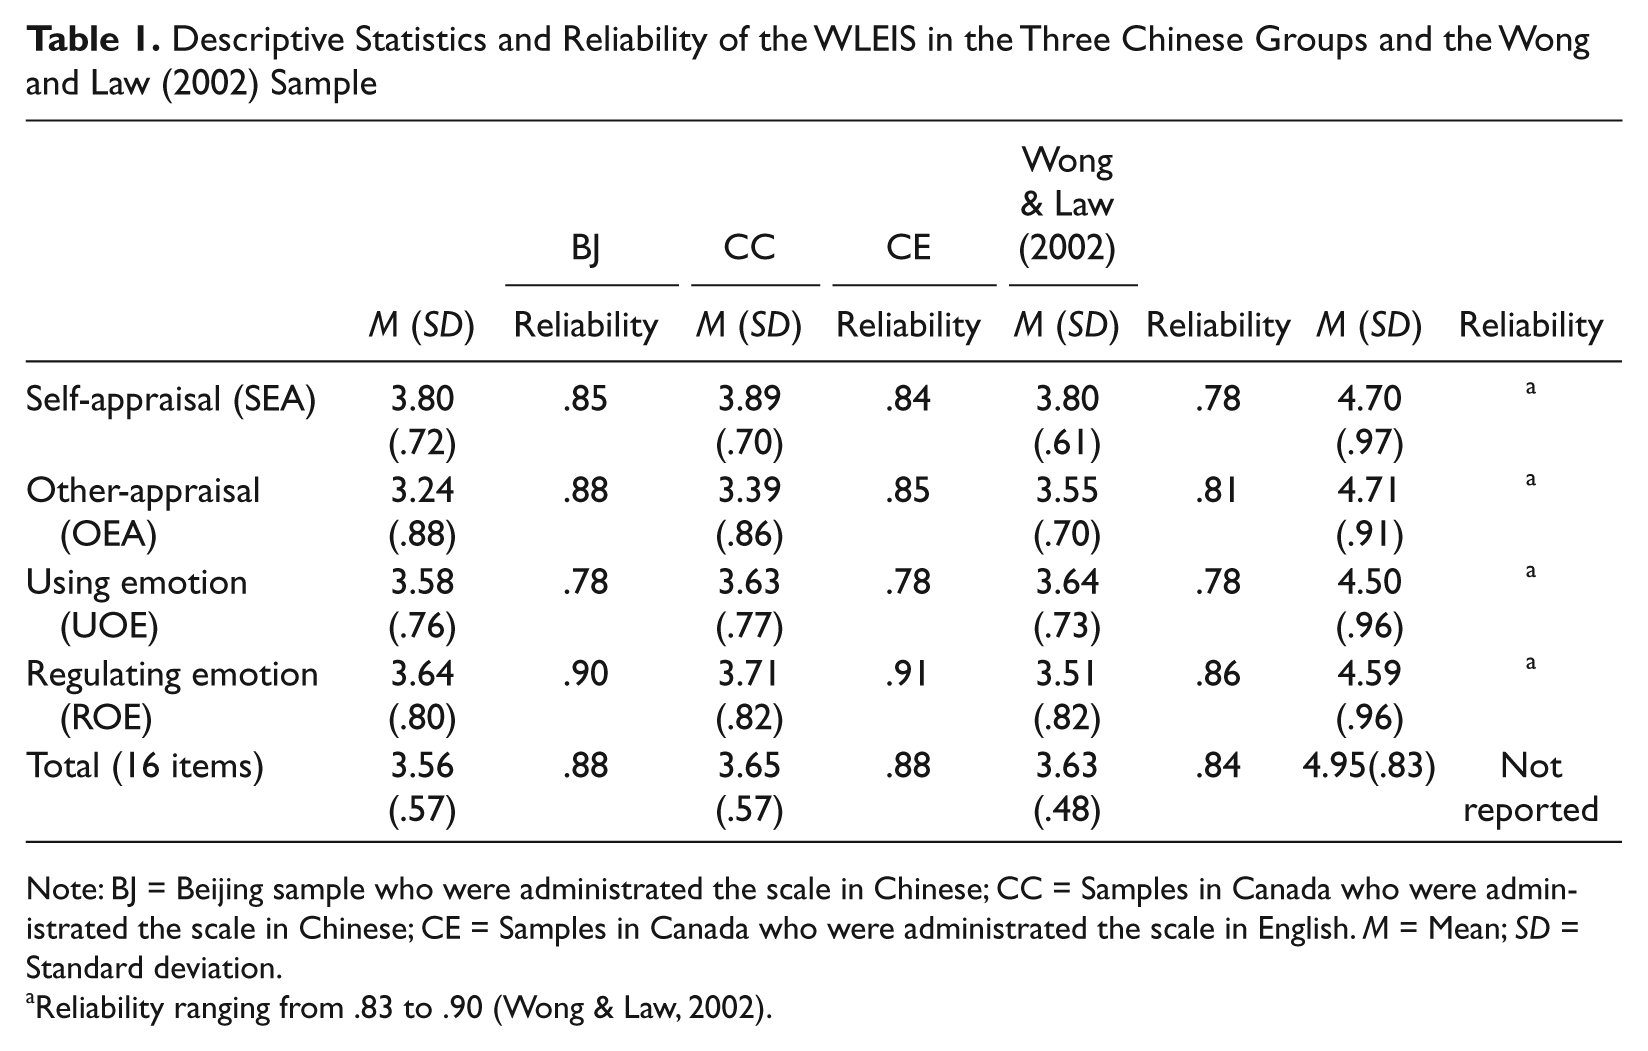
Note: BJ = Beijing sample who were administrated the scale in Chinese; CC = Samples in Canada who were administrated the scale in Chinese; CE = Samples in Canada who were administrated the scale in English. M = Mean; SD = Standard deviation.
Reliability ranging from .83 to .90 (Wong & Law, 2002).
Baseline Confirmatory Factor Analysis
The results of the CFA revealed that the four factor structure of the WLEIS was replicated in the three groups and provided a better fit than a single-factor model (see Table 2). Difference testing in each group also showed that the four-factor model was a statistically better fit than the one-factor model (all three WLSMV χ2 differences p < .05). The RMSEA indicated a good fit in the Beijing sample but less adequate for the two Canadian samples. However, the RMSEA is sensitive to sample size and may show a less adequate fit for the two smaller Canadian samples. In contrast the CFI and TLI indices showed excellent fit for the four-factor model in all three samples (Table 2). In line with recommended practice for identification of an acceptable CFA model (Brown, 2006; Henson & Roberts, 2006; Kline, 2010), inspection of the parameter estimates showed that all factor loadings were significant and examination of modification indices showed no opportunity for model improvement in any sample. Following from Wong and Law’s EI model and other research results (e.g., Fukuda et al., 2011; Li, 2010; Li, Saklofske, & Yan, 2008; Shi & Wang, 2007; Wong & Law, 2002), the four-factor model (SEA, OEA, ROE, UOE) was accepted as best fitting in all samples.
Fit Indices for Baseline Model Estimation in Each Sample
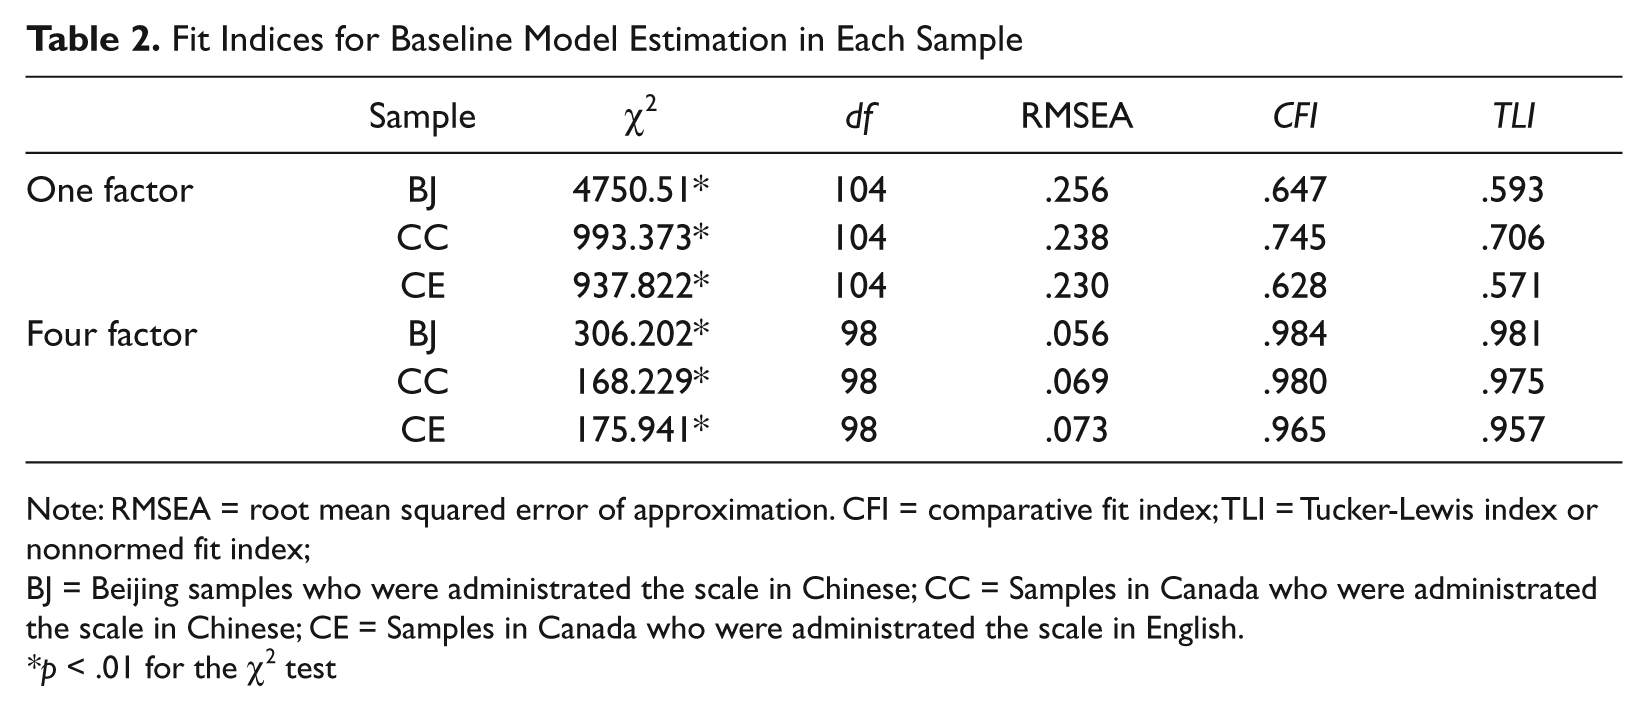
Note: RMSEA = root mean squared error of approximation. CFI = comparative fit index; TLI = Tucker-Lewis index or nonnormed fit index;
BJ = Beijing samples who were administrated the scale in Chinese; CC = Samples in Canada who were administrated the scale in Chinese; CE = Samples in Canada who were administrated the scale in English.
p < .01 for the χ2 test
Table 3 and 4 shows the completely standardized factor loadings derived from the CFA of the WLEIS estimated simultaneously in the three groups, together with the correlations between factors. All of the factor loadings were positive and significant in the three groups.
Standardized Factor Loading for the Four Factor CFA Model of the WLEIS in BJ (n = 680), CC (n = 151) and CE (n = 151) Samples
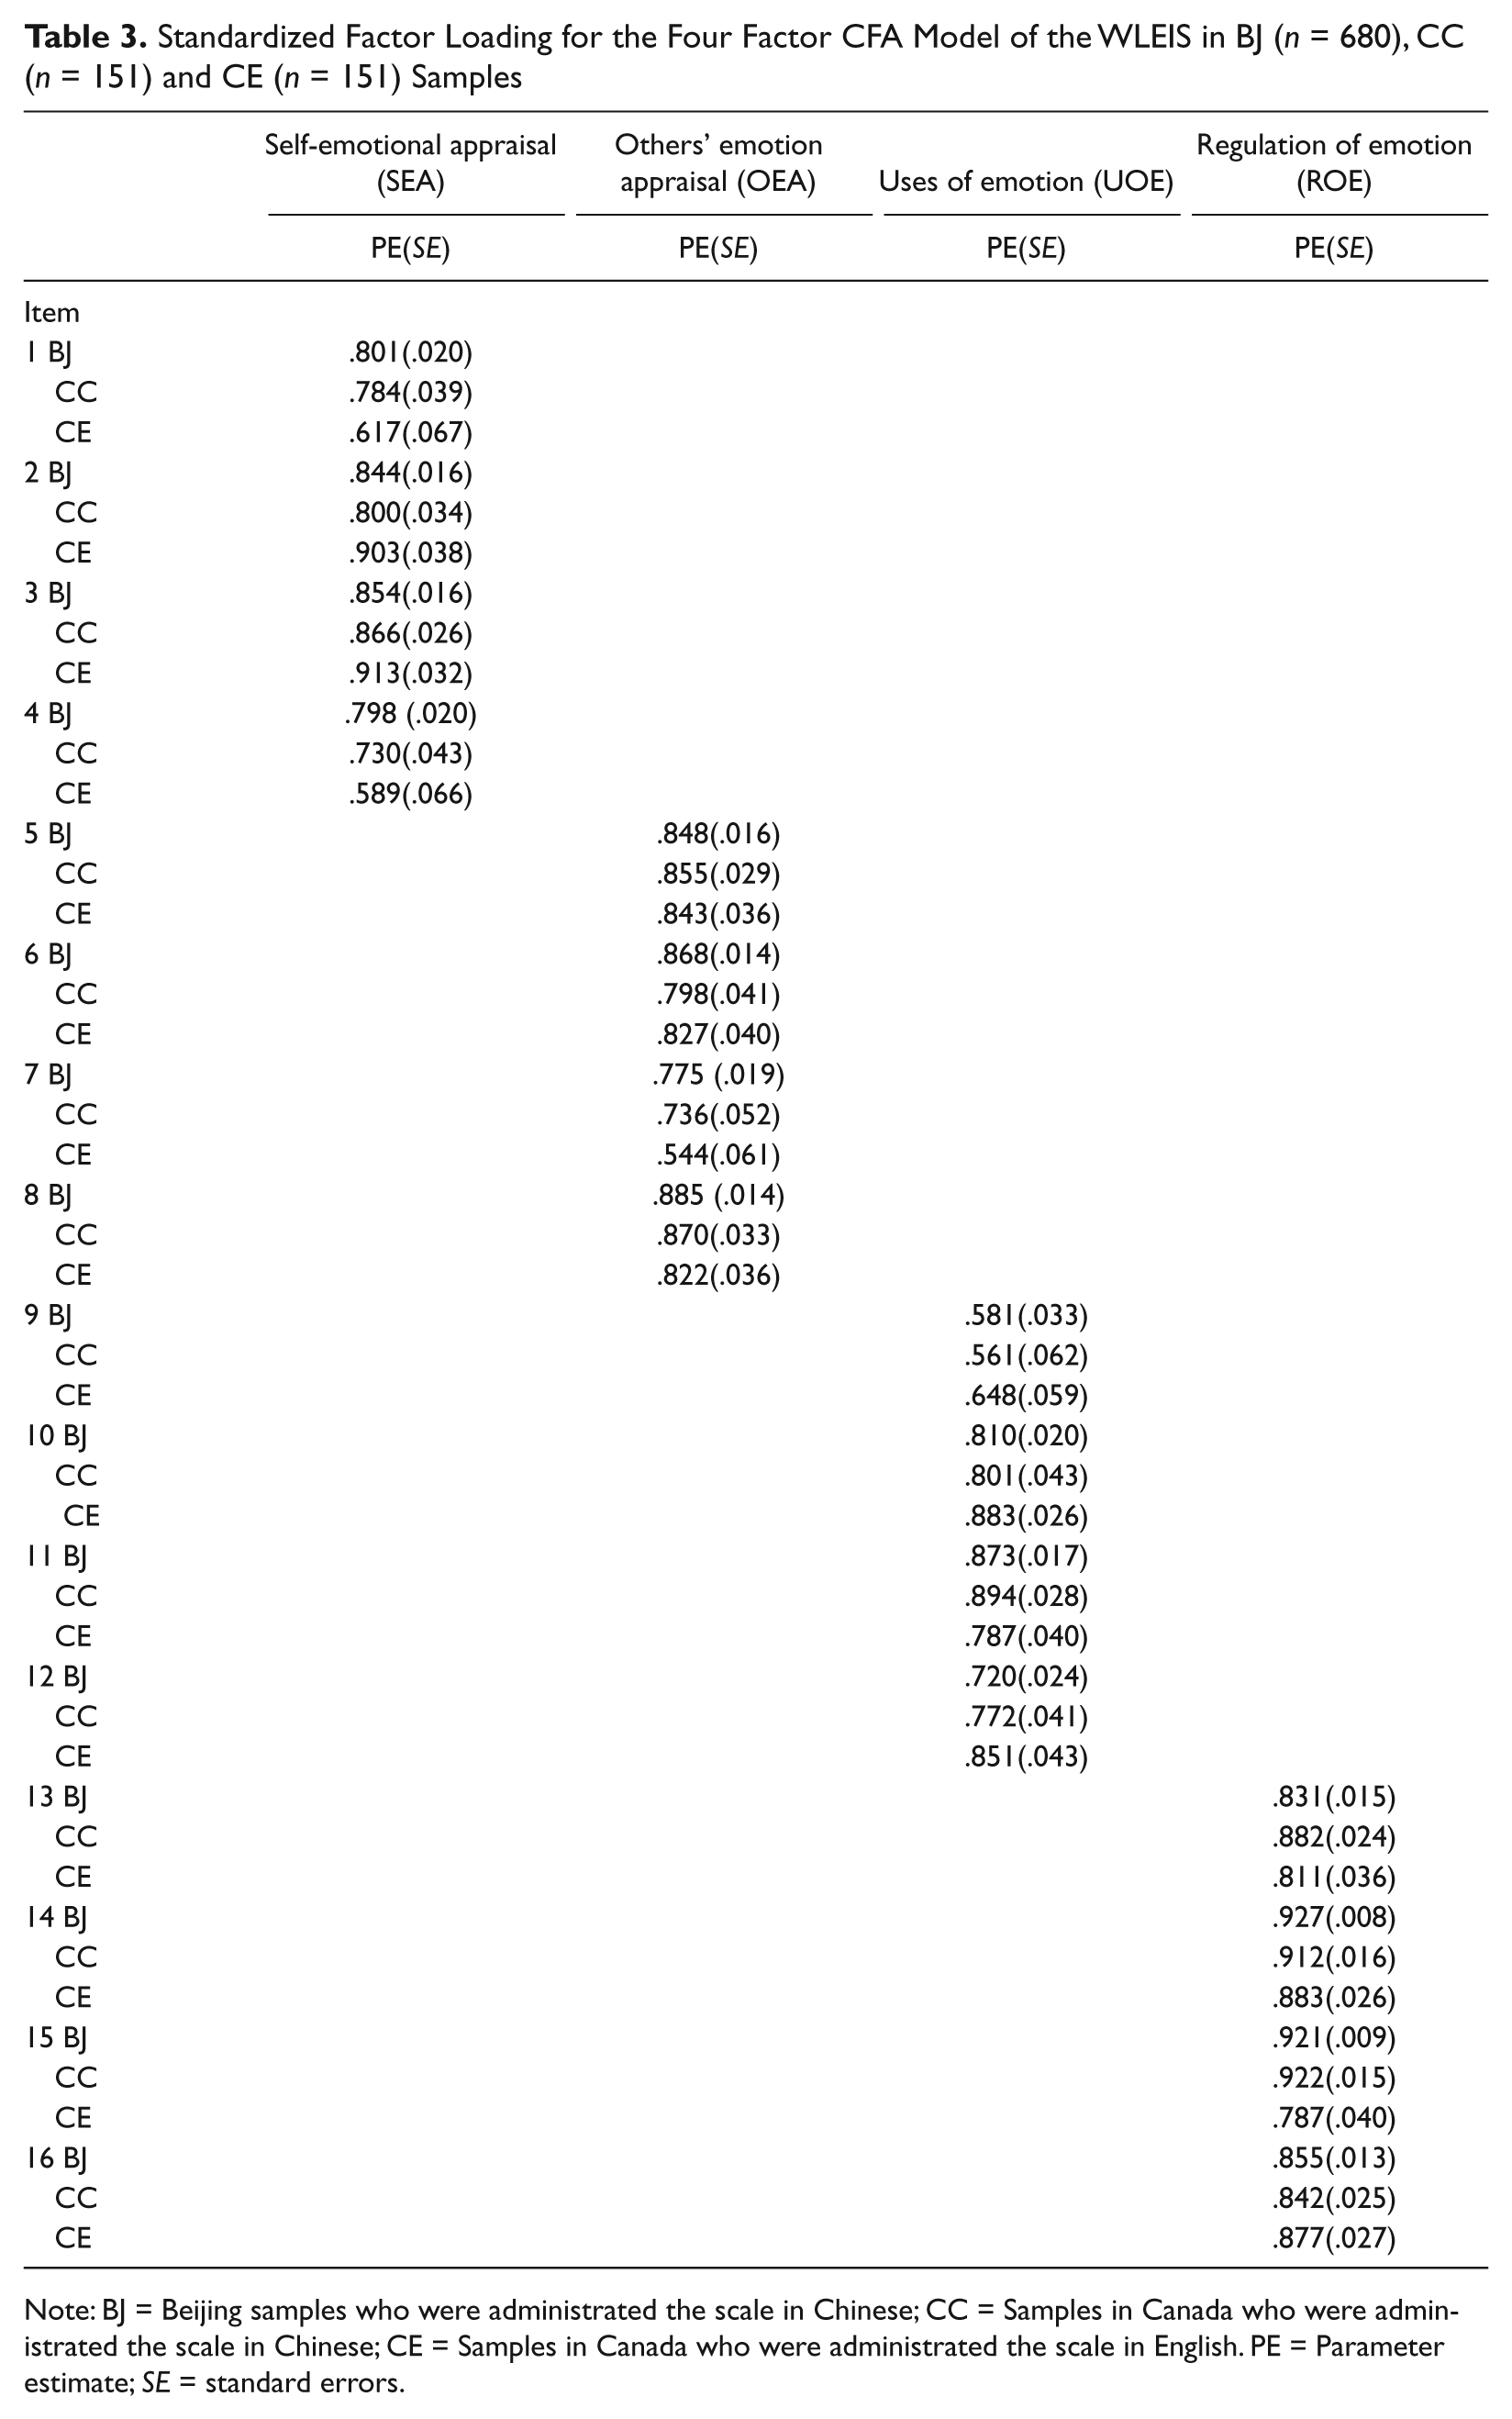
Note: BJ = Beijing samples who were administrated the scale in Chinese; CC = Samples in Canada who were administrated the scale in Chinese; CE = Samples in Canada who were administrated the scale in English. PE = Parameter estimate; SE = standard errors.
Correlation Matrix of the WLEIS Four Factors in the BJ (n = 680), CC (n = 151), and CE (n = 151) samples
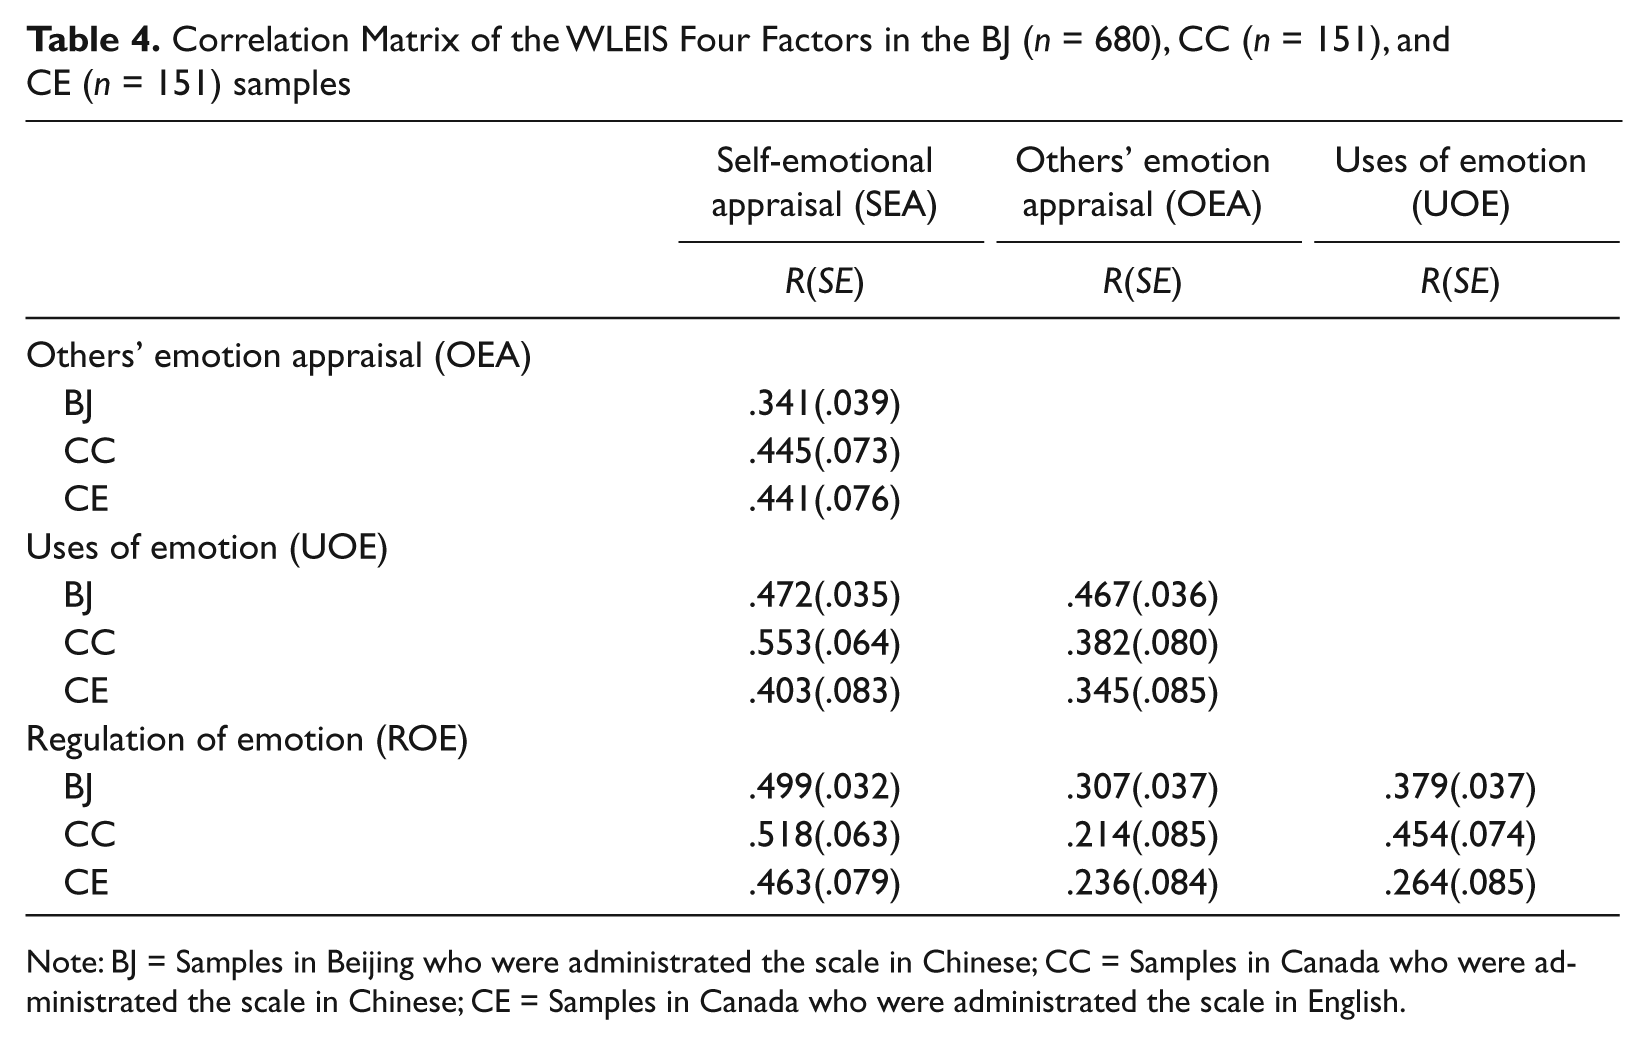
Note: BJ = Samples in Beijing who were administrated the scale in Chinese; CC = Samples in Canada who were administrated the scale in Chinese; CE = Samples in Canada who were administrated the scale in English.
Testing Measurement Invariance
Having established configural invariance, measurement invariance was then examined. Model identification and invariance testing followed published recommendations (Millsap & Yun-Tien, 2004; Vandenberg & Lance, 2000; Widaman & Reise, 1997). With the categorical item estimator (WLSMV), two steps in incremental restriction of model parameters are recommended. The first involves comparison of the baseline model to a model in which factor loadings and thresholds are held invariant, in addition to those required for model identification. Holding loadings and thresholds to invariance is equivalent to testing for scalar invariance, implying that constructs are measured on the same scale across groups (Horn & McArdle, 1992). The second step involves additional restrictions on indicator residuals. Because of low endorsement frequencies at the totally disagree (category 1) end of the item response scales for most items in the two Canadian samples, it was necessary to combine category 1 and 2 item responses to conduct the invariance analysis.
For simplicity, invariance was examined across the BJ versus CC groups, and the BJ versus CE groups. Results are shown in Table 5.
Summary of Testing of Invariance of the WLEIS Across the BJ (n = 680), CC (n = 151), and CE (n = 151) Samples
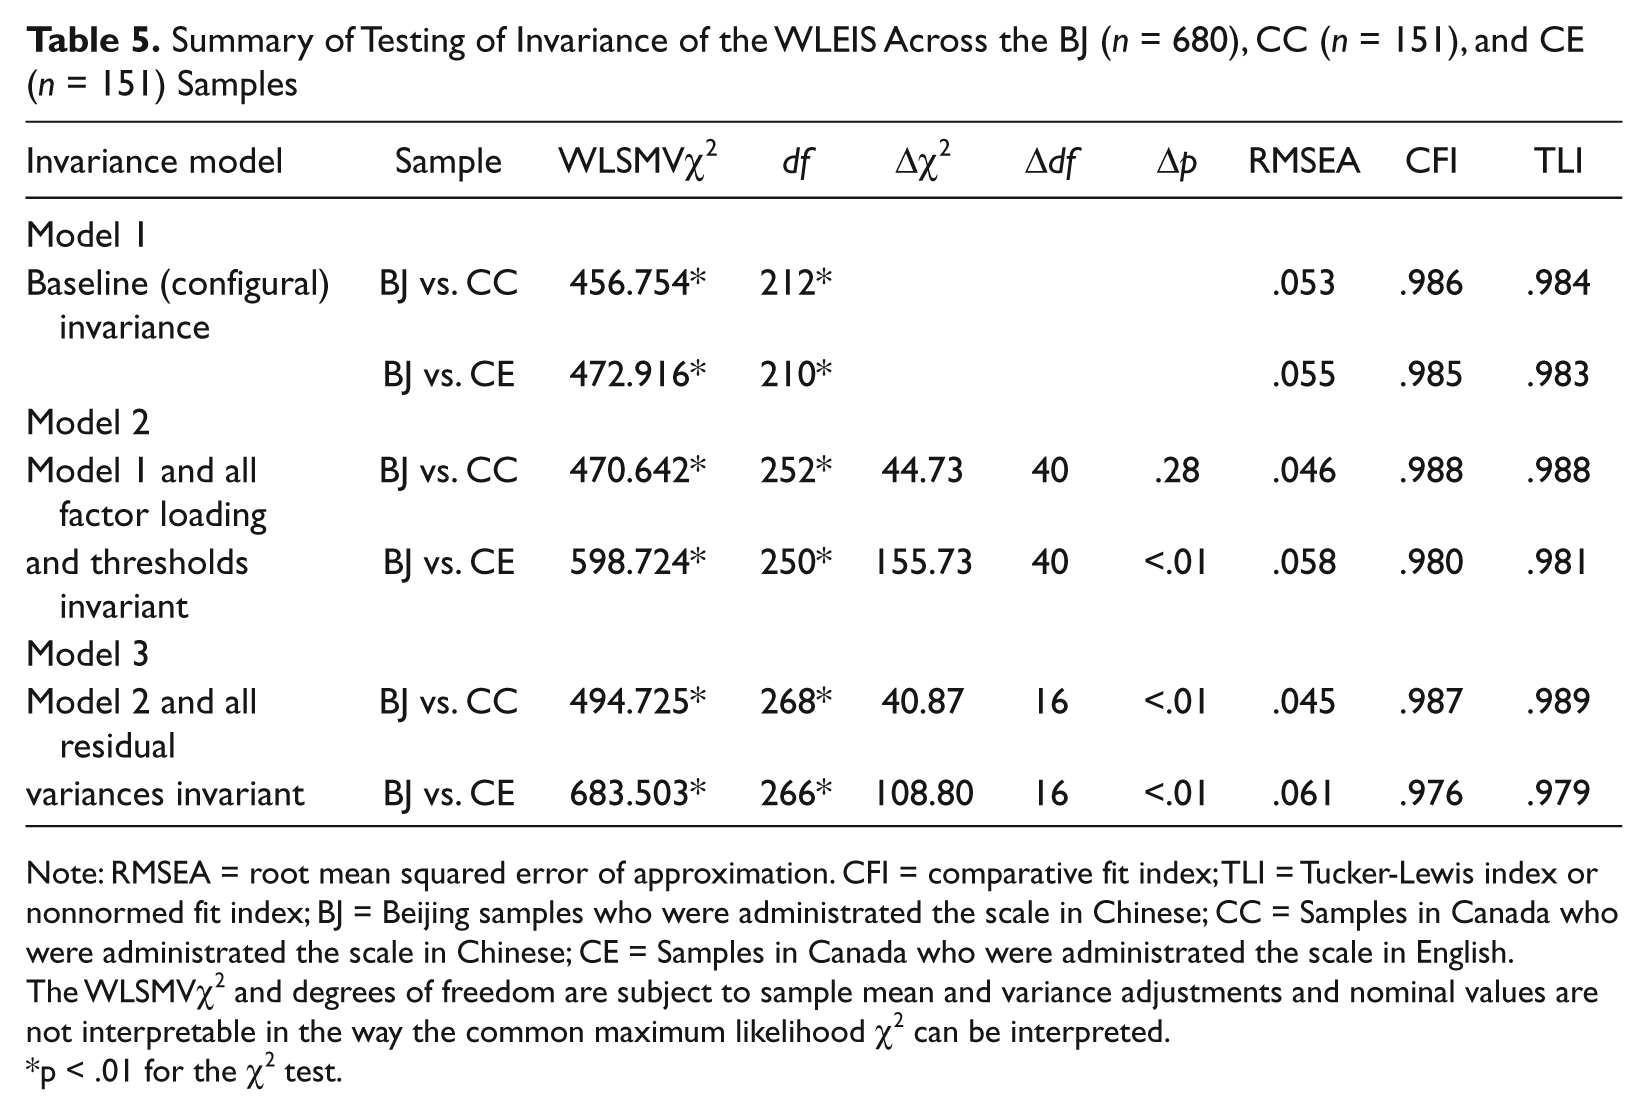
Note: RMSEA = root mean squared error of approximation. CFI = comparative fit index; TLI = Tucker-Lewis index or nonnormed fit index; BJ = Beijing samples who were administrated the scale in Chinese; CC = Samples in Canada who were administrated the scale in Chinese; CE = Samples in Canada who were administrated the scale in English.
The WLSMVχ2 and degrees of freedom are subject to sample mean and variance adjustments and nominal values are not interpretable in the way the common maximum likelihood χ2 can be interpreted.
p < .01 for the χ2 test.
Loadings and thresholds invariant: BJ versus CC groups
When compared with the baseline model estimated simultaneously in both groups (Invariance Model 1 in Table 5), placing invariance restrictions on all factor loadings and thresholds led to no significant loss of fit in the WLSMV χ2 (p = .28) and no appreciable change in the RMSEA, CFI and TLI in the comparison of the BJ versus CC groups in terms of the criteria described by Cheung and Rensvold (2002) to indicate rejection of invariance (Invariance Model 2 in Table 5). As a consequence the hypothesis of invariant loadings and thresholds was retained for the comparison of the BJ versus CC groups.
Loadings and thresholds invariant: BJ versus CE groups
The same comparison for the BJ and CE groups led to significant loss of fit in the WLSMV χ2 (p < .01) although other indices suggest no important change in fit (Invariance Model 2 in Table 3). Examination of modification indices for Invariance Model 2 for the BJ versus CE comparison showed that freeing the loading and thresholds for Item 9 would reduce loss of fit. Freeing these parameters produced a CFI of .983 suggesting that the loss of fit was attributable to inequality in the loading and thresholds and consequent sample differences in the underlying item-response curve for Item 9. Therefore the hypothesis of fully invariant loadings and thresholds for the SEA, OEA, and ROE factors, and partial measurement invariance for loadings and thresholds on the UOE factor was retrained for the BJ versus CE group comparisons. The logic of partial invariance analysis is in line with previous descriptions (Byrne et al., 1989; Millsap & Yun-Tien, 2004).
Loadings, thresholds, and residuals invariant
In the next step, indicator residuals were held to invariance across groups, and results are shown as Invariance Model 3 (Table 5) for the BJ versus CC, and BJ versus CE comparisons, respectively. In both pair-wise comparisons there was a significant change in the WLSMV χ2 but no appreciable change in the fit indices compared with the respective Invariance Model 2 in Table 5. Therefore, in line with widely accepted recommendations (Cheung & Rensvold, 2002; Vandenberg & Lance, 2000) the hypothesis of invariant indicator residuals was retained in both pairs of group comparisons. It should be noted that invariance of residuals is not essential for interpretation of measurement (scalar or loading and threshold) invariance. Invariance of residuals provides evidence regarding similarity of item reliability and factor variances across groups, both of which may vary without compromising scalar measurement invariance (Vandenberg & Lance, 2000).
Examination of factor means also estimated simultaneously in the three groups revealed that, in completely standardized metric, only the mean of OEA differed across groups. With the mean OEA score in the BJ group set to zero, the mean OEA score in the CC groups was slightly more than two standard errors larger than zero and in the CE group, slightly more than four standard errors larger than zero. In completely standardized metric, these differences in the OEA mean corresponds to a latent mean effect of .23 for the CC sample and .48 for the CE sample, respectively, when compared with the BJ sample. These differences represent small to medium effects however, it is important to note that latent mean difference are not attenuated by error in the way observed mean differences are, so latent mean differences for equivalent effects will be larger in absolute terms than the equivalent differences (e.g., Cohen’s d) if reported in terms of observed mean effects (Hancock, 2001).
Discussion
The present results add to the growing cross-cultural EI research literature, specifically by providing empirical evidence supporting partial or full measurement invariance of the WLEIS across three Chinese student groups using either a Chinese or English version of the scale.
Results of the multiple group CFA contrasting the BJ with the CC and CE samples indicated that the WLEIS represented the same four EI factors in each of these groups (configural invariance). Construct equivalence and comparability of the EI constructs over the different groups is supported. Furthermore, full metric invariance was supported in the BJ versus CC comparison, and for three of the four factors in the BJ versus CE comparison. Partial measurement invariance was observed for the OEA factor in the BJ versus CE comparison. Of note, the finding of partial measurement invariance for the OEA factor does not compromise the interpretation of construct validity for this factor. Because the OEA factor is identified with at least three indicators, if factor scores are calculated on the basis of the remaining three items, the estimation of factor scores is independent of specific item scores (Vandenberg & Lance, 2000; Widaman & Reise, 1997). Results provided evidence that the four factor model proposed by Wong and Law (2002) could be operationalized in the WLEIS and equally applied across the three sample groups in either English or Mandarin with two groups having additional exposure to the Canadian context.
Importantly, results of the invariance tests verify the generalizability of WLEIS for Chinese university students following a recent study showing similar findings for Japanese university students (Fukuda et al., 2011). There is also support for using this scale to assess EI with Chinese university students in either Mandarin or English. Furthermore and as discussed above, if measurement invariance cannot be supported, then valid cross-cultural comparisons cannot be made (e.g., Hong, Malik, & Lee, 2003; Horn & McArdle, 1992).
One finding that has not been reported in other studies of the WLEIS was the apparent invariance of Item 9 (I always set goals and try my best to achieve them) in the BJ versus CE comparison. Here, the CE sample scored higher than the BJ and CC groups although no differences were found between the BJ and CC groups. Although only speculation at this point, one possible reason might come from the translation of this particular item resulting in a subtle shift in meaning. It could be suggested this was caused by the difference in understanding of “try my best” in the English version in contrast to the Mandarin translation, that essentially describes how hard a person works to achieve goals. Although every effort was made to ensure comparability of items, it is well known that the description and expression of affect, mood, and feelings varies across cultural groups (Pena, 2007). Finally, this study was limited to Chinese university students. Furthermore studies are required to determine whether the results will generalize to a broader sampling of Chinese participants in relation to age and education. Cross-cultural studies involving more ethnic/language groups are needed to provide more comprehensive data not only for the utility of the WLEIS with Chinese students, but also for other EI measures and with other cultural groups.
In summary, the present study adds support to earlier findings reported by Wong and Law (2002) in their initial study of the WLEIS with Hong Kong participants as well as to the more recent study by Fukuda et al (2011). Findings from the present study provided preliminary evidence supporting the utility of the Chinese and English versions of the WLEIS with Chinese university students, and does add further evidence of the generalizability of EI measures presented in different languages. However furthermore studies are needed to further examine the affect of acculturation and EI.
Footnotes
Declaration of Conflicting Interests
The author(s) declared no potential conflicts of interest with respect to the research, authorship, and/or publication of this article.
Funding
The author(s) received no financial support for the research, authorship, and/or publication of this article.