
Abstract
A 25 item short form of the Behavioral Assessment System for Children (BASC) Teacher Rating Scale–Preschool (TRS-P) was developed by the BASC authors to serve as an emotional/behavioral indicator for an academic intervention study targeting preschool-aged students. The BASC screener is thought to fulfill a need for an abbreviated behavior rating scale for preschool-aged students that teacher’s can complete in a short amount of time. The purpose of the current study is to assess the psychometric properties of the BASC screener. Internal reliability analysis demonstrated remarkably high internal consistency for the screener. Long-term test-retest reliability was found to be acceptable. Furthermore, the construct validity of the screener was investigated using both exploratory and confirmatory factor analysis methods. Results showed that the screener measures three distinct constructs: Social Skills, Attention/Cognition, and Affect. Evidence of convergent/divergent and discriminant validity is provided.
Keywords
There has been a growing awareness of the emotional and behavioral health of school-aged children. Educational professionals and parents are increasingly mindful of the importance of students’ emotional and behavioral health for academic success and general quality of life before, during, and after formal education. More specifically, aspects of infant affect, such as temperament and emotional control, have been found to predict cognitive/language skills (Robinson & Acevedo, 2001) and more general school achievement (Churchill & Stoneman, 1997). Furthermore, early childhood social competence has been found to predict later academic and adjustment skills (Rubin, Bukowski, & Parker, 1997).
Properly delivered and timely early intervention for students “at risk” for emotional/behavioral problems is considered to be preventive in nature and therefore more effective than corrective treatment later in life. For this reason, early intervention of “at risk” students is now considered best practices in early childhood education.
Of course, early intervention depends on timely identification of “at risk” students at a young age. A number of psychometric instruments are currently available to educational professionals for this purpose. Among the most popular are the Behavioral Assessment System for Children (BASC) Teacher Rating Scale–Preschool (TRS-P; Reynolds & Kamphus, 2004), the Caregiver–Teacher Report Form (Achenbach & Rescorla, 2000), the Preschool Behavioral and Emotional Rating Scale (PreBERS; Epstein & Synhorst, 2009), and the Preschool and Kindergarten Behavior Scales (PKBS-2; Merrell, 2002), among others.
One shortcoming of these instruments is the length of teacher time needed to complete the assessment. The BASC TRS-P is a 109 item rating scale, the Caregiver–Teacher Report Form has 99 items, the PreBERS is a 42-item assessment, and the PKBS-2 has 76 items. In all cases, substantial teacher time is required to use the instrument properly.
The BASC authors are aware of these shortcomings and currently in the process of developing several short forms of the BASC instruments. DiStefano and Morgan (2010) recently reported an evaluation of the psychometric properties of the Behavioral and Emotional Screening System Teacher Rating Scale for Children and Adolescents (BESS TRS-CA). The BESS TRS-CA is a 27 item short form behavior checklist that was developed from the TRS-A (Adolescents) and TRS-C (Children) BASC instruments. The authors used the Rasch Rating Scale Model with classical test theory methods to evaluate the psychometric properties of the BESS TRS-CA. Results showed that the scale demonstrated acceptable and even high levels of internal consistency (α = .943), however, only borderline evidence of unidimensionality. Overall, the authors provide evidence that the BESS TRS-CS is a reliable and valid abbreviated behavior checklist making schoolwide emotional/behavioral assessment of older students a practical reality.
In a recent large-scale academic intervention study for preschool-aged children (the PAVEd for Success study, henceforth, pre-K PAVE (Schwanenflugel et al., 2010), a 25 item abbreviated version of the BASC TRS-P, known simply as the BASC screener, was used. The intervention plan was designed to primarily address emergent literacy skills in children attending public schools with a history of low early academic achievement. However, the BASC screener was used to identify any adverse emotional/behavioral issues and/or changes that the children might have exhibited in reaction to a possibly developmentally challenging academic intervention.
This substantially shorter version of the BASC TRS-P made the emotional/behavioral tracking of the children in the pre-K PAVE study a practical reality. If the screener were established as a valid and reliable instrument, it would potentially fill a need for an efficient and timely behavior checklist to accurately identify young students “at risk” for emotional/behavioral problems in hopes that these students would receive subsequent full-form assessment and possible early preventive intervention.
The purpose of this article is to establish certain psychometric properties of the BASC screener for native English speakers including internal and long-term test-retest reliability and construct, convergent/divergent, and discriminant validity. This study augments the literature begun by DiStefano and Morgan (2010) and others in the following ways. First, the BASC screener was specifically designed for and is assessed here using younger preschool students. Next, DiStefano and Morgan used IRT-based methods in their previous assessment of a BASC short form. To extend the literature base in this area, we employed both exploratory and confirmatory factor analysis (CFA) methods as well as classical regression models to investigate test validity. Finally, we provide evidence of convergent/divergent, and discriminant validity for the screener.
Method
Participants
As part of the pre-K PAVE study, children were evaluated by their teacher using the BASC screener at three time points over the course of their preschool year. The original data matrix consisted of full and partial screener ratings for N = 472 students at the first measurement occasion. Seventeen cases were identified with one or more missing values for the 25 screener items. Results from a missing data analysis demonstrated that summary statistics (means, standard deviations, etc.) for the 25 items were comparable to full sample statistics with no systematic trends/differences in the demographic variables (see also Table 1). Consequently, we judged that minimal sampling bias would be introduced by removing these cases. Therefore, 17 cases were removed with N = 455 remaining.
Sample Descriptive Summary Information.

The BASC TRS-P was originally intended for use with a native English-speaking population and was therefore developed and normed using a native English-speaking sample. Because our interest was to provide initial reliability and validity evidence for the screener, only the native English-speaking students from the pre-K PAVE sample were selected for inclusion. Consequently, the analyses described herein were based upon a sample of N = 341 native English-speaking students. Frequencies and percentages describing these three data sets are presented in Table 1. Table 1 demonstrates that the characteristics of the effective sample (N = 341) closely approximate those of the full sample (N = 472) on all dimensions except language use.
N = 37 teachers evaluated these 341 students. All children attended a lottery-funded prekindergarten program open to all families, regardless of income or risk status that was housed in one of 18 public elementary schools. The number of students per school varied between 8 and 53 (M = 18.94, SD = 10.08). The number of students evaluated per teacher varied between 3 and 18 (M = 9.23, SD = 6.64).
Inspection of Table 1 shows that the effective sample was composed of students ranging from 4.08 to 5.15 years in age at the first assessment carried out within the first month of school. The sample demonstrated a balanced gender distribution and mainly consisted of African American and Caucasian students. The majority (≈80%) was general education students with the remaining students either being considered or recommended for Student Support Team (SST) referral, or already receiving some special education services. Approximately 40% of the students were eligible for free or reduced lunch, roughly 10% participated in the Head Start program, and 30% attended preschool previously (see Table 1). 1
Instrumentation
The full BASC-P
The BASC-P is a fully integrated assessment system consisting of many components. One component is the Teacher Rating Scale–Preschool (TRS-P). The TRS-P is a 109 item behavior checklist with 10 distinct scales where a teacher rates a student in regards to the frequency of certain observable behaviors exhibited in the school setting. Cronbach’s α coefficients measuring internal consistency of the TRS-P for general norm groups varied between .78 and .90 with a median value of .82 among the 10 scales (Reynolds & Kamphaus, 1998). Test-retest reliability coefficients obtained a median value of .89 for the 10 scales. Inter-rater reliability coefficients ranged from .29 to .69 with a median value of .63 for the 10 scales.
BASC screener
The BASC screener was constructed from 25 out of 109 items on the full BASC TRS-P. The BASC screener items were chosen for inclusion by the BASC developers who performed a principal components analysis of the 109-item TRS-P (Kamphaus et al., 2007). Prior to the analysis, developers decided for the sake of brevity that 25 items or fewer should be identified for inclusion in the screener. The BASC screener was compiled from the 25 items that obtained the highest loadings on the first principal component. For these reasons, the developers entertained the notion that the screener was a unidimensional instrument measuring only one construct, conceptualized as “school success.”
As with the full BASC TRS-P, the screener employs a 4-point Likert-type scale with possible responses being “1” for Never, “2” for Sometimes, “3” for Often, and “4” for Almost Always in regards to a given students frequency of engaging in certain behaviors. High values for the screener total score indicate the presence emotional/behavioral problems.
The Student Teacher Relationship Scale (STRS)
The Student Teacher Relationship Scale (Pianta, 2001) is a 28-item instrument that uses a 5-point Likert-type scale to assess closeness, dependency, and conflict between a student and teacher. The STRS teacher total and conflict scores were used in the current study as indicators of emotional/behavior health of students independent of the BASC screener for convergent/divergent validity evidence.
Procedures
All analyses were performed on all three measurement occasions of the N = 341 effective sample unless otherwise specified. In most cases, only the time 1 results are reported here with the exception of the CFA. The SAS 9.2, Mplus 3.11, and R 2.12.0 software packages were used.
Internal Reliability
Internal consistency of the screener total score was assessed using Cronbach’s α. In addition, a number of stratified internal consistency analyses were performed. More specifically, Epstein, Synhorts, and Cress (2009) found that internal consistency for the PreBERS varied by gender. Furthermore, Achenbach and Edelbrock (1981) reported boys being rated more behaviorally problematic than girls, on average. Epstein et al. (2009) also stratified their analysis by age but found evidence of no differences in the internal consistency of the PreBERS by age. Furthermore, Achenbach and Rescorla (2000) did not find age differences for emotional/behavioral assessments. As a result, we performed a number of internal consistency analyses by the following stratification factors: gender, education type (either general education or special education), 2 by both gender and education type simultaneously, and finally for each construct separately.
Test-Retest Reliability
We hypothesized that the behavioral constructs measured by the screener are relatively stable over time. Test-retest reliability for stable constructs is often assessed within 2 to 8 week intervals of assessments (Cress, Epstein, & Synhorst, 2010). Unfortunately, data for the screener were only available at 12-week intervals. Therefore, we computed long-term test-retest reliability coefficients for the screener total score.
Construct Validity
Construct validity was investigated using both exploratory factor analysis (EFA) and CFA methods. First, an EFA using principal axis factoring was performed. A synthesis of the scree plot, proportion of variance explained, and interpretability of the factors methods and parsimony were used to determine the dimensionality of the screener. An Oblimin rotation was performed that allowed intercorrelations among the extracted factors. A criterion of +/−.40 was used to identify substantial factor loadings. 3 To provide a sense of the screener factor structure, factors were interpreted by inspection of the pattern matrix while intentionally ignoring from which scale each item originated from on the full BASC TRS-P. Therefore, labeling of the factors was performed independently of knowledge of the scale structure of the TRS-P.
Second, a CFA was performed to evaluate three candidate models for the factor structure of the screener. To minimize overfitting the data and to provide some cross-validation evidence, we intentionally fit the EFA model to Time 1 data and the CFA models to Time 2 data. The Mplus software version 3.11 was used to fit the models. Each candidate model is described below.
CFA Model 1: The 3-Factor BASC Solution. This model was informed by the EFA where each BASC screener item is linked to its respective factor of primary loading. Finally, the 3 factors were specified to load on a single Overall Behavior construct.
CFA Model 2: The 1-Factor BASC Model. As mentioned earlier, the BASC screener was originally developed by choosing the 25 items from the full 109 item BASC TRS-P with the highest loadings on the first principal component thought to represent “school success” during a separate Principal Component Analysis. Therefore, this model was included to evaluate the single construct hypothesis.
CFA Model 3: The Full BASC Scale. The 25 items on the screener originated from 5 distinct scales on the full BASC TRS-P. The final candidate CFA model was one where each of the 25 BASC screener items were specified to load on their respective scale of origin from the full 109 item TRS-P. Finally, like model 1, the 5 factors representing the TRS-P scales were specified to load on a single Overall Behavior construct.
The model χ2, root mean square error of approximation (RMSEA), and the Tucker Lewis Index (TLI) and Comparative Fit Index (CFI) were used as indicators of model fit. For the model χ2 and log likelihood values, acceptable model fit are relative to the uniqueness of each data modeling situation. For the RMSEA, the Browne & Cudek (1993) guidelines were adopted: RMSEA ≈ .110 indicates a reasonable fit with a value ≤ .05 indicating exceptionally good fitness to the data. Finally, the Hu & Bentler (1999) guidelines for the TLI and CFI values of ≥ .90 indicating good fitness were adopted.
Convergent/Divergent Validity
Convergent validity was investigated by correlating the Time 1 screener total score with the teacher conflict score of the STRS (Pianta, 2001). We hypothesized that a strong positive association would exist between these measures. Similarly, divergent validity was assessed by correlating the Time 1 screener total score with the teacher total score of the STRS. Because high values of the STRS teacher total score indicate a close, healthy, prosocial relationship between student and teacher, we hypothesized that a strong negative relationship would exist between the screener total score and the STRS teacher total score. Linear relationships among these variables were confirmed through scatter plot analysis prior to interpreting the coefficients.
Discriminant Validity
One of the main purposes for the BASC screener is identification of “at risk” students for emotional/behavioral issues. Therefore, to establish the discriminant validity of the screener, we hypothesized that students receiving special education in the PAVEd data would obtain significantly higher screener total scores than those in general education.
To test this hypothesis, a regression model 4 was fit using the Time 1 5 BASC screener total score as the response variable and student age, gender, education type, and a free/reduced lunch indicator as explanatory variables. Education type was dichotomously coded, differentiating students in general education from students currently receiving any special education services, students in the process of a SST referral, and students being considered for an SST referral. A dichotomous coding was also used for free/reduced lunch. Initially, Head Start and preschool status as well as mother’s and father’s education levels were also considered for inclusion in the model, however, excessive missingness for these variables ultimately led to the decision to omit them from model selection.
Results
Internal Reliability
Internal consistency analysis results are presented in Table 2. Results demonstrated remarkable internal consistency of the screener total score for the entire sample at each of the three measurement occasions with total sample coefficients ranging from .961 to .963. Furthermore, remarkable consistency was also found for each of the stratified analyses with coefficients ranging from .936 to .970. Finally, the screener total score demonstrated extraordinary consistency and stability over time for all indices.
BASC Screener Internal Consistency Coefficients.

An “if item deleted” analysis was also performed. 6 The Cronbach’s α if item deleted values ranged between .960 and .962 indicating uncommon homogeneity of these items. Correlations with the total score as if each item were deleted varied from .551 to .827. Two items obtained notably lower correlations with the total score: Number 20 Is easily upset (r = .551) and item number 23, Gives up easily when learning something new (r = .592). Overall, however, these results demonstrate high internal consistency of the screener.
Test-Retest Reliability
The screener demonstrated acceptable levels of long-term test-retest reliability. Total sample coefficients between Time 1 and 2 and 2 and 3 were .807 and .803, respectively. Coefficients from a stratified analysis by gender ranged between .763 and .813. Coefficients were slightly lower for female students at both test-retest assessment opportunities.
Construct Validity
Exploratory factor analysis (EFA)
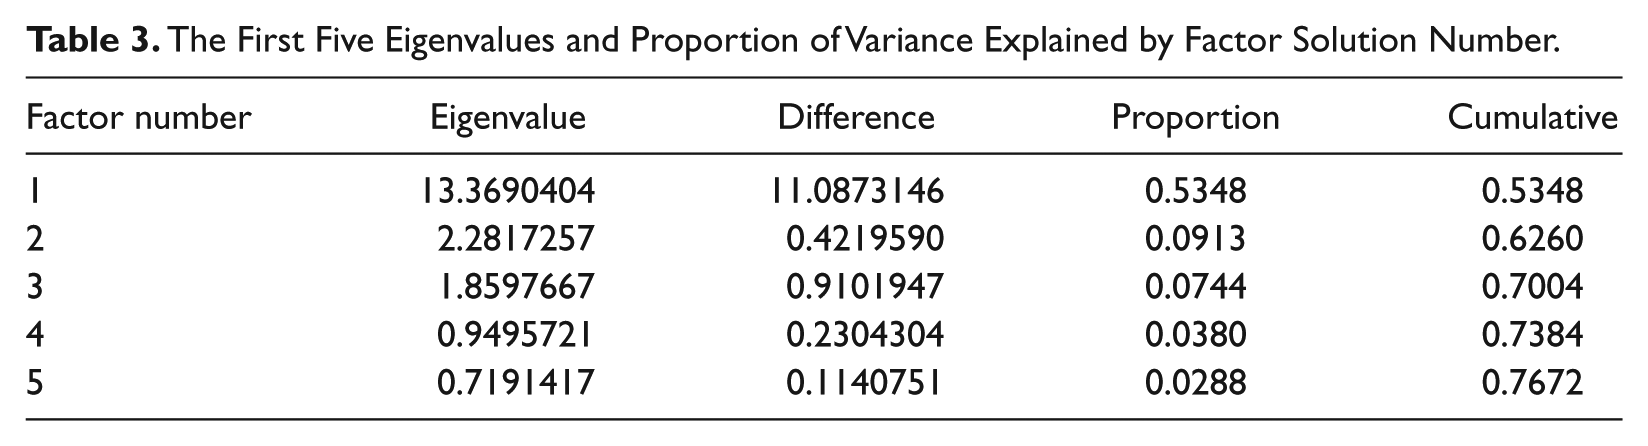
The investigation into the construct validity of the BASC screener began with an EFA of the Time 1 screener data to study the instrument’s dimensionality. Principal axis factoring with an Oblimin rotation was performed. Communalities ranged from .429 to .831 with a mean of .662. The synthesis of the proportion of variance explained (see Table 3), scree plot (see Figure 1), interpretability of the factors and parsimony demonstrated that a 3-factor solution was superior. The 3-factor solution explained 70.04% of the original variation among the screener items. The RMSR for the factor solution was .0341, indicating the rotated solution explains most of the association among the screener items. Finally, results demonstrated that the 3 factors were interrelated with factor intercorrelations ranging from .385 to .521.
The First Five Eigenvalues and Proportion of Variance Explained by Factor Solution Number.

Scree plot for EFA on Time 1 data.
A criterion of +/−.40 was used to identify substantial factor loadings. 7 The solution obtained results closely resembling simple structure: clear, distinct, and high factor loadings on one and only one factor with all other loadings for that item near zero. There were 2 exceptions to this rule: (a) item number 3 (Complains when asked to do things differently) loaded moderately high on both the social skills and the affect factors, and (b) item number 23 (Gives up easily when learning something new) loaded moderately high on both the attention/cognition and the affect factors. Otherwise, the factor pattern matrix demonstrates substantial evidence for the viability of the 3-factor solution.
The first factor in the solution was labeled “Social Skills.” Items that loaded highly on this factor included Bullies Others, Argues with Friends, Disrupts the Play of Others, Hits Other Children, Teases Others, and so forth. The second factor was labeled “Attention /Cognition.” Items that loaded heavily on this factor included Has a Short Attention Span, Has Trouble Concentrating, Listen Attentively, Is Easily Distracted, and so forth. The third factor was labeled “Affect.” Items that loaded heavily on this factor included Changes Mood Quickly, Is Easily Upset, Is Easily Frustrated, and so forth.
Confirmatory factor analysis (CFA)
The investigation into the construct validity of the BASC screener continued with a CFA where three competing models for the factor structure of the instrument were compared using Time 2 data.
Model fit statistics for the three separate CFA models are presented in Table 4. Inspection of the model χ2, (RMSEA, and the Tucker Lewis Index (TLI) and Comparative Fit Index (CFI) all indicate that Model 1 obtained superior fit to the data. 8 This was found to be true at all three measurement occasions Furthermore, in all instances, Model 3 obtained a comparable, yet slightly inferior, fit. However, Model 1 was deemed the superior model based on both the superior fit statistics and on the basis of parsimony.
CFA Model Fit Statistics.

Note. CFA = confirmatory factor analysis; RMSEA = root mean square error of approximation; TLI = Tucker Lewis index; CFI = comparative fit index.
The RMSEA for Model 1 was .117, indicating a reasonable fit (see Table 4). The TLI and CFI fit statistics were lower than desired (.798 and .815, respectively), however, still indicating reasonable fit. Overall, these results provide evidence of a 3-factor structure of the BASC screener.
Convergent/Divergent Validity
The teacher STRS scores
To investigate the convergent validity of the BASC screener, the screener total score was correlated with the STRS teacher conflict score (both collected at Time 1). Results demonstrated a strong positive linear relationship between the screener and the STRS, r = .743, p < .0001. Furthermore, the screener was found to share 55.15% of the variation with the STRS, R2 = .5515. Similarly, yet evidence of divergent validity, a strong negative linear association was found between the screener total score and the STRS teacher total score, r = −.715, p < .0001, R2 = .5107.
Discriminant Validity
The regression model was found to explain a statistically significant amount of variation in screener total scores at Time 1, F(4,288) = 10.04, p < .0001. 9 Results demonstrated that student age, gender, and education type explained statistically significant amounts of variation in the screener total score at the α = .05 level. The free/reduced lunch indicator was surprisingly not found to be significant at α = .05, however, was retained in the model for statistical control purposes. Importantly, the screener total scores were found to be significantly lower by almost 6 points for general education students compared to their special education/SST peers even after controlling for student age, gender, and free/reduced lunch status, t(115) = 2.91, p = .0044. The model-adjusted mean screener total score for general education students was 43.03 compared to 48.92 for students receiving special education/SST.
Discussion
The BASC screener is a 25-item abbreviated form of the full 109 item BASC TRS-P. We established certain psychometric properties concerning reliability and validity of the instrument. Specifically, Cronbach’s α analysis demonstrated high internal consistency of the screener total score for the total sample as well as stratified samples and also across 3 separate measurement occasions. In fact, the screener’s high reliability and stability over long intervals of time was particularly remarkable. Furthermore, long-term test-retest reliability was acceptable over 12 week intervals. Next, we presented substantial evidence indicating that the screener measures three distinct constructs: Social Skills, Attention/Cognition, and Affect. This factor structure is logical, meaningful, and sensible in light of the screener’s development and parent instrument. Fourth, we presented substantial evidence that establishes convergent and divergent validity of the screener. Finally, we explored the discriminant validity of the screener where we found statistically significant results demonstrating that general education students obtain substantially lower screener scores than their special education peers (in the order of ½ of a standard deviation lower) even after controlling for age, gender, free/reduced lunch status, and inter-rater variability. In sum, these results demonstrate that the screener is a viable tool for emotional/behavioral assessment of preschool-aged children.
Limitations
We acknowledge several study limitations. First, the PAVEd data were a convenience rather than random sample. Furthermore, the sample consisted almost exclusively of African American and Caucasian students. These issues limit the generalizability of our findings. Next, we chose to assess the psychometric properties of the screener for only native English speaking students. These results should not be applied to English language learners without further research. Moreover, our convergent/divergent validity analyses are limited by method and source overlap. Next, EFA and CFA analyses ideally would be performed on two independent samples for cross-validation purposes. We attempted to approximate this ideal by reporting the EFA results on Time 1 data and CFA results on Time 2 data. Finally, we used a special education subsample to assess the discriminant validity of the screener. However, detailed information concerning each student’s special education diagnosis was unavailable. Therefore, our special education group was not solely composed of students with emotional/behavioral disorders, but rather was a heterogeneous special education sample. Thus, we expect that our estimates of discriminant validity are conservative and similar analyses comparing general education students specifically with students with emotional/behavioral disorder will be even more significant.
Further research
We offer several suggestions for further research beyond those already presented. First, short-term test-retest reliability of the screener should be assessed with test-retest intervals ranging between 2 to 4 weeks. Second, psychometric properties of the screener need to be explored separately for different ethnicities and language speakers. Next, inter-rater reliability should be assessed among not only different teachers, but possibly a mixture of teachers, paraprofessionals, and parents and, depending on results, a training protocol to insure proper instrument use may be appropriate. Finally, predictive validity and systematic discriminant validity studies need to be performed.
Herein, we have established the BASC screener as a potentially useful tool for teachers of preschool-aged students that meets test development standards of professional groups such as the American Psychological Association (APA), the National Council on Measurement in Education (NCME), and others. We foresee a future where the screener could potentially fill multiple roles including (a) identifying emotional/behavioral problems, (b) informing intervention plans, (c) monitoring progress, and (d) supplementing information used to develop Individual Education Plan (IEP) goals and other behavioral benchmarks. Ultimately, we hope that the screener will fill an important need and play an integral role in the identification and compassionate and proper preventive treatment of young children at risk for emotional/behavioral problems.
Footnotes
Declaration of Conflicting Interests
The authors declared no potential conflicts of interest with respect to the research, authorship, and/or publication of this article.
Funding
The authors received no financial support for the research, authorship, and/or publication of this article.