
Abstract
The present study is an initial investigation of the concurrent validity of a new assessment, the Classroom Strategies Scale (CSS version 2.0) for Elementary School—Observer Form. The CSS assesses teachers’ use of instructional and behavioral management strategies. In the present study, the CSS is compared to the Classroom Assessment Scoring System (CLASS), a widely researched measure of global classroom quality. In a sample of 125 general education K-5 grade teachers, correlations were computed to assess the relationship between the CSS scales and conceptually similar and dissimilar domains and dimensions on the CLASS. In comparison to the CLASS, the CSS classroom observations and strategy rating scale scores demonstrated correspondence with conceptually similar scales, providing initial evidence for the concurrent and discriminant validity of the CSS. Results highlight the unique features of the CSS for assessing teacher classroom practices.
Teacher accountability has received increased attention by school systems and state/federal government (Bales, 2006). Changes in the American education system, including the passage of the No Child Left Behind legislation (NCLB, 2001), have emphasized the importance of general education teachers and their practices with respect to student achievement. At the same time, Response to Intervention (RtI; Fletcher, Lyon, Fuchs, & Barnes, 2007) and Positive Behavioral Intervention and Support (PBIS; www.pbis.org; Sugai & Horner, 2002) frameworks rely heavily on the general education teacher as the implementer of best practice interventions for academic instruction and/or behavior management.
With an increased emphasis on teacher accountability in addition to student achievement outcomes, it follows that schools need to establish mechanisms to evaluate teacher performance. Legislation has emphasized student performance on state-wide assessments as one metric of determining effective teacher performance (NCLB, 2001). However, the use of state-wide assessment scores as a method for assessing teacher performance ignores other contributors to educational success, and the scores in and of themselves do not provide information on how to improve teachers’ performance. For example, student academic achievement has numerous contributors (i.e., child intellectual level, family socioeconomic status, parent education, prior educational experience), with teacher contributions representing a small portion of the variance (Connor, Son, Hindman, & Morrison, 2005). Importantly, many of these child/family variables that may contribute to state-wide test scores are outside of the teachers’ control. Because of this, attention has turned to developing and validating assessments of teacher performance and professional practice that focus on teacher behaviors within the control of the general educator. These include strategies that are consistent with best practice in instruction and classroom behavior management. Presumably, focusing on improvements in teacher practice will contribute to the promotion of downstream student achievement gains.
To meet this need to evaluate and monitor teacher classroom practices, multiple approaches are available. A traditional approach includes a principal’s observation of classrooms followed by a review with the teacher of narrative notes. This approach is limited, however, as it is susceptible to inconsistency and bias. Another approach involves use of local rubrics, and whereas this may increase the consistency and structure of the observation, it may have limited external validity. Beyond these approaches there appear to be few tools to monitor teachers’ use of evidence-based classroom instructional and behavioral management practices. For example, in the National Center for Education Evaluation’s comprehensive review of available school assessments, there does not appear to be a measure that assesses both teachers’ instructional and behavior management practices in instructional contexts (Malone et al., 2010). Also, there is no teacher measure designed for repeated use (progress monitoring purposes). Collectively, these approaches have conceptual and psychometric limitations that leave a void for school personnel to effectively assess, monitor, and improve teachers’ Tier 1 evidence-based instructional and behavioral management practices (Reddy & Fabiano, 2012; Reddy, Fabiano, Barbarasch, & Dudek, 2012).
One well-developed classroom observational system that attempts to address these limitations is the Classroom Assessment Scoring System (CLASS; Pianta, La Paro, & Hamre, 2008). The CLASS is a multidimensional classroom observation system that assesses global classroom quality in preschool through third-grade classrooms. As shown in Table 2, the CLASS consists of 10 nested single-item dimensions within three domains (i.e., emotional support, classroom organization, and instructional support). The CLASS has been used as a research tool in several federally funded projects and has good reliability and validity (Pianta et al., 2008).
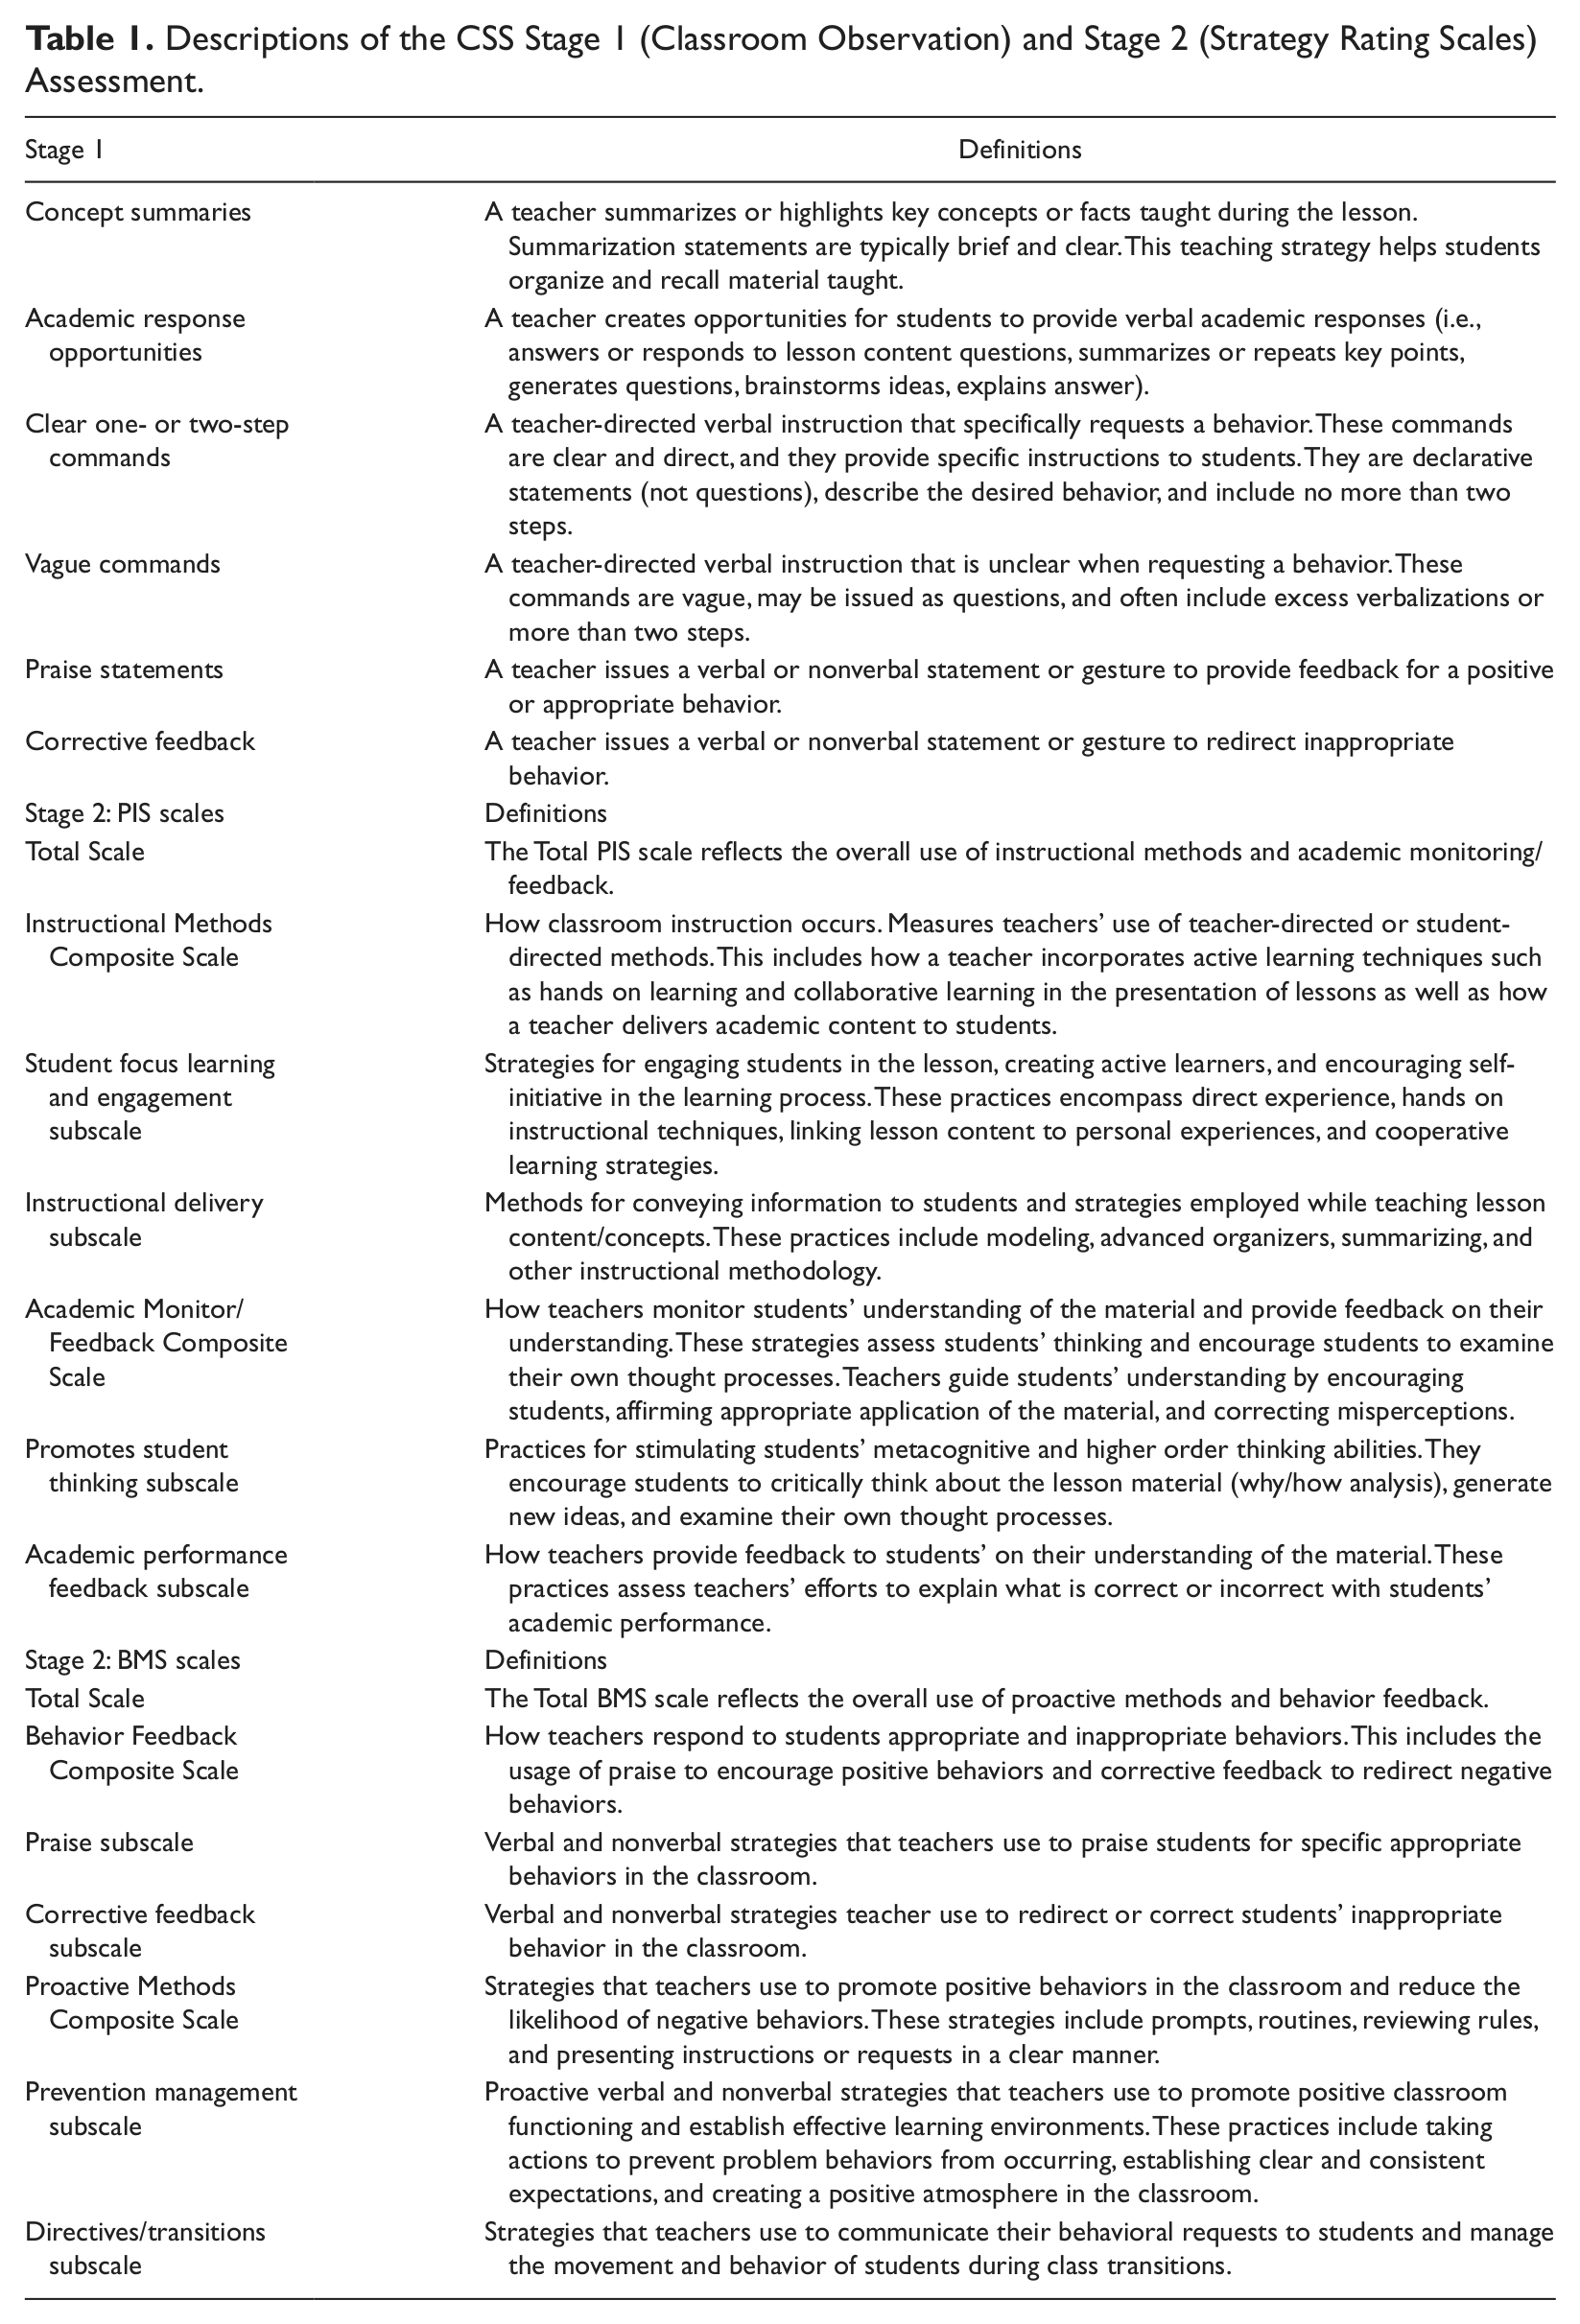
Descriptions of the CSS Stage 1 (Classroom Observation) and Stage 2 (Strategy Rating Scales) Assessment.
Descriptions of the CLASS Domains and Dimensions.
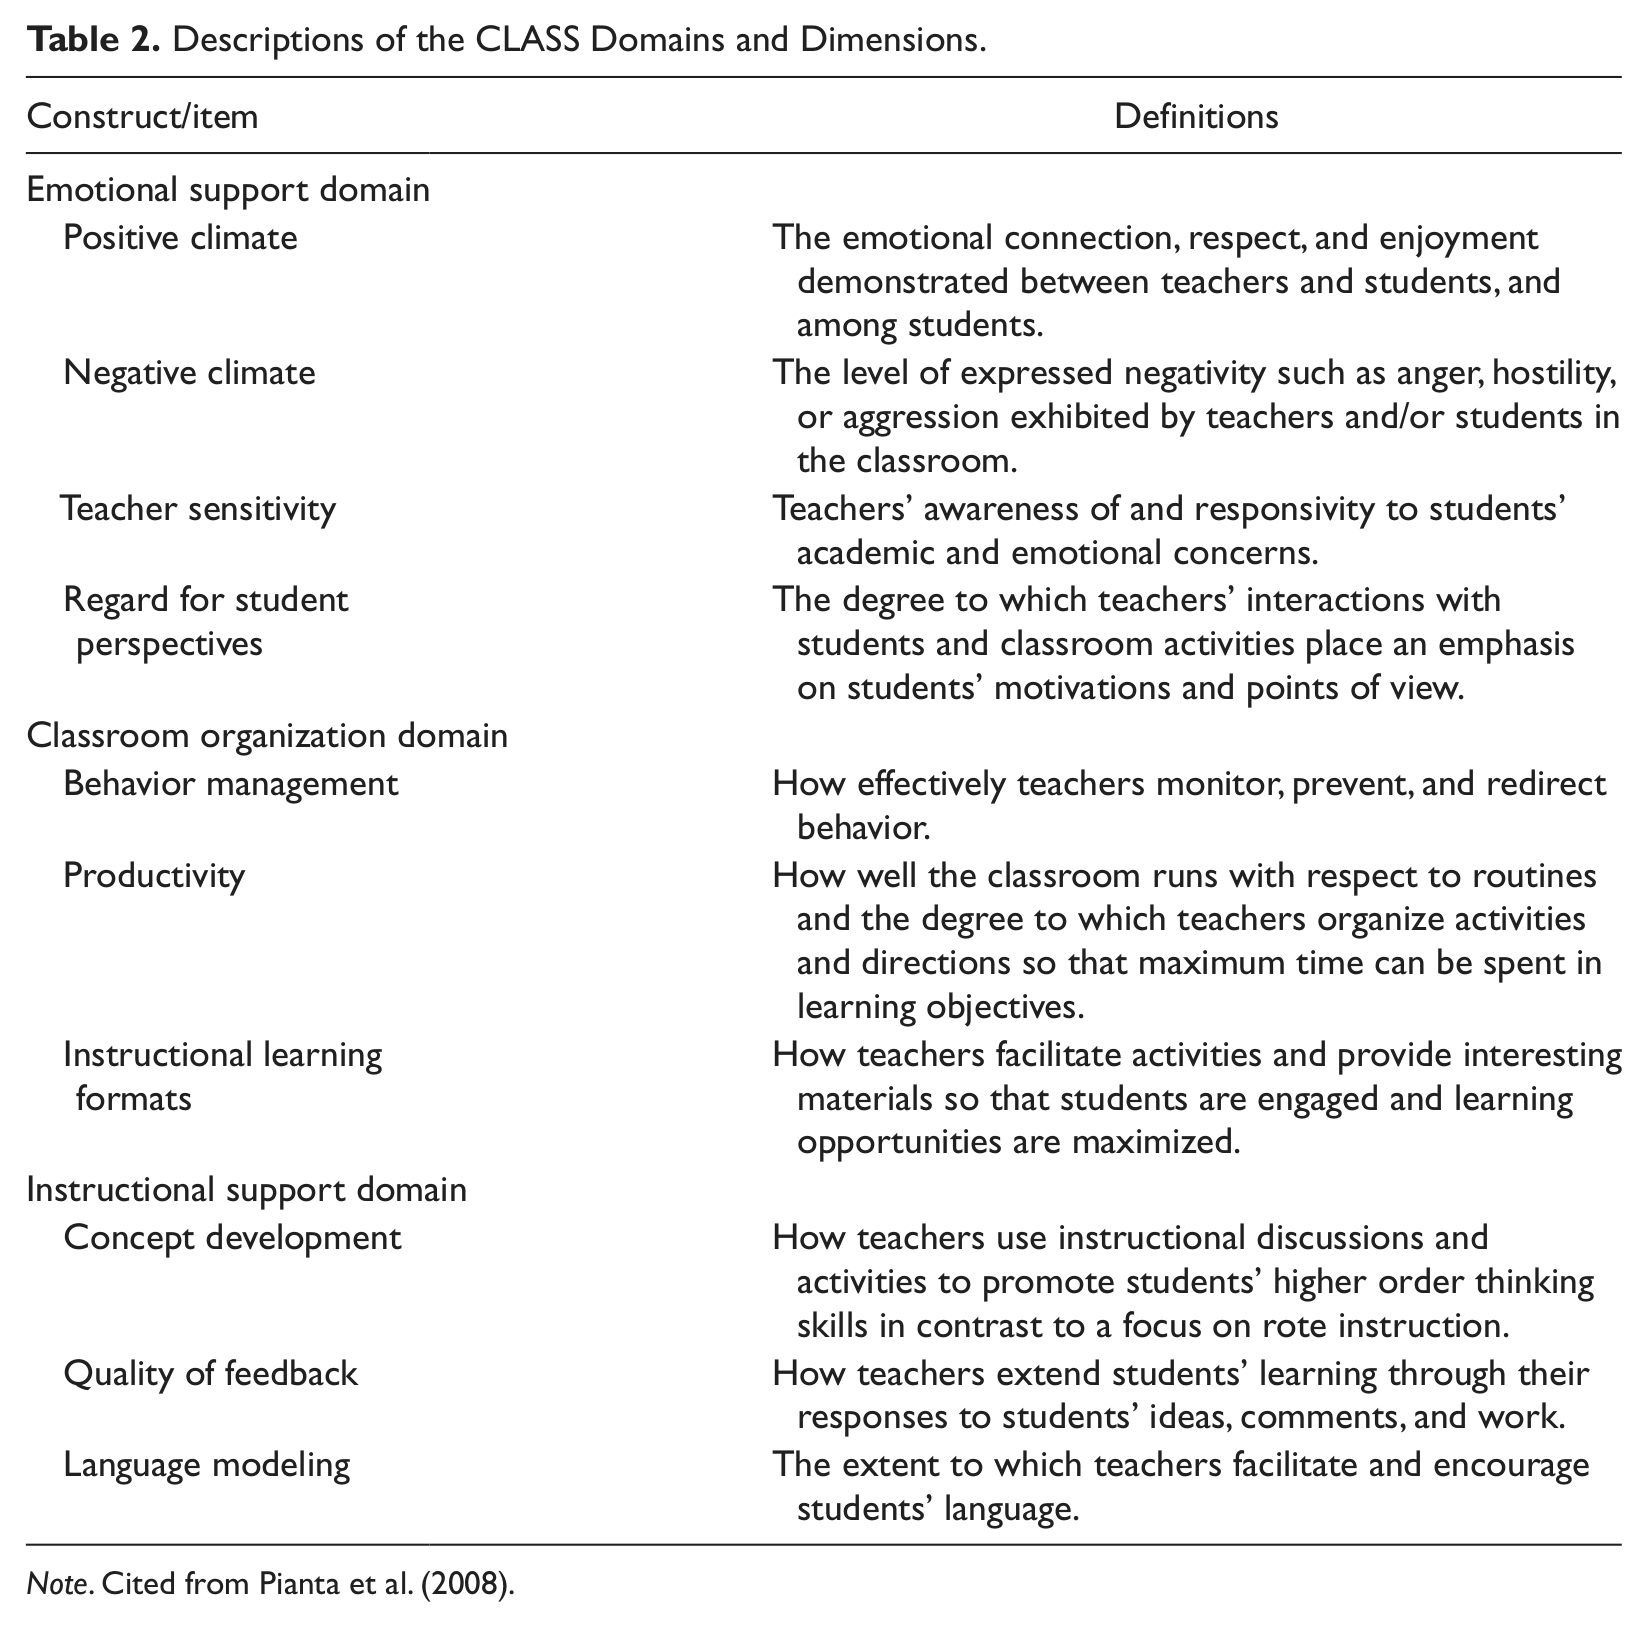
Note. Cited from Pianta et al. (2008).
A recently developed observational measure, the Classroom Strategies Scale (CSS) for Elementary School collects data on specific teacher behaviors related to evidence-based instructional and behavioral management strategies. The CSS is guided by constructivist and differentiated learning theories, and opportunity to respond, positive behavioral interventions and supports (PBIS), and behavioral management literature (e.g., Coutinho, Wiemer-Hastings, Skowronski, & Britt, 2005; Gable, Hester, Rock, & Hughes, 2009; Marzano, 1998; Matthews, 2000; Sugai & Horner, 2002; Sutherland, Adler, & Gunter, 2003; Tomlinson & Edison, 2003).
Unlike the CLASS, the CSS does not measure teacher–student interactions, but instead measures teacher behavior. The CLASS assesses global classroom quality across 10 single-item dimension scores and the CSS assesses discrete data via frequency counts of six behaviors and a 57-item rating scale composed of two total, four composite, and eight subscale scores. The CSS also yields discrepancy scores (i.e., frequency − ideal frequency ratings), which provide feedback for changes in teachers’ practices. Thus, the CSS and CLASS are conceptually and methodologically different tools that offer distinct and complimentary information for measuring teachers’ professional functioning.
An important step to test validation is to examine the concurrent validity of new assessment tools to existing criterion measures. However, at this time there is no gold standard measure of Tier 1 teacher instructional and behavioral management practices. Given this void in school-based assessments, the CSS was compared to the CLASS as it is a widely researched observational assessment of classroom quality.
This investigation serves as the first concurrent validity study of the CSS Observer Form by comparing the CSS to the CLASS. It was hypothesized that the CSS Instructional Methods and Academic Monitoring and Feedback discrepancy scores would be negatively correlated with the CLASS classroom organization and instructional support domains and associated dimension scores. Similarly, it is hypothesized that the CSS discrepancy scores of behavioral management would be negatively correlated with the CLASS classroom organization domain and associated dimension scores.
Method
Sample
General education K-5 teachers (N = 125) from 45 elementary schools in New Jersey and New York were assessed by 40 observers on both the CSS and CLASS. The teacher sample included 117 females predominately Caucasian (96%). The average age was 39 (SD = 11.68). Teacher grade-level assignment included 20 in kindergarten, 23 in first grade, 25 in second grade, 20 in third grade, 17 in fourth grade, and 20 in fifth grade. The average number of students per classroom was 21 (SD = 3.94). The average number of years of teaching experience was 11.72 (SD = 8.52). Educational degree included 45% with bachelor degree, 47% with a master’s degree, and 8% did not report.
Forty observers (30 females) were included. The majority were Caucasian (90%). The average age was 37.32 (SD = 14.88). Educational degree included 25% with an associate degree, 13% with bachelor degree, 53% with a master’s degree, and 9% with a doctoral degree.
Measure
CSS for Elementary School—Observer Form (version 2. 0)
The CSS was designed for identification and progress monitoring of teachers’ instructional and behavioral management strategy usage. The CSS is composed of three assessment stages that includes empirically supported items/strategies (e.g., Gable et al., 2009; Marzano, Pickering, & Pollock, 2001; Walker, Colvin, & Ramsey, 1999). For Stage 1, two 30-min classroom observations (within 7 days) are conducted. The observer records the frequencies of discrete instructional and behavior management strategies by tallying how often six teacher behaviors/strategies occurred across the two lessons (see Table 1). The Stage 1 six teacher behaviors yield a total score and two additional scores (i.e., praise − correct feedback and praise − (corrective feedback + clear commands + vague commands).
After completing the observations, raters fill out Stage 2. The Stage 2 Strategy Rating Scales assess important instructional and behavioral management strategies that cannot be discretely counted in addition to rating appropriate use (i.e., ideal frequency − actual frequency) aspects of the six behaviors from Stage 1. Observers fill out a total of 57 items on the Positive Instructional Strategies (PIS) and Behavioral Management Strategies (BMS) scales. The PIS scale includes 26 items on a total scale, two composite scales, and four subscales. The Instructional Methods Composite scale (14 items; maximum score of 98) consists of the instructional delivery (7 items; maximum score of 49) and student focus learning and engagement (7 items; maximum score of 49) subscales. The Academic Monitoring/Feedback Composite scale (12 items; maximum score of 84) consists of the promotes student thinking (6 items; maximum score of 42) and academic performance feedback (6 items; maximum score of 42) subscales.
The BMS scale includes 23 items that composes a total scale, two composite scales, and four subscales. The Behavioral Feedback Composite scale (11 items; maximum score of 77) consists of praise (5 items; maximum score of 35) and corrective feedback (6 items; maximum score of 42) subscales. The Proactive Methods Composite scale (12 items; maximum score of 84) consists of prevention management (5 items; maximum score of 35) and directives/transitions (7 items; maximum score of 49) subscales (see Table 1).
After each 30-min classroom observation, observers rate how often (frequency rating) teachers used specific positive instructional and behavioral management strategies on a 7-point Likert-type scale (1 = never used, 3 = sometimes used, 7 = always used) and then rate how often the teachers should have used each strategy (ideal frequency) on the same 7-point Likert-type scale. Frequency ratings are subtracted from ideal frequency ratings, yielding “discrepancy scores” (signed values) that suggest the under use (i.e., positive value), appropriate use (i.e., a value approximately zero), or over use (i.e., negative value) of specific items/strategies. The larger the positive or negative value, the greater the suggested amount of teacher practice change is needed. For Stage 3, a classroom checklist is completed related to classroom structure and routines. For this investigation, the classroom checklist was not included.
The CSS Observer Form (version 2.0) has strong face, content, and construct validity. The Stage 2 PIS and BMS rating scales are theoretically and factor analytically derived (confirmatory factor analysis) within classroom observations (Reddy & Fabiano, 2012). The CSS has strong internal consistency (Cronbach αs of 0.93 and 0.92), as well as good interrater reliability (r = 0.72 to 0.94; percentage agreement 88% to 92%) and test–retest reliability (approximately 2 to 3 weeks, unadjusted r = 0.77 to 0.86; percentage agreement 81% to 93%). Differential item functioning analyses have revealed that the Stage 2 Strategy Rating Scales and items are free of item bias for important teacher demographic variables (e.g., educational degree, tenure status, years of teaching experience). Research has found the CSS scores predict state-wide mathematics and literacy testing scores and are sensitive to change following brief teacher consultation for improving classroom practices (Reddy & Fabiano, 2012). The CSS Observer Form requires minimal training and includes explicit instructions and examples, as well as a 5-min DVD trainer.
Classroom Assessment Scoring System (CLASS)
The CLASS is an observational measure designed for researchers to assess global classroom climate and instructional quality through observation of student and teacher interactions. The constructs of the CLASS were based on research on the impact of student and adult interactions on student development and learning (Pianta et al., 2008). The CLASS is composed of 10 single-item dimensions corresponding to three theoretically and factor analytically derived domains (i.e., emotional support, classroom organization, and instructional support) that measure global classroom quality (see Table 2).
The CLASS observation includes six cycles (observations) of 20-min intervals. During this time observers take notes relevant to each of the 10 dimensions. Following each observation, observers rate classrooms on each of the 10 dimensions using a 7-point Likert-type scale. CLASS ratings represent the observed quality of each dimension and ratings range from low quality (1, 2), to mid quality (3, 4, 5), and high quality (6, 7). Lower ratings on the CLASS indicate a lesser amount of indicators for each dimension while higher ratings indicate a greater amount of indicators. Observers are to rate each classroom holistically on each dimension based on the associated indicators. The CLASS requires 2 days of training with a designated CLASS trainer and a web-based reliability test to obtain an observer reliability certificate.
Drawn from six large studies, the CLASS and its predecessor the COS evidence strong psychometric properties. The CLASS has good internal consistency estimates (Cronbach αs of the three domains 0.76 to 0.92), interrater reliability (i.e., within 1 point of master codes on each dimension; average percentage agreement of the 10 dimensions 87%), and test–retest reliability estimates for 1 day, 2 days, and 1 week (r = 0.73 to 0.85). Lower levels of stability are found across the school year (r = 0.25 to 0.64). In addition, the CLASS preschool–kindergarten version has adequate concurrent and divergent validity with the Early Childhood Environment Rating Scale—Revised Edition yielding r of 0.33 to 0.63 and Emerging Academic Snapshot (Ritchie, Howes, Kraft-Sayre, & Weiser, 2001) yielding r of 0.12 to 0.42 (La Paro, Pianta, & Stuhlman, 2004; Pianta et al. 2005). Concurrent validity has also been demonstrated (e.g., Pakarinen et al., 2010).
Procedures
All observers obtained CLASS reliability certification through a 2-day training performed by a certified CLASS trainer and passed the CLASS reliability assessment. The CLASS test authors advised that the CLASS observation method of six 20-min cycles be modified to correspond to the CSS two 30-min observations and the CLASS administration procedures be used for fourth- and fifth-grade classrooms in this study.
Informed consent was obtained from all participating teachers. For each classroom the two observations were conducted within seven school days. One observer administered the CSS and a second observer administered the CLASS simultaneously. All CSS and CLASS completed forms were independently returned to the study coordinators within 24 hours. CSS and CLASS scores were averaged across the two observations.
Results
CSS Stage 1—Frequency of Teacher Behavior
Table 3 displays the correlations between the CLASS domains and dimensions 1 and the CSS Stage 1 (classroom observation − frequency) Total, six teacher strategies (behaviors), and two difference scores (i.e., P − CF; P − [CF + CC + VC]) computed between sets of CSS Stage 1 teacher strategies. The CSS corrective feedback (frequency) score was negatively correlated with the CLASS emotional support domain and the classroom organization domain and its three corresponding dimensions (i.e., behavior management, productivity, and instructional learning formats). Similarly, the CSS corrective feedback (frequency) was positively correlated with the CLASS negative climate dimension. The CSS academic response opportunities (frequency) was positively correlated with the CLASS classroom organization domain and its three corresponding dimensions (i.e., behavior management, productivity, and instructional learning formats), as well as the instructional support domain and two out of the three corresponding dimensions (i.e., concept development and language modeling). The CSS vague commands (frequency) were negatively correlated with the instructional support domain and two of three of its corresponding dimensions (i.e., concept development and quality feedback). Also, the CSS Total Scale (frequency) was positively correlated with the CLASS language modeling dimension. Clear one- to two-step commands, praise statements, and concept summaries did not correlate with CLASS domains and dimensions.
Correlations Between the CSS Stage 1 Teacher Behaviors and CLASS Domains and Dimensions.
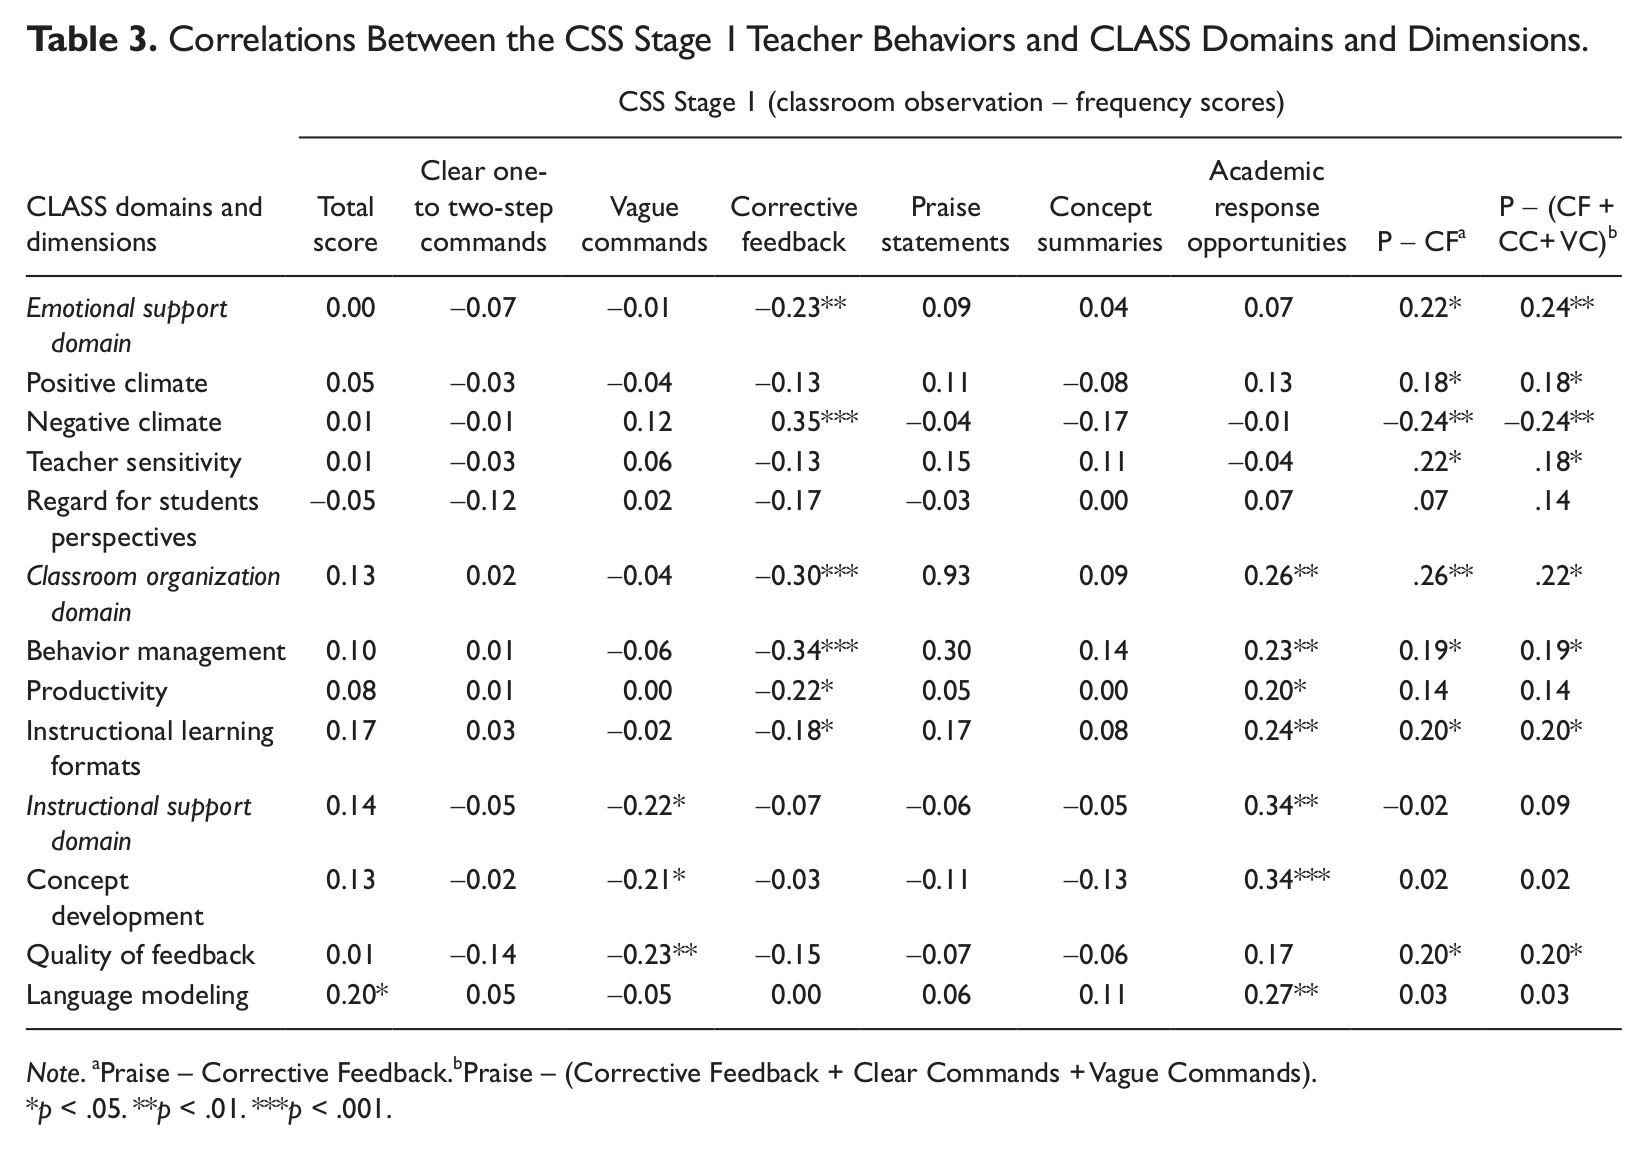
Note. aPraise – Corrective Feedback.bPraise – (Corrective Feedback + Clear Commands + Vague Commands).
p < .05. **p < .01. ***p < .001.
Based on the behavior management literature, two difference scores were computed between sets of CSS Stage 1 teacher strategies (i.e., P − CF and P − [CC + VC + CF]). P − CF represents the amount of praise compared to corrective feedback used by educators. The P − (CF + CC + VC) score represents the amount of praise compared to the amount of demands (i.e., corrective feedback, clear command, or vague command) placed on students. A positive score indicates more praise is used relative to negative approaches. The two CSS difference scores yielded similar results. The CSS P − CF and P − (CC + VC + CF) scores were positively correlated with the (a) CLASS emotional support domain and the dimensions of positive climate and teacher sensitivity, (b) CLASS classroom organization domain and the dimensions of behavior management and instructional learning formats, and (c) CLASS dimension of quality of feedback. Both difference scores were negatively correlated with the dimension of negative climate.
CSS Stage 2—Strategy Rating Scale Discrepancy Scores
Tables 4 and 5 display the correlations between the CLASS domains and dimensions and the CSS Stage 2 PIS and BMS discrepancy scores (computed as ideal frequency ratings − frequency ratings). The CSS discrepancy scores reflect differences between teacher’s usage of strategies (frequency ratings) and ideal usage of strategies (ideal frequency ratings) in the context of lessons. The larger the CSS discrepancy score, the greater the need for a teacher to change his/her instructional and behavioral management practices.
Correlations between the CSS Stage 2 Positive Instructional Strategy Scale Discrepancy Scores a and the CLASS Domains and Dimensions.
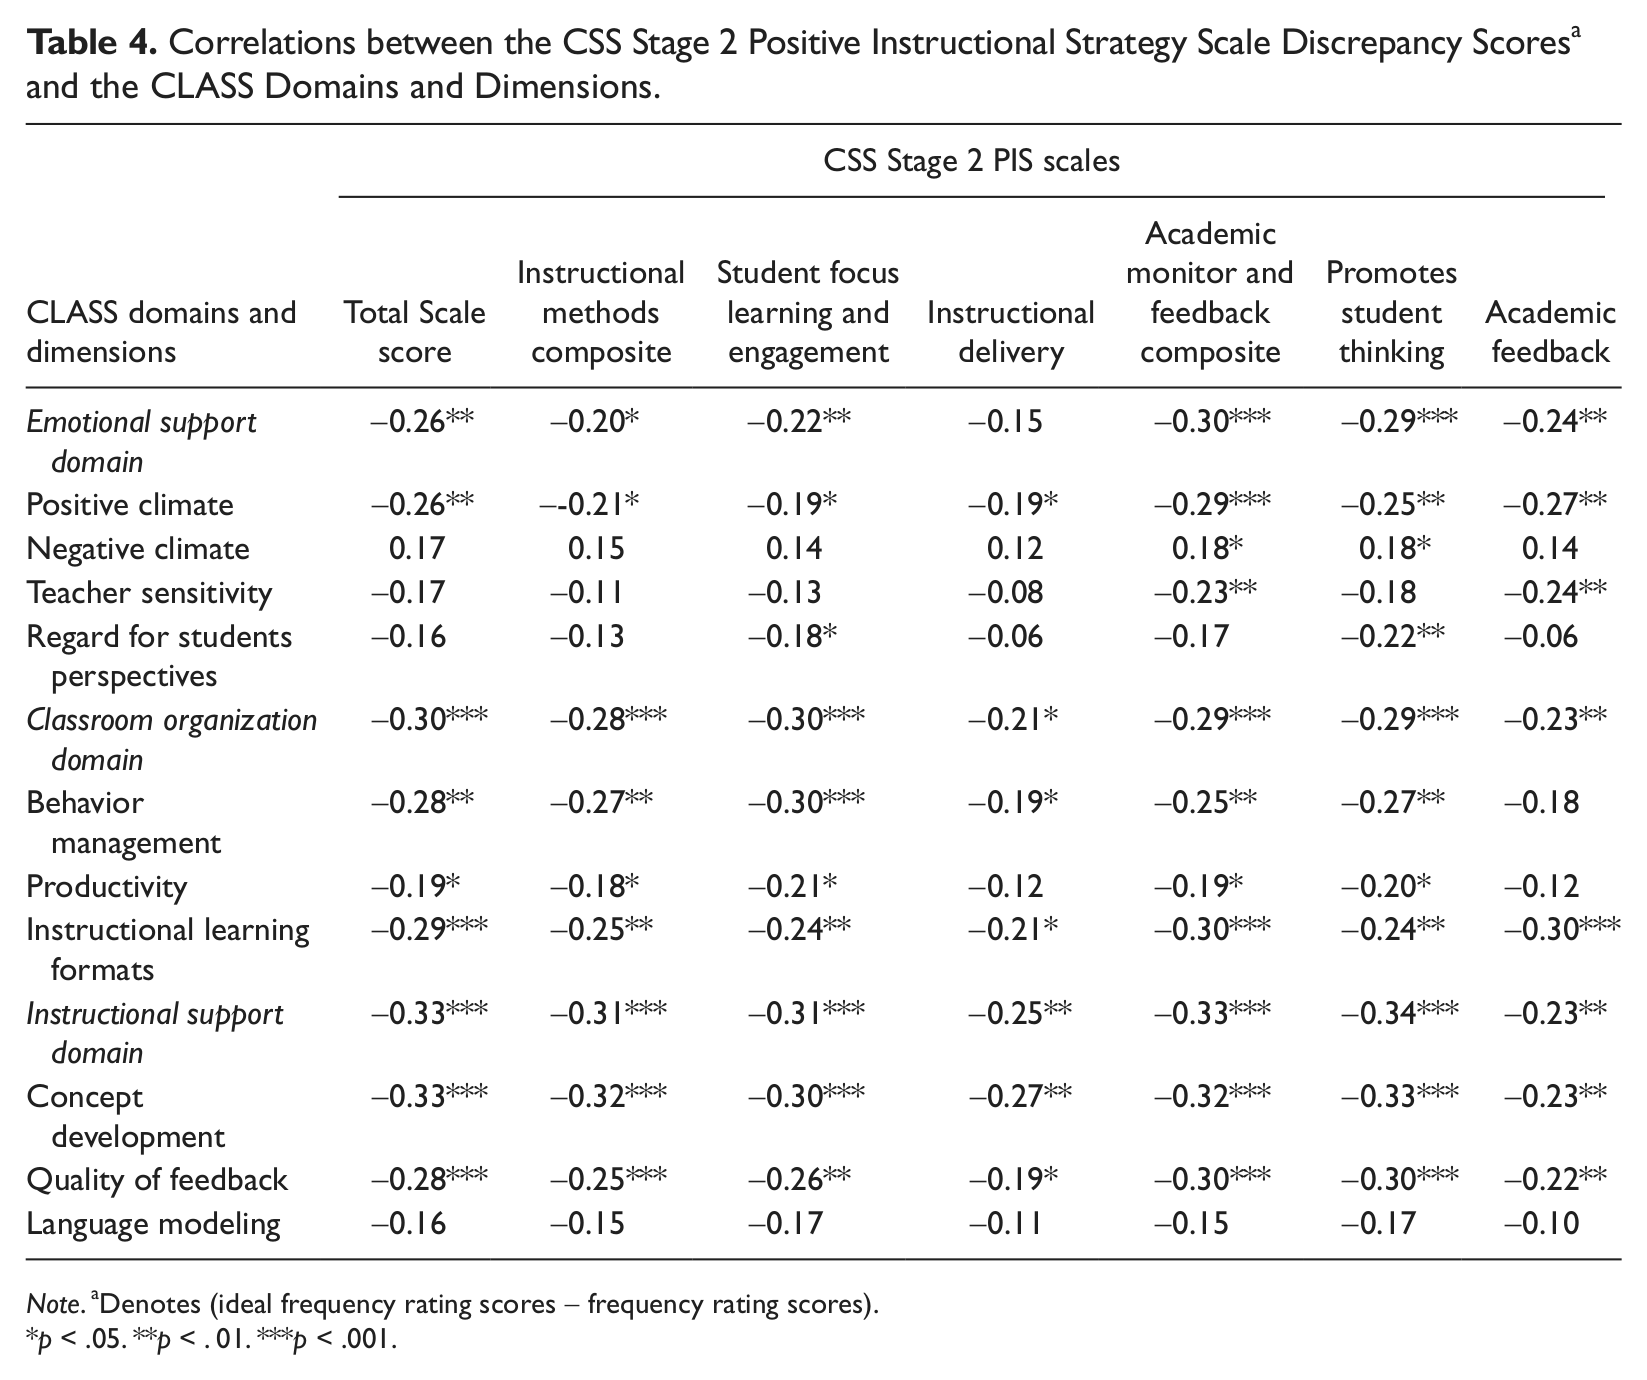
Note. aDenotes (ideal frequency rating scores − frequency rating scores).
p < .05. **p < . 01. ***p < .001.
Correlations Between the CSS Stage 2 Behavior Management Strategies Scale Discrepancy Scores a and the CLASS Domains and Dimensions.
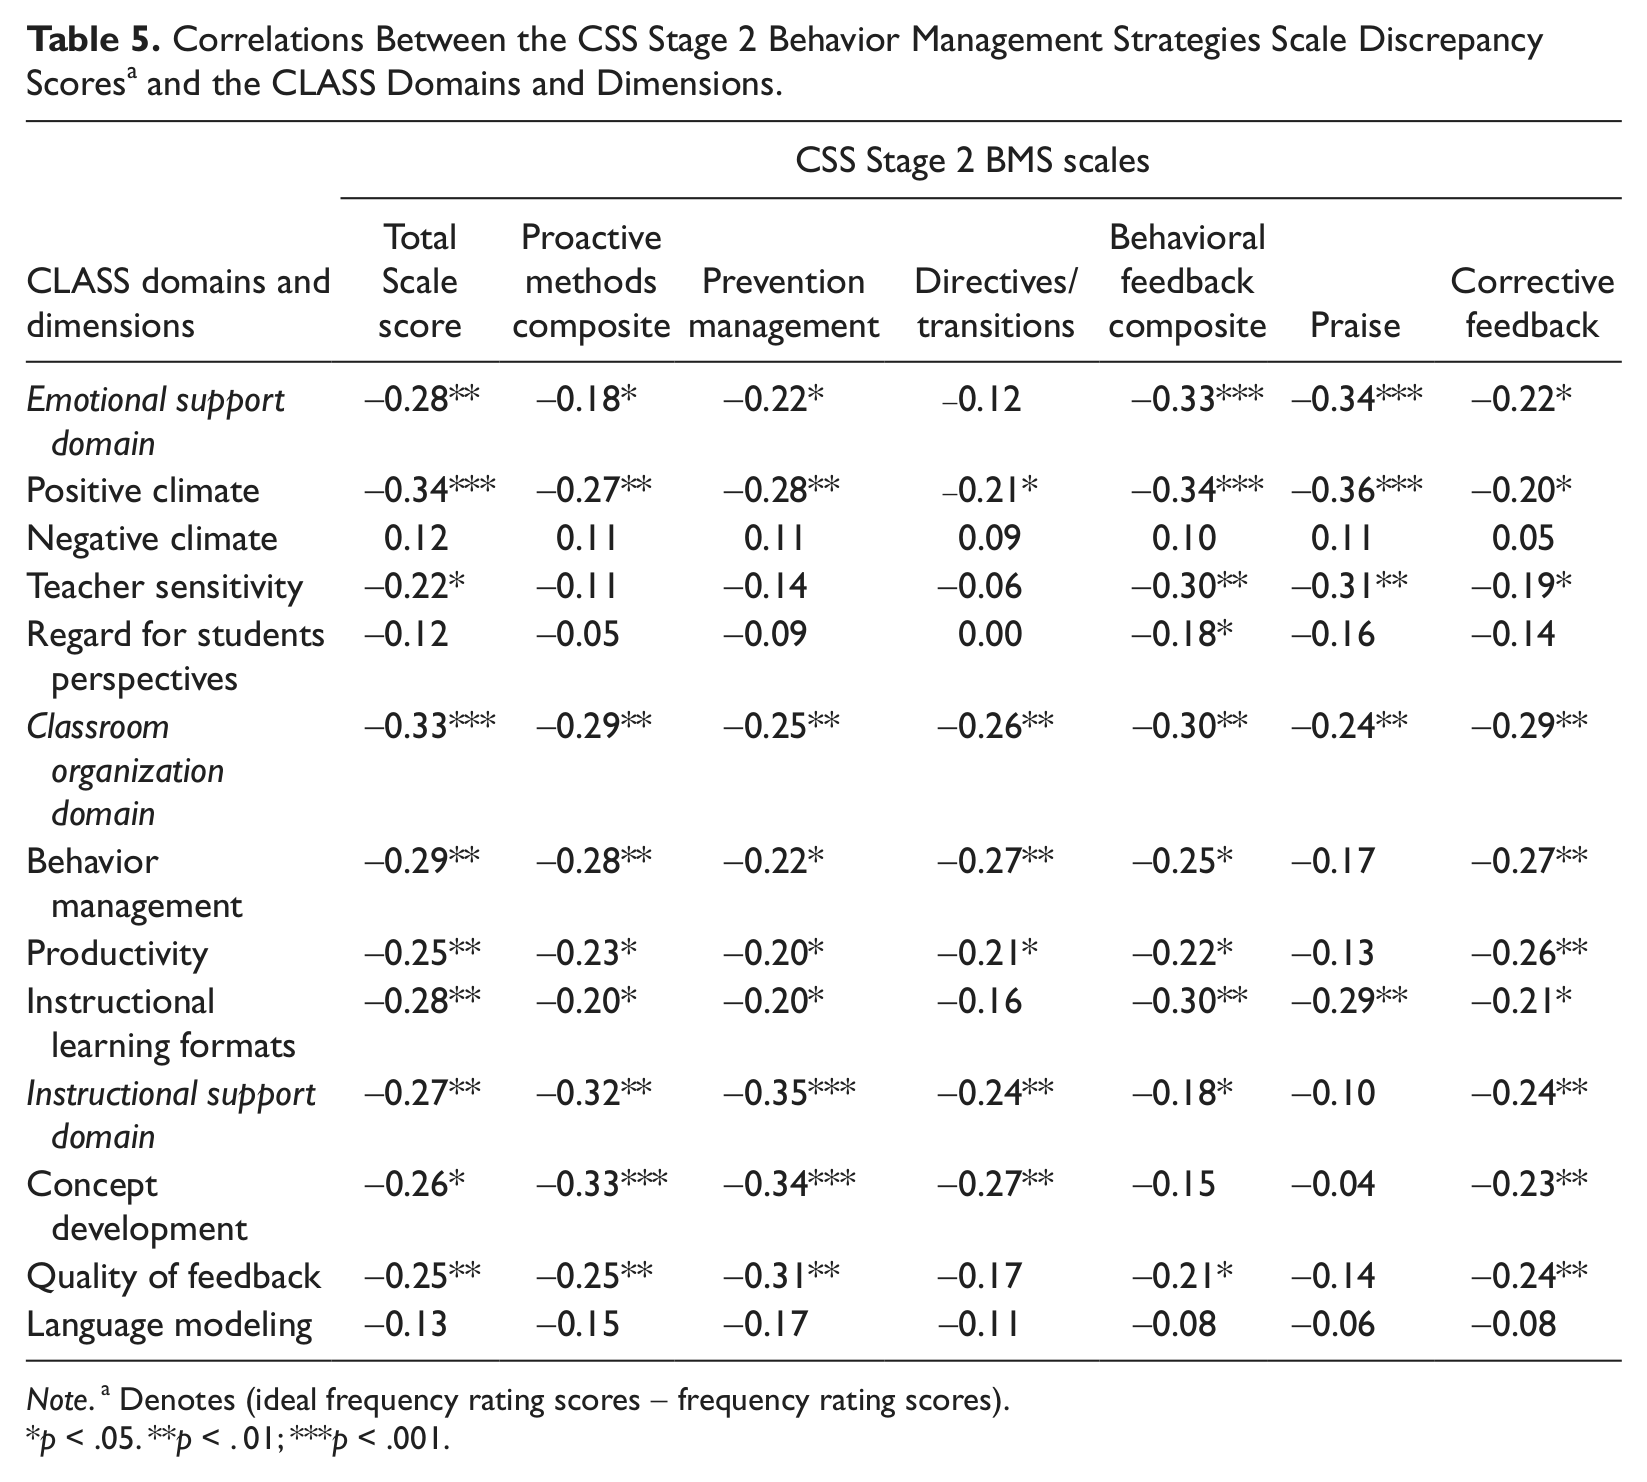
Note. a Denotes (ideal frequency rating scores − frequency rating scores).
p < .05. **p < . 01; ***p < .001.
As shown in Table 4, all of the CSS PIS scales negatively correlated with the CLASS classroom organization and the instructional support domains and dimensions of positive climate, instructional learning formats, concept development, and quality of feedback. With the exception of the CSS instructional delivery subscale, all other CSS PIS scales negatively correlated with the CLASS emotional support domain. All of the CSS PIS scales with the exception of the academic feedback subscale, negatively correlated with the CLASS dimension of behavior management. The CSS instructional delivery and academic feedback subscales did not correlate with the CLASS productivity dimension, while all other CSS PIS scales negatively correlated with this dimension. The CSS subscales student focus learning and engagement and promotes student thinking negatively correlated with the CLASS regard for students perspectives dimension. The CSS monitoring and feedback composite, along with its associated subscale academic feedback, negatively correlated with the CLASS teacher sensitivity dimension. The CSS monitoring and feedback composite, along with its associated subscale of promotes student thinking, positively correlated with the CLASS negative climate dimension. No correlations were found between the CSS discrepancy scale scores and the CLASS language modeling dimension.
As shown in Table 5, all of the statistically significant CSS BMS scales were negatively correlated with the CLASS domains and dimensions. All of the CSS BMS scales negatively correlated with the CLASS positive climate dimension and classroom organization domain. All of the CSS BMS scales, except for the praise subscale, negatively correlated with the CLASS behavior management and productivity dimensions, as well as the instructional support domain. All of the CSS BMS scales correlated with the CLASS emotional support domain and instructional learning formats dimension with the exception of the directives/transitions subscale. The CSS BMS Total Scale, proactive methods composite and associated subscales (prevention management and directives/transitions subscales), and the corrective feedback subscale correlated with the CLASS concept development dimension. The CSS BMS Total Scale, the behavioral feedback composite score and its associated corrective feedback subscale, along with proactive methods composite and associated prevention management subscale correlated with the CLASS quality of feedback dimension. The CSS BMS Total Scale, along with the behavioral feedback composite and associated subscales, negatively correlated with the CLASS teacher sensitivity dimension. The CSS BMS scales and the CLASS negative climate and language modeling dimensions were not correlated.
Discussion
This investigation examined the concurrent and discriminant validity of the CSS Observer Form in comparison to the CLASS. Overall, the CSS evidenced acceptable concurrent and discriminant validity. Results are discussed in light of the unique conceptual and methodological differences between the measures.
Both the CSS and CLASS are observational measures that assess important and complimentary elements of effective classrooms. The CLASS measures global classroom quality via student–teacher interactions, while the CSS measures educators’ use of specific instruction and behavioral management strategies in learning contexts. The CLASS was designed for large-scale research and is often administered by nonschool personnel. In contrast, the CSS was designed for routine educational practice (i.e., repeated use for teacher progress monitoring) for school personnel.
The CLASS and CSS also differ in the level of score inference. As noted by the CLASS test authors, “Because of the highly inferential nature of the CLASS, scores should never be given without referring to the manual” (Pianta et al., 2008, p. 17). CLASS observers are asked to infer the quality of student–teacher interactions by considering several markers (e.g., flexibility and student focus, support for autonomy, and leadership) each which include several indicators (e.g., incorporates student’s ideas) before providing an overall quality rating on a 7-point Likert-type scale. In contrast, CSS observers are asked to tally the frequency of six teacher strategies followed by the completion of the Stage 2 PIS and BMS Strategy Ratings scales (frequency of strategies used and the ideal frequency of strategies used) and Stage 3 classroom checklist. Results in this investigation are consistent with previous CLASS concurrent validity studies (e.g., La Paro et al., 2004; Pianta et al., 2005). Pianta et al. (2005) noted that the disparity between quantity-related measures (Snapshot) versus quality-related measures (CLASS) may yield weaker correlation coefficients (concurrent validity).
Findings highlight the relationship between measures of classroom quality and teachers’ use of evidence-based instructional and behavioral management strategies. Of important note, the directional nature of the CSS and CLASS correlation coefficients underscore the abilities of the measures to tap aspects of classroom quality and classroom practices both independently and collectively. For example, the CSS Stage 1 corrective feedback (frequency) negatively correlated with the CLASS emotional support domain, the classroom organization domain and its three associated dimensions (Table 3). Similarly, corrective feedback positively correlated with the CLASS negative climate dimension. The CSS’s academic response opportunities (frequency) positively correlated with the CLASS classroom organization domain, its three associated dimensions, the CLASS instructional support domain and the dimensions of concept development and language modeling. As measured by the CSS, greater use of academic response opportunities enhance: (a) verbal communication between the teacher and students that may increase CLASS language modeling dimension scores and (b) develop concepts that may increase concept development dimension scores. research has found that educators’ increased use of opportunities to respond (i.e., academic response opportunities) in general improves on-task behavior, disruptive behavior, instructional time efficiency, and academic outcomes (e.g., Partin, Robertson, Maggin, Oliver, & Wehby, 2010; Sutherland et al., 2003). These outcomes are associated with the CLASS classroom organization domain and behavior management, productivity, and instructional learning formats dimensions.
As shown in Tables 4 and 5, high-quality classrooms use both instructional and behavioral management strategies. The CSS Stage 2 PIS and BMS discrepancy scores resulted in several statistically significant correlations with the CLASS domains and dimension scores. As indicated, the CSS discrepancy scores reflect differences between teacher’s usage of strategies (frequency ratings) and ideal usage of strategies (ideal frequency ratings) in the context of lessons. The larger the CSS discrepancy score the greater the need for a teacher to change his/her instructional and behavioral management practices. Overall, the CSS PIS and BMS discrepancy scores and CLASS domains and dimensions scores yielded negative correlations with the exception of the CLASS negative climate dimension, suggesting that as teachers need for change in classroom practices increased, classroom quality as measured on the CLASS domains and dimensions decreased. These results have potential implications for tailoring supports and interventions for teachers’ best classroom practices that promote student learning outcomes.
Strengths and Limitations
Study strengths are (a) inclusion of a stratified multistate sample of general education teachers and (b) comparison of a new measure to a widely researched classroom observation system of global classroom quality (the CLASS). Potential limitations for generalizability of findings are (a) teachers were predominantly female Caucasians from New Jersey and New York and (b) results may not be generalizable to other states and populations, early education/middle/high school settings, or special education settings. Importantly, these limitations would apply equally to the CLASS and CSS measures, so they do not appear to negatively impact the primary question of concurrent and discriminant validity.
It is important to note that the measures used in this investigation represent operationalized, objective, psychometrically sound tools for documenting teacher behavior. These can be contrasted with narrative or unstructured observations that principals may use during walk-throughs or observations. The CSS requires approximately 60 min of observer time per teacher which is comparable to observation time in routine educational practice.
Conclusion
This investigation provides initial evidence of the concurrent and discriminant validity of the CSS Observer Form. As hypothesized, findings revealed that the CSS exhibits acceptable, but modest concurrent validity with the CLASS. Results suggest that the CSS measures constructs similar and complimentary to those assessed by an observational measure that taps global classroom climate of teacher–student interactions. Findings highlight the unique features of each measure and how each measure may aid in the assessment process of teachers.
While the process of validation of any new measure is an ongoing endeavor, this study offers initial support for the utility of the CSS as a measure of general education teacher strategies for educational practice. Like all assessment, the CSS has particular strengths and weaknesses. Yet the CSS offers school personnel a promising tool for assessing teacher practices that is practical, reliable, and valid.
Footnotes
Authors’ Note
The opinions expressed are those of the authors and do not represent views of the Institute or the U.S. Department of Education.
Declaration of Conflicting Interests
The author(s) declared no potential conflicts of interest with respect to the research, authorship, and/or publication of this article.
Funding
The author(s) disclosed receipt of the following financial support for the research, authorship, and/or publication of this article: The research reported here was supported by the Institute of Education Sciences, U.S. Department of Education, through Grant R305A080337 to Rutgers University.