
Abstract
The purpose of this study was to determine the constructs measured by the WISC-IV and the consistency of measurement across large normative and clinical samples. Competing higher order four- and five-factor models were analyzed using the WISC-IV normative sample and clinical subjects. The four-factor solution is the model published with the test manual. In the five-factor model, the POI differentiated into a visual-spatial factor (consisting of Block Design and Picture Completion) and a fluid reasoning factor (consisting of Matrix Reasoning and Picture Concepts, with and Arithmetic). The five-factor solution included Inductive Reasoning (IR), consisting of Matrix Reasoning and Picture Concepts, as a narrow ability subsumed under the FRI (Gf). When all 15 WISC-IV subtests were considered, both four- and five-factor models were suitable and showed close model-data fit. Further, both models generally demonstrated full factorial invariance between clinical and nonclinical samples. Interpretation of the fifth factor is discussed.
Introduction
The WISC-IV technical manual provided evidence in support of a four-factor model consisting of verbal comprehension, perceptual reasoning, working memory, and processing speed factors (Wechsler, 2003). Subsequent researchers have studied the factor structure of the WISC-IV with some studies supporting four factors and others supporting a five-factor model in which a new fluid reasoning factor is identified by combining elements of the perceptual reasoning and working memory factors. No studies have evaluated the clinical validity of the fifth factor, however.
Among those studies that examined only the four-factor model, Watkins (2006) found that the four-factor model showed a good fit to the data in a nonclinical sample, but recommended that practitioners not discount the strong general factor by overemphasizing interpretation of the four first-order factors. Watkins, Wilson, Kotz, Carbone, and Babula (2006) found that the four-factor model also fit well in a sample of referred students, and repeated the same cautions. Bodin, Pardini, Burns, & Stevens (2009) replicated the Wechsler four-factor structure in a clinical neuropsychological sample. Chen, Keith, Weiss, Zhu, & Li (2010) found the four-factor model invariant across four distinct Asian cultures represented by nonclinical samples from Hong Kong, Macau, Taiwan, and mainland China. Chen & Zhu (2012) found the four-factor model invariant between a mixed clinical and nonclinical sample of U.S. children. They identified intercept differences for two subtests, but no significant differences in factor patterns or loadings, and suggested that the intercept differences are to be expected due to the clinical characteristics of the syndromes sampled.
Among those studies that tested alternative models, Keith, Fine, Taub, Reynolds, & Kranzler (2006) compared the four-factor model to a five-factor model derived from the Cattell-Horn-Carroll model of intelligence (CHC; Carroll, 1993) in which a fifth factor labeled fluid reasoning was indexed by the Matrix Reasoning and Picture Concepts subtests from the Perceptual Reasoning Index, with the Arithmetic subtest from the Working Memory Index. They argued that while the four-factor model fit the data well, the five-factor model showed a superior fit. Chen, Keith, Chen, & Chang (2009) found support for both four- and five-factor models in a large sample of Taiwanese children. Lecerf, Rossier, Favez, Reverte, & Coleaux (2010) also tested various CHC-derived models in the French WISC-IV standardization sample, and found six factors provided the best fit to the data. Similar to Keith and colleagues (2006) these researchers found Matrix Reasoning and Picture Concepts loading on a fluid reasoning factor, however, they found that Arithmetic loaded by itself on a sixth factor they labeled quantitative reasoning.
A five-factor model has been recently developed for younger children in the WPPSI-IV (Wechsler, 2012). The same five factors as above were documented for children as young as 4 years old, using different, age-appropriate subtests. But, processing speed and fluid reasoning could not be reliably measured below age 4.
The extant WISC-IV factor analytic literature can be further informed by the WAIS-IV factor analytic literature because the WAIS-IV is based on the same four- factor conceptual model, albeit with a couple of different subtests designed for adults. Several studies have explored the WAIS-IV factor model. Bensen, Hulac, & Kranzler (2010) argued for the clear superiority of a CHC-derived five-factor model in which Matrix Reasoning, Figure Weights, and Arithmetic loaded on a fifth factor they termed fluid reasoning. Ward, Bergman, & Herbert (2011) proposed a modification of the WAIS-IV four-factor model in which residual factors were formed for visual-spatial organization (Block Design, Visual Puzzles, and Picture Completion), and quantitative reasoning (Figure Weights and Arithmetic). Ward and colleagues argued that the modified model was theoretically consistent with the original WAIS-IV model, and that there was no compelling statistical reason to prefer the Bensen et. al. five-factor model over a modified four-factor model. Conceptually, such a model is equivalent to one with correlated first-order visual-spatial and quantitative reasoning factors. Weiss, Keith, Chen, & Zhu (2013) tested a five-factor model in which quantitative reasoning (Arithmetic & Figure Weights) was defined as a narrow ability subsumed under the fluid reasoning factor (Matrix Reasoning, Figure Weights, & Arithmetic). They found that although the fit was slightly better for this model, it was excellent for both the four- and five-factor models. Weiss and colleagues extended previous findings by demonstrating full measurement invariance between normal and clinical samples for both the four- and five-factor models in WAIS-IV.
The present study reexamines the fit of four versus five factors in the WISC-IV standardization sample, and furthers this line of research by evaluating the invariance of both the four- and five-factor measurement models in mixed clinical versus nonclinical samples. Invariance is a fundamental property for any measure (Drasgow, 1984, 1987; Horn & McArdle, 1992; Vandenberg & Lance, 2000) and evaluates whether the test measures the same constructs in different groups. Meaningful comparisons can only be made if the measures are comparable (Chen, Sousa, & West, 2005). In empirical settings, the WISC-IV is often used as part of a diagnostic assessment (Rabin, Barr, & Burton, 2005; Weiss, Saklofske, Coalson, & Raiford, 2010). Implicit in this common practice is the assumption that WISC-IV index scores and subtests results have the same meaning for children in both normative and clinical populations. That is, equivalence is assumed to hold for underlying theoretical structures, factor patterns, magnitudes of factor loadings, and the same subtest means (intercepts) given the same latent means for the underlying factors.
This research employed large samples with considerable variation to investigate the construct validity of the WISC-IV. The purpose of this study was threefold. First, the constructs underlying the WISC-IV were investigated by comparing its current four-factor structure to a hypothesized five-factor structure. Second, abilities measured by subtests and possible cross-loadings were tested and verified for both structures. Third, measurement invariance was evaluated to test whether the 15 subtests in WISC-IV measure latent abilities in the same way for children in the normative sample as those in the clinical sample.
Method
Participants
We used the WISC-IV standardization sample as our nonclinical sample. It includes the responses of 1,525 normal children from 6 to 16 years old. Standardization cases that were missing the supplemental Arithmetic score were excluded because they did not take all 15 WISC-IV subtests. This normative sample was carefully selected by the WISC-IV to match the United States 2000 census for demographics, such as region, gender, parent education, and ethnicity. The overall mean Full-scaled IQ (FSIQ) was 100 (SD = 15). For all 15 subtests, ranges for means were 9.89 to 10.09, standard deviations, 2.89 to 3.07, skewness −0.69 to 0.11, and kurtosis −0.11 to 0.99. Mean age was 11.4 years (SD = 3.2). A more detailed description of this normative sample is in the WISC-IV technical manual (Wechsler, 2003).
We also used the WISC-IV clinical sample. This heterogeneous group included 442 children with various clinical diagnoses. These children had mild or moderate intellectual disability (14.9%); reading, written expression, or math learning disabilities (31.9%); ADHD (12.4%); ADHD and learning disabilities (7.9%); traumatic brain injury (8.8%); autistic or Asperger’s Disorder (6.8%); Language disorder (13.3%); and Motor impairment (3.8%). The mean FSIQ in the overall clinical sample was 80.7 (SD = 20.4). For all 15 subtests descriptive statistics were: means, 6.82 to 8.36; standard deviations, 3.08 to 3.79; skewness, −0.26 to 0.37; and kurtosis, −0.85 to 0.32. The average age (11.1 years) was similar to that of the normative sample (SD = 2.4). A detailed description of this clinical sample is in the WISC-IV technical manual (Wechsler, 2003b).
Instrumentation
The WISC-IV has 10 core subtests [Similarities (SI), Vocabulary (VC), Comprehension (CO), Block Design (BD), Picture Concepts (PCn), Matrix Reasoning (MR), Digit Span (DS), Letter-Number Sequencing (LN), Coding (CD), Symbol Search (SS)], and five supplemental subtests [Information (IN), Word Reasoning (WR), Picture Completion (PCm), Arithmetic (AR), and Cancellation (CA)]. Both core and supplemental WISC-IV subtests were employed in order to ensure adequate markers for as many abilities as possible.
Analysis
We analyzed all subtests of the WISC-IV. Tests for the higher order confirmatory factor structure were based on analysis of mean and covariance structure models using LISREL 8.8 (Jöreskog & Sörbom, 2006). Both four- and five-factor models with hypothesized cross-loadings were tested.
In addition to testing a higher order g, the initial four-factor structure specified five verbal comprehension subtests (SI, VC, CO, IN, WR) on the first factor, four perceptual reasoning subtests (BD, PCn, MR, PC) on the second factor, three working memory subtests (DS, LN, AR) on the third factor, and three processing speed subtests (CD, SS, CA) on the fourth factor. This second-order model was defined as the initial four-factor model (Model A1 in Table 1).
Hypotheses Testing the Four-Factor Structure.
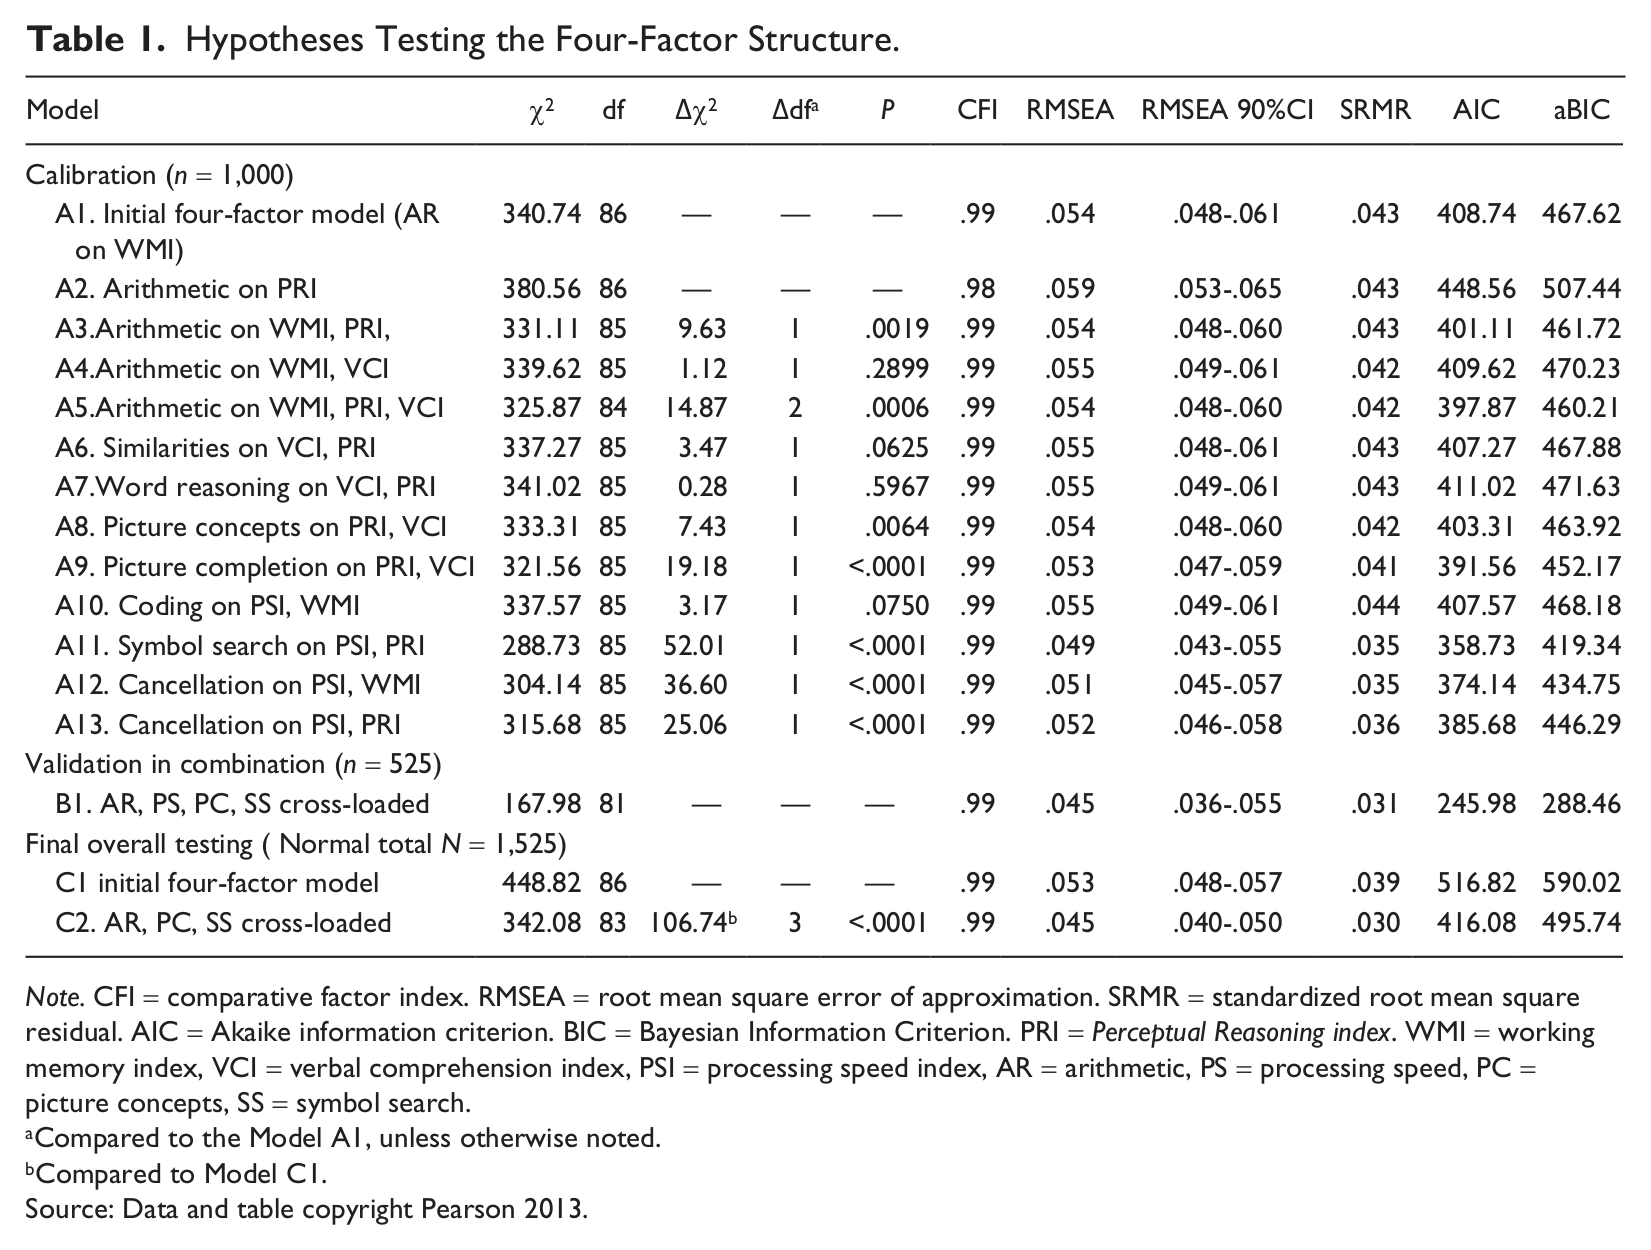
Note. CFI = comparative factor index. RMSEA = root mean square error of approximation. SRMR = standardized root mean square residual. AIC = Akaike information criterion. BIC = Bayesian Information Criterion. PRI = Perceptual Reasoning index. WMI = working memory index, VCI = verbal comprehension index, PSI = processing speed index, AR = arithmetic, PS = processing speed, PC = picture concepts, SS = symbol search.
Compared to the Model A1, unless otherwise noted.
Compared to Model C1.
Source: Data and table copyright Pearson 2013.
The initial five-factor model specified a higher order g and five first-order factors. This initial model was based on evaluation of subtest content (Flanagan & Kaufman., 2004) and previous research described above. Because this model was derived, in part, from CHC theory, both the Wechsler-related and the CHC-related names are used; this convention also allows comparability with both the four-factor model and previous research on CHC. This model specified five subtests (SI, VC, CO, IN,WR) on the verbal comprehension factor (VCI/Gc), two subtests (BD, PCm) on the perceptual organization factor (POI/Gv) factor, three subtests (PCn, MR, AR) on the fluid reasoning factor (FRI/Gf), two subtests (DS, LN) on the working memory factor (WMI/Gsm), and three subtests (CD, SS, CA) on the processing speed factor (PSI/Gs). Compared to the four-factor model, this five-factor model split the four perceptual reasoning subtests into fluid reasoning and perceptual organization factors and specified the Arithmetic subtest on the fluid reasoning factor (Model A1 in Table 2).
Hypotheses Testing the Five-Factor Structure.
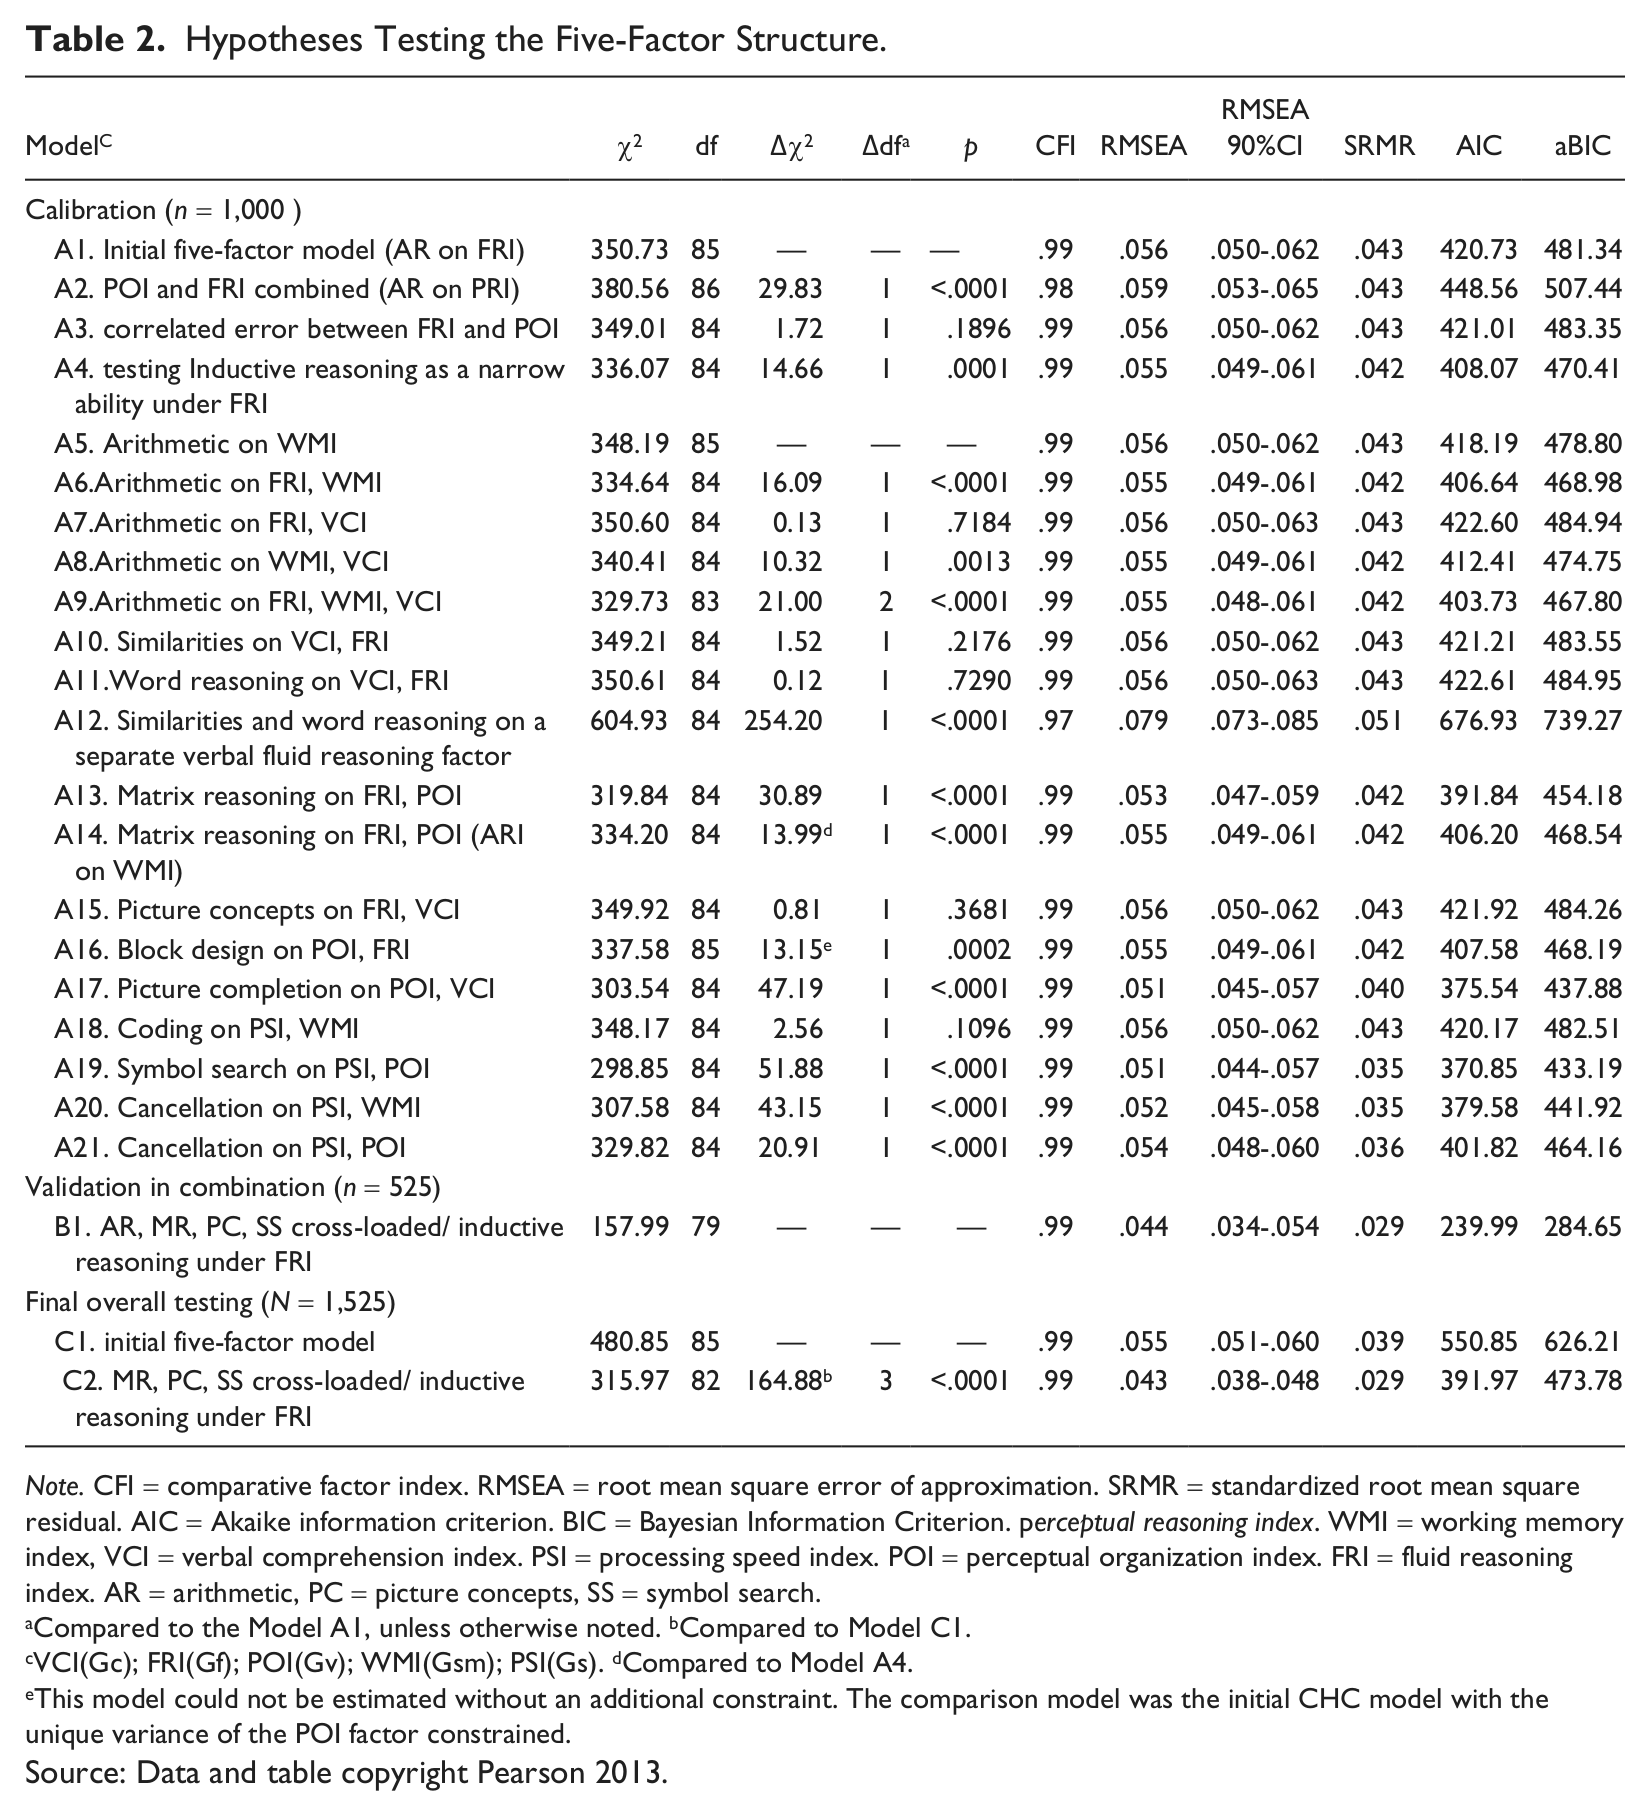
Note. CFI = comparative factor index. RMSEA = root mean square error of approximation. SRMR = standardized root mean square residual. AIC = Akaike information criterion. BIC = Bayesian Information Criterion. perceptual reasoning index. WMI = working memory index, VCI = verbal comprehension index. PSI = processing speed index. POI = perceptual organization index. FRI = fluid reasoning index. AR = arithmetic, PC = picture concepts, SS = symbol search.
Compared to the Model A1, unless otherwise noted. bCompared to Model C1.
VCI(Gc); FRI(Gf); POI(Gv); WMI(Gsm); PSI(Gs). dCompared to Model A4.
This model could not be estimated without an additional constraint. The comparison model was the initial CHC model with the unique variance of the POI factor constrained.
Source: Data and table copyright Pearson 2013.
Alternative competing models of both structures were also tested. Possible cross-loadings and correlated errors were investigated for selected subtests thought to measure multiple abilities or that showed split-loadings in previous studies. Parameters statistically nonsignificant or having values too trivial to be practically meaningful were deleted. For all analyses, a calibration-validation approach was used where two-thirds of the normative sample (n = 1,000) was randomly selected as the calibration sample to test hypotheses and the remaining third (n = 525) was used to cross-validate the results of calibration analyses. Any statistically significant factor loading greater than .10 was explored in the calibration phase, and the cut point was set at .20 in the cross-validation phase to reduce the loadings to nontrivial ones only. Once a best-fitting solution from each of the four- and the five-factor models was calibrated and validated, final parameters were retested using the entire sample (N = 1,525).
Clinical invariance of each final validated model was examined. Six levels of nested models were tested to investigate the degree of invariance. Each level had more constraints than the previous level (Byrne & Stewart, 2006; Chen et al., 2005; Keith & Reynolds, 2012; Meredith, 1993). The initial and weakest level was configural invariance, which assumed the same number of factors and the same overall factor pattern across groups. The second level was first-order factor loading invariance, also called metric (or weak factorial) invariance. Loadings of subtests on factors were constrained so that factor loadings were equal across groups. When the factor loadings are equal, scales of latent variables are the same for both groups and the unit of measurement is identical. That is, for each unit change in the latent variable, scores on subtests change by the same amount in both groups. The third level was intercept invariance, or also known as scalar (strong factorial) invariance. In this level of invariance, any group differences in subtest means are a result of true mean differences in latent factors. Subtests have the same intercepts across groups given the same latent means for an underlying factor. To examine whether “all group differences on the measured variables are captured by, and attributable to, group differences on the common factors” (Widaman & Reise, 1997, p. 296), we tested invariance of residuals (also called strict factorial invariance) at the fourth level. These residuals are a combination of subtest-specific unique variance and random measurement errors. The fifth level was second-order factor loading invariance. This level assumed first-order latent factors show the same amount of change in each group for the same amount of increase in g. Finally, we tested for invariance of disturbances (factor unique variances) of first-order factors. Although residual/disturbance invariance is not fundamentally crucial for measurement invariance, it provides substantial information about human cognitive abilities across groups. First-order factor intercepts were not constrained to be equal across groups because such constraints addressed measurement questions not of interest in this research. For all analyses the scale of latent factors was identified by fixing a factor loading of each factor to one.
Multiple indices of model fit were used to evaluate and compare the various models in this study (Bentler & Bonett, 1980; Hu & Bentler, 1998, 1999; Kline, 2010; Marsh, Balla, & McDonald, 1988). Single models were evaluated using the comparative fit index (CFI), root mean square error of approximation (RMSEA), and standardized root mean square residual (SRMR). An RMSEA less than .05 corresponded to a good fit, and .08 was considered an acceptable fit (McDonald & Ho, 2002). For completeness, we included the 90% confidence interval for RMSEA. SRMR values less than .06 were considered acceptable (Hu & Bentler, 1999). A value of .95 served as the cut off for acceptable fit on all indices ranging from 0 to 1, with 1 indicating a perfect fit (Hoyle & Panter, 1995; Hu & Bentler, 1999; Kline, 2010). Change in chi-squared (Δχ2) was used to evaluate competing, nested models (Bentler & Bonett, 1980). The Akaike Information Criterion (AIC) and sample size adjusted Bayesian Information Criterion (aBIC) were also used for comparisons of competing nested and nonnested models (Kaplan, 2000; Loehlin, 2004), with smaller values indicating a better fit. Comparatively, aBIC has a greater reward for parsimony than does the AIC.
To determine evidence of invariance, since there is little consensus concerning the most appropriate criterion (Byrne & Stewart, 2006), three perspectives were evaluated for invariance analyses: a) the traditional perspective based on Δχ2, b) the practical perspective based on differences in comparative fix index (ΔCFI), and c) a perspective based on aBIC. When evaluating the traditional perspectives, given the large sample and the number of comparisons being made, we used a more strict definition of statistical significance of Δχ2 (p < .001). Comparatively, the Δχ2 test is known to be sensitive to sample size and moderate discrepancies from normality (Kline, 2010; West, Finch, & Curran, 1995). Therefore, Cheung and Rensvold (2002) recommended ΔCFI as superior to Δχ2 for tests of invariance because it is independent of both model complexity and sample size and because it is not correlated with the overall fit measures. “A value of ΔCFI smaller than or equal to –.01 indicates that the null hypothesis of invariance should not be rejected.” (Cheung & Rensvold, 2002, p. 251)”. The aBIC perspective would argue for the model with the smallest aBIC value.
Results
The Most Appropriate Four-Factor Structure
All examinations of the four-factor structure are shown in Table 1. In the calibration phase, goodness-of-fit indexes reported for the initial four-factor model (model A1) were within the acceptable range, showing the four-factor structure fit the data well. Each hypothesis concerning potential cross-loadings was tested individually for cross-loadings to determine whether subtests were relatively pure or mixed measures of the four latent factors. Six originally unspecified parameters were found to yield statistically significant improvement in model fit: Arithmetic was found a mixed measure of WMI, PRI, and VCI. Loadings of Arithmetic on each of these three factors were .39, .26, and .18, respectively. The Δχ2 between model A5 and A1 was statistically significant, suggesting that allowing Arithmetic to have cross-loadings on all three factors substantially improved model fit. Three other subtests also showed significant and meaningful cross-loadings: Picture Concepts loaded mainly on PRI (.46) and slightly on VCI (.15); Picture Completion was cross-loaded on PRI (.43) and VCI (.27); Symbol Search mainly measured PSI (.48) but also some PRI (.32).
Validation analyses tested all six parameters in Model B1, but only AR, PC, and SS showed statistically and practically meaningful cross-loadings (Table 1). Arithmetic was cross-loaded on WMI and PRI (factor loadings were .44, and .21 respectively). This validated model with cross-loaded AR, PC, and SS was retested using the entire sample of 1,525 children (Model C2). This validated model had a far superior fit compared to the initial four-factor model (model C1). Goodness-of-fit indexes for both models were within ideal range.
Standardized estimates for model C2 are shown in Figure 1. All 15 subtests loaded strongly on corresponding factors. Consistent with the literature, Arithmetic was a mixed measure of WMI and PRI (factor loadings were .59 and .24 respectively). Picture Completion was cross-loaded on PRI (.44) and VCI (.24); Symbol Search mainly measured PSI (.49) but also some PRI (.32). All parameter estimates were reasonable and theoretically sound. The WMI, PRI, and VCI factors showed nearly equal loadings on the higher order g factor.
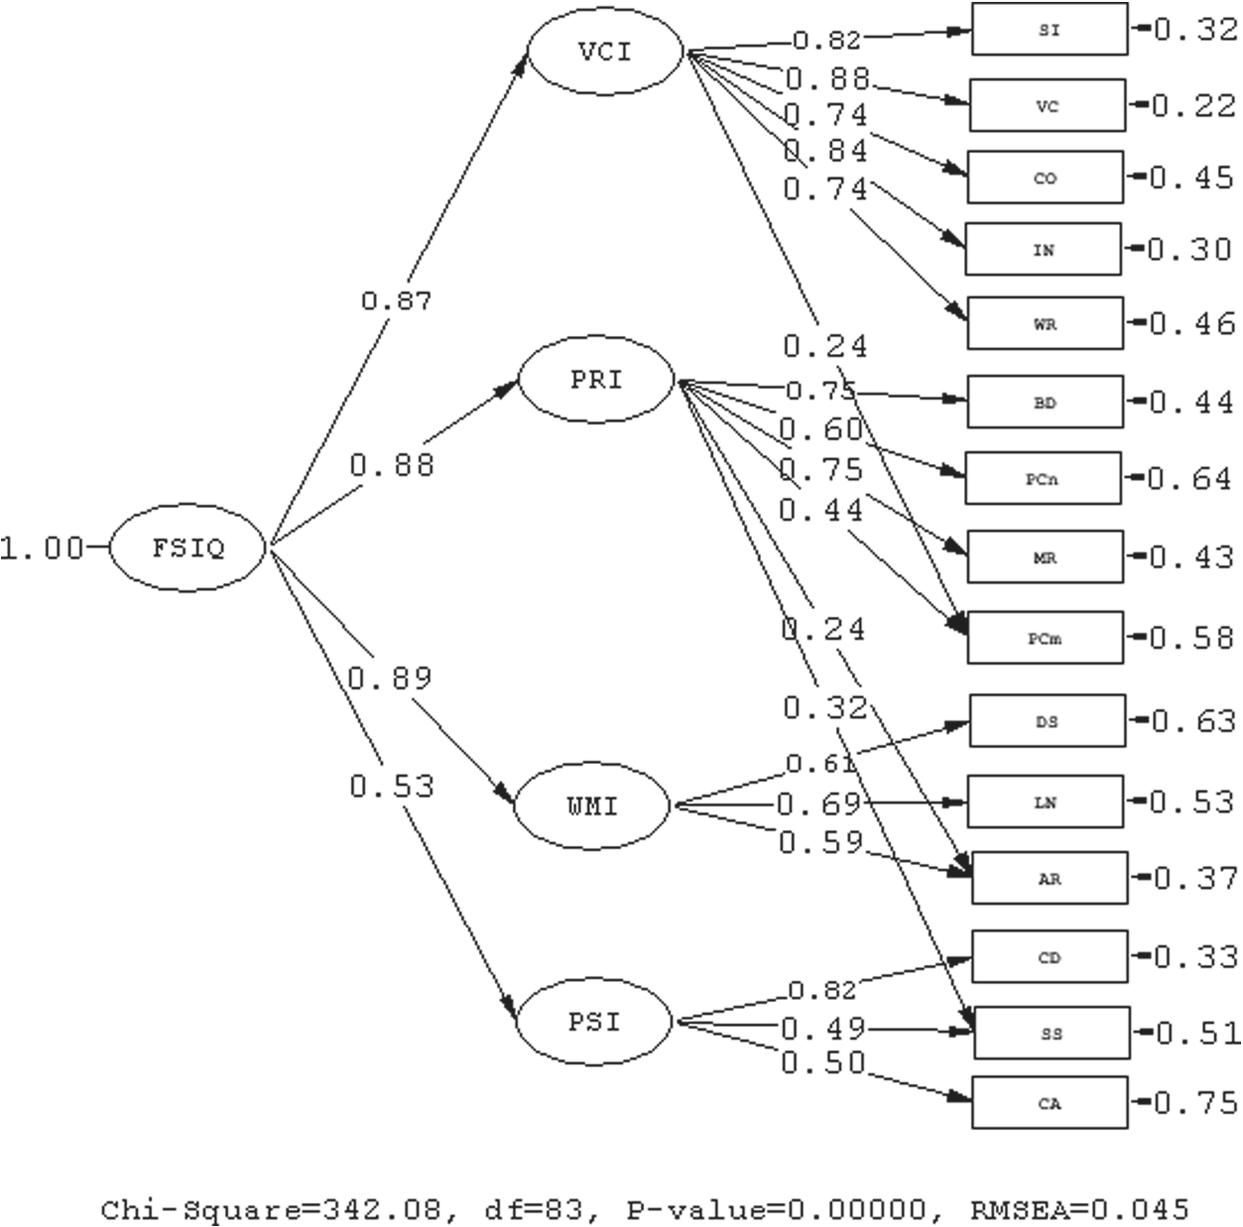
Standardized estimation for the final validated four-factor model.
The Most Appropriate Five-Factor Structure
Examinations of five-factor models are shown in Table 2. In the calibration phase, the initial five-factor model (model A1) showed a good fit to the data, suggesting it was an appropriate model for interpreting WISC-IV results. Each hypothesis of cross-loadings and related errors was individually tested before being cross-validated in combination. Calibration analyses supported separating FRI (Gf) and POI (Gv). Arithmetic was a mixed measure of WMI (Gsm), FRI (Gf), and VCI (Gc) (factor loadings were .38, .26, and .21, respectively). Three other subtests showed statistically significant split-loadings above the .10 cutoff established for the calibration phase: Picture Completion on POI (Gv) (.31) and VCI (Gc) (.42); Symbol Search on PSI (Gs) (.48) and POI (Gv) (.33); and Matrix Reasoning on FRI (Gf) (.37) and POI (Gv) (.41). 1 Allowing a narrow ability Inductive Reasoning (Induct) under FRI (Gf) improved the model fit as well (this model is statistically equivalent to one allowing a correlated error between Matrix Reasoning and Picture Concepts).
When validated in combination and allowing a narrow ability inductive reasoning under FRI(Gf), Arithmetic, Matrix Reasoning, Picture Completion and Symbol Search showed robust split-loadings. Arithmetic was loaded mainly on FRI(Gf) (.45) and WMI(Gsm) (.29) only, but not VCI(Gc)(.05). When tested with the entire sample (N = 1,525), all cross-loadings remained except that Arithmetic showed significant and practically meaningful loading(≥_ .20) on FRI(Gf) (.60) only. The FRI(Gf) factor had a loading of 1.08 on the g factor. The model was reestimated with Arithmetic loaded on FRI(Gf) only, and the g loading of FRI(Gf) factor constrained to a maximum of 1.0 (Model C2). Goodness-of-fit indexes for model C2 suggested a good fit the nonclinical children (CFI = .99, RMSEA = .043, SRMR = .029). With extra parameters allowed, model C2 showed significant improvement compared to the initial five-factor model (model C1) in which no cross-loadings were specified (Δχ2 = 164.88[3], p < .0001).
Standardized estimates for model C2 are shown in Figure 2. All 15 subtests loaded strongly on corresponding factors. Three subtests showed salient split-loadings. Matrix Reasoning mainly measured inductive reasoning and some POI(Gv) (factor loadings were .48 and .32 respectively). Picture Completion measured both POI(Gv) and VCI(Gc) (factor loadings were .40 and .32 respectively). Symbol Search mainly measured PSI(Gs) and some POI(Gv) (factor loadings were .54 and .29 respectively). Arithmetic was found mainly a measure of FRI(Gf)(.79). The highest g loading was by FRI(Gf). This model was similar as the one proposed by Keith et al. (2006), with the exception of the added narrow factor under the FRI(Gf) broad ability in the present analysis.
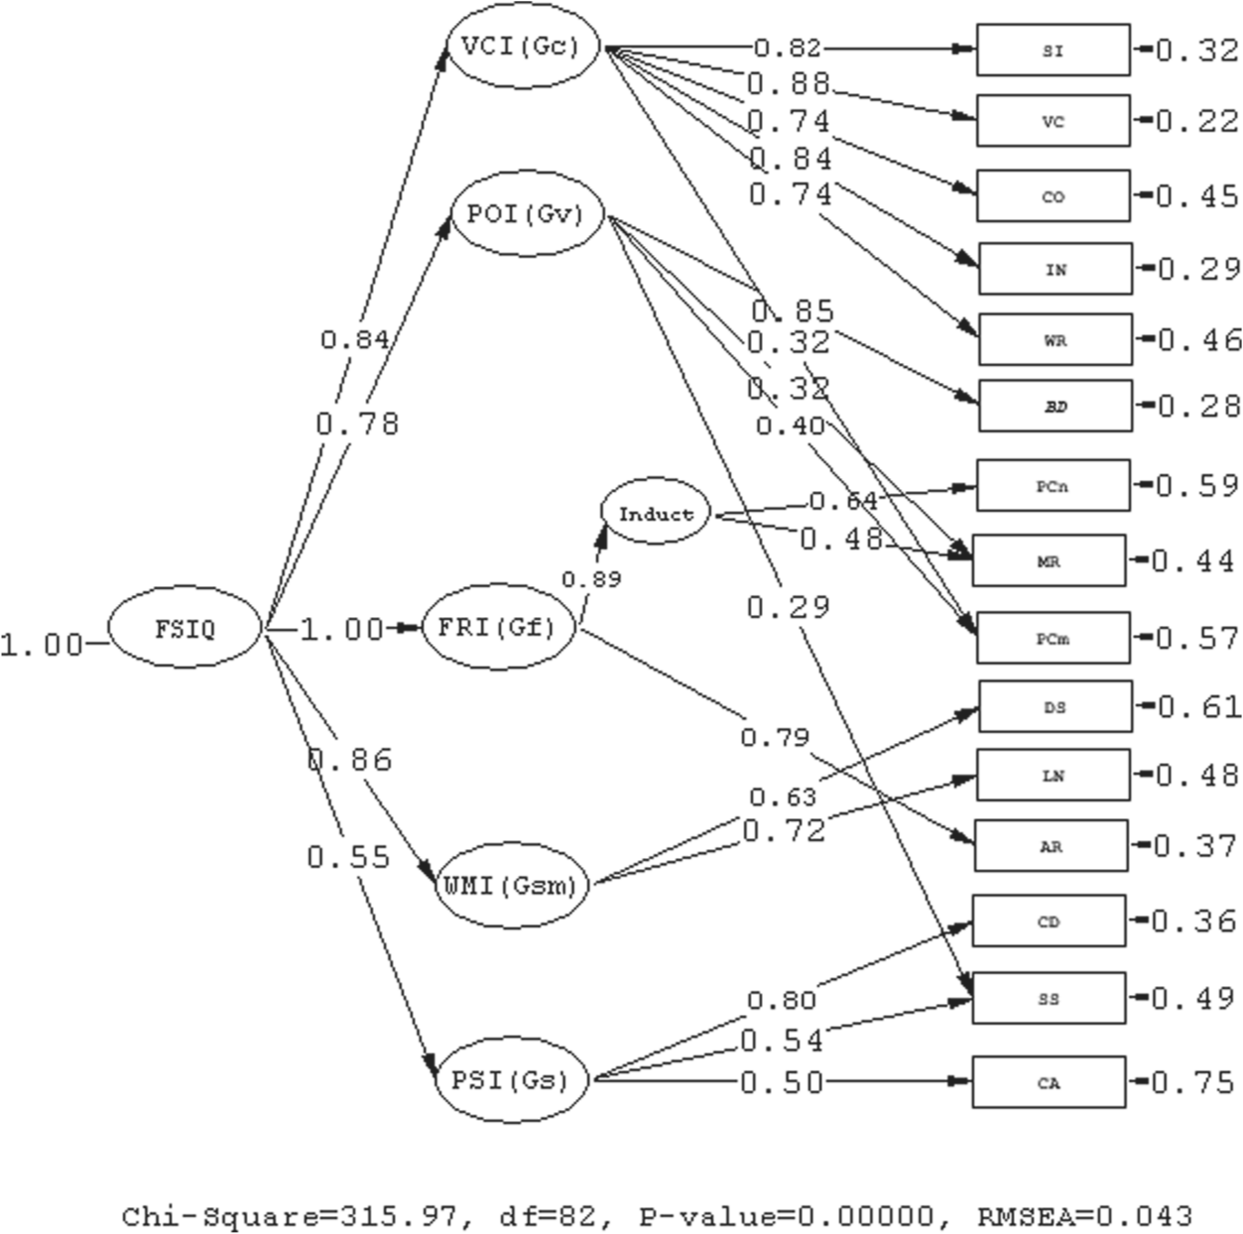
Standardized estimation for the final validated five-factor model.
Which Fit Better: Four- or Five-Factor Model?
Because the fit values of models C1 and C2 in Table 1 and models C1 and C2 in Table 2 were within the ideal range, both four-factor and five-factor models provide a good fit to the data. Therefore, either of these models could serve as a basis for WISC-IV score interpretation. Side-by-side comparison of two structures revealed a similar fit for the two models. When comparing initial models (model C1) from both sets, the aBIC values for four- and five-factor C1 models were 590.02 and 626.21, respectively, which revealed that the four-factor model C1 showed a better fit. However, in contrast, when cross-loadings were allowed, the five-factor model C2 showed a slightly better fit than the four-factor model C2 (aBIC values for four- and five-factor were 495.74 and 473.78, respectively). Differences between models were trivial, suggesting that either model could be used for interpretation.
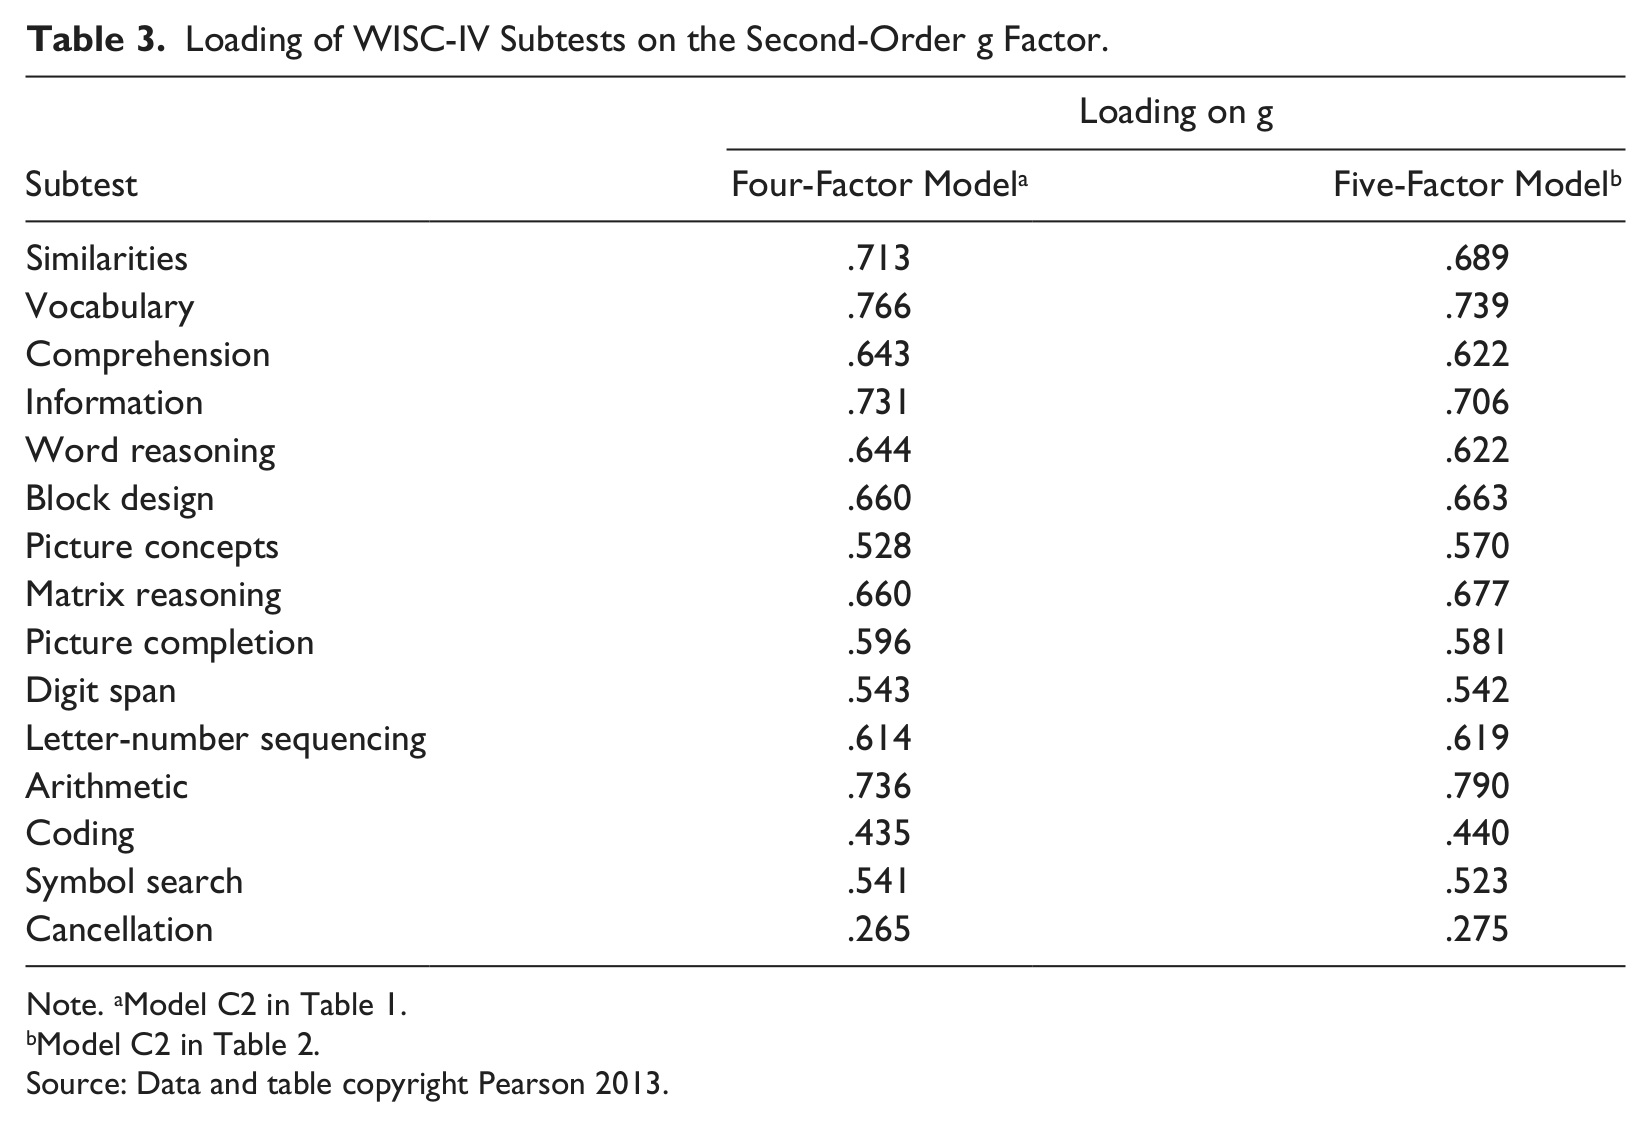
For these two C2 models with cross-loadings, subtest loadings on g are shown in Table 3. Estimated values from both models were similar. Arithmetic, Vocabulary, and Information had the highest loadings on g. The Cancellation subtest had the lowest loading on g.
Loading of WISC-IV Subtests on the Second-Order g Factor.
Note. aModel C2 in Table 1.
Model C2 in Table 2.
Source: Data and table copyright Pearson 2013.
Invariance Between Normative and Clinical Samples in Validated Four-Factor Model
The relatively large variation in sample sizes between the normative and clinical samples would result in excessive power in the standardization group. To prevent findings from being so heavily weighted toward the normative sample, we compared the clinical group (n = 442) with a randomly selected representative sample (n = 442) from the normative group.
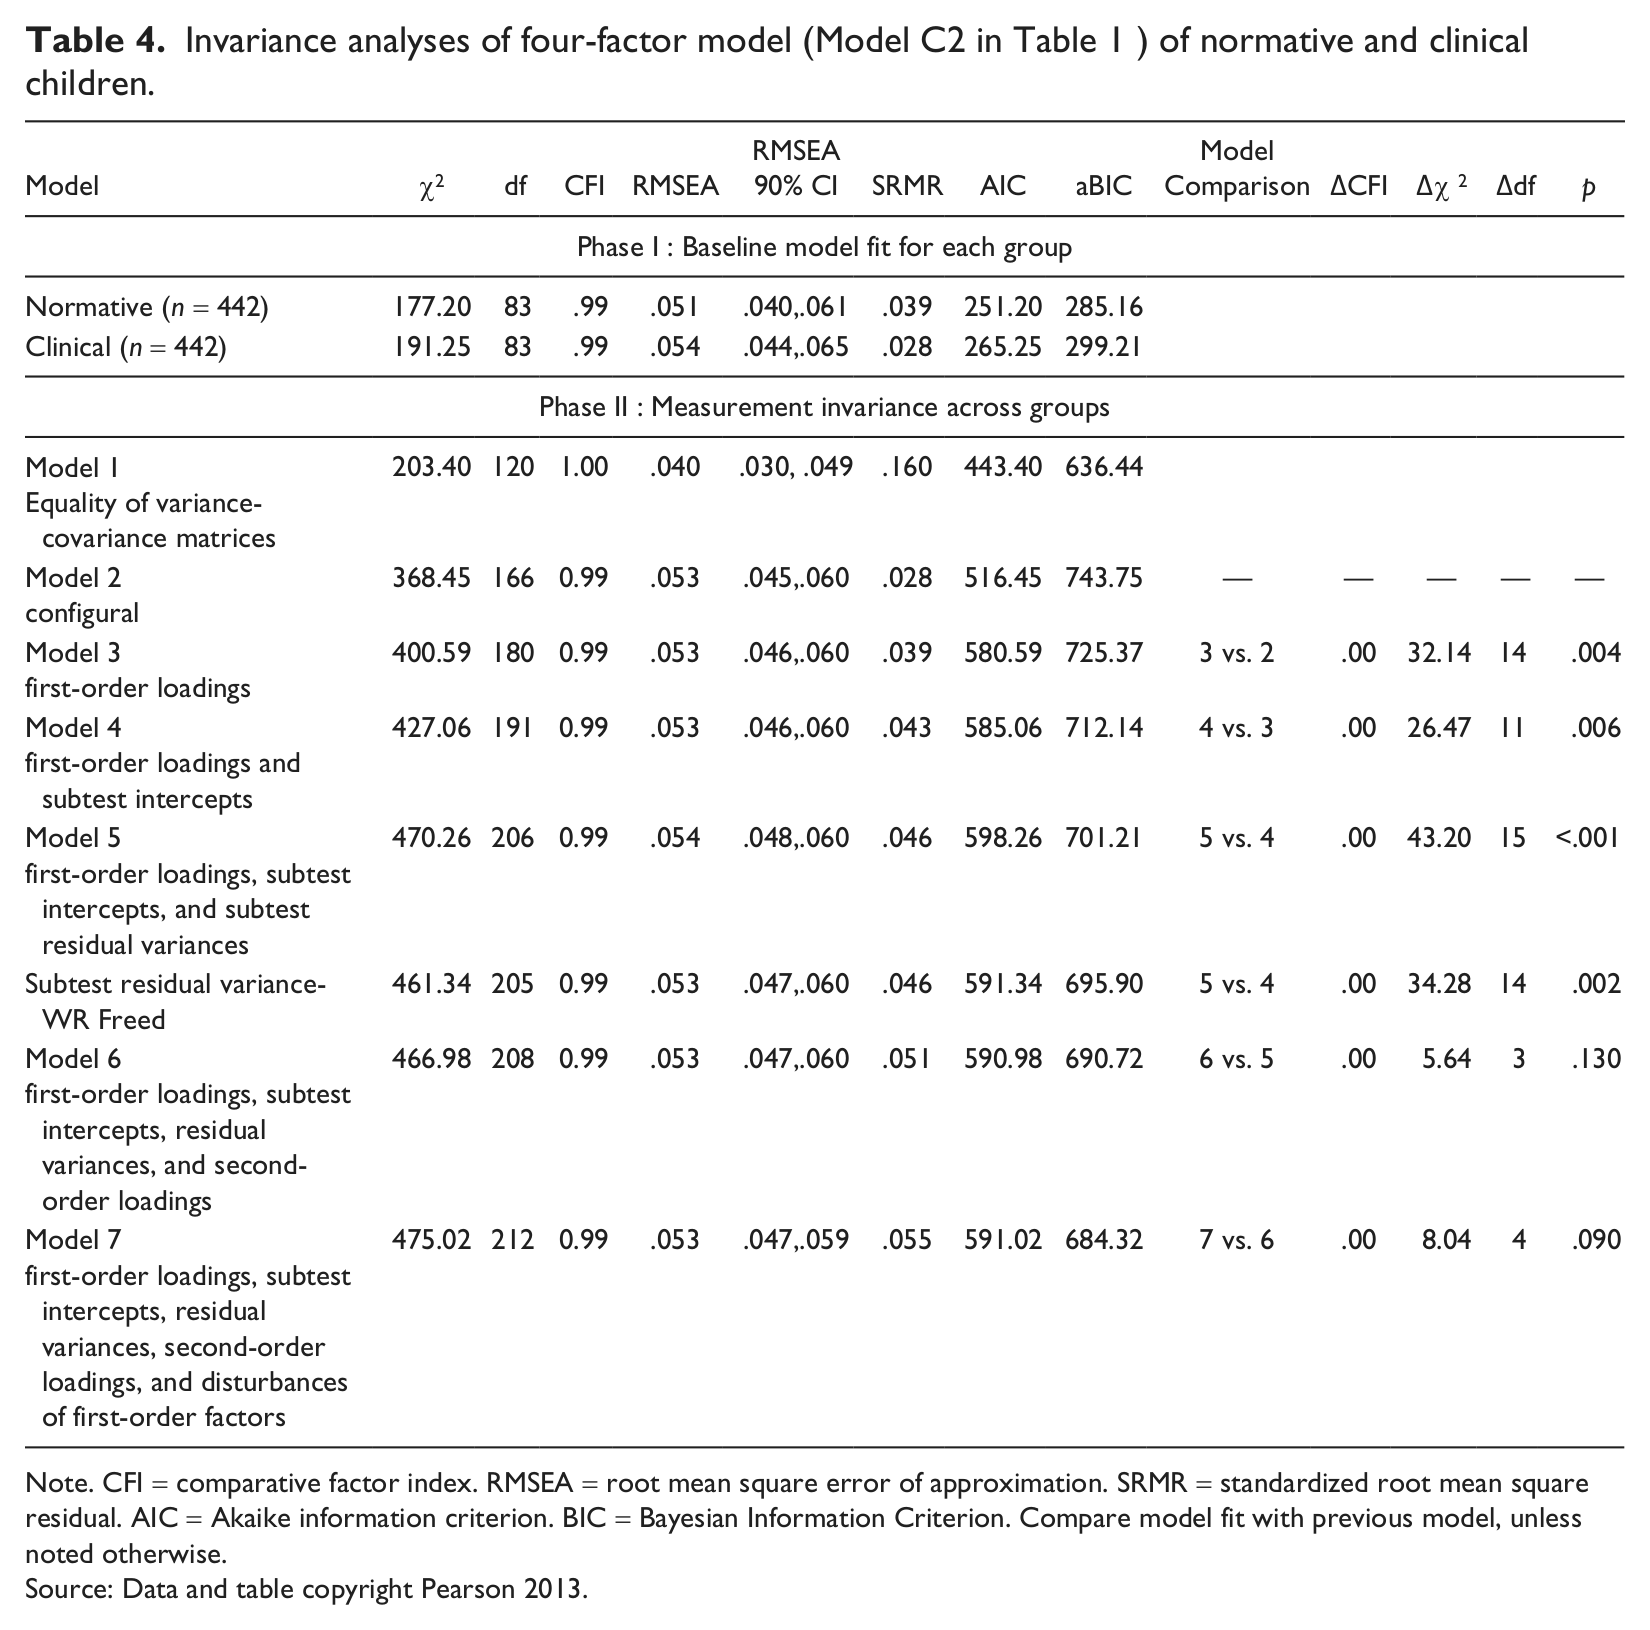
Clinical invariance analyses for the final cross-validated four-factor model (Model C2 in Table 1) are reported in Table 4. Variance-covariance matrices were first constrained to be equal across normative and clinical samples (Model 1). This constrained model fit the data well (CFI = 1.00; RMSEA = .040), suggesting fairly invariant WISC-IV subtest covariance patterns in children. Since any factor structure is derived from these variance-covariance matrices, if the WISC-IV measures the same constructs, factor structure between the normative and clinical samples should be similar.
Invariance analyses of four-factor model (Model C2 in Table 1 ) of normative and clinical children.
Note. CFI = comparative factor index. RMSEA = root mean square error of approximation. SRMR = standardized root mean square residual. AIC = Akaike information criterion. BIC = Bayesian Information Criterion. Compare model fit with previous model, unless noted otherwise.
Source: Data and table copyright Pearson 2013.
First, the configural model (Model 2) provided an acceptable fit to the data. Normative and clinical children shared the same WISC-IV first- and second-order four-factor patterns and corresponding subtests loaded onto the same factors. With the factor pattern established, we imposed cross-group constraints on first-order factor loadings. The fit was not substantially reduced (Model 3). The ΔCFI was 0. Using a .001 criterion, the Δχ2 did not fit significantly worse than did the configural model. This means that the subtests measure the same latent factors in both groups. Next, we constrained subtest intercepts to be equal. To properly identify this model, the means of first-order factors in the normative group were fixed to 0, but those in the clinical group were freed. Thus factor means for the clinical group represent mean differences. All corresponding first-order intercepts were constrained to be equal. There was no deterioration of fit with these constraints. Next, when subtest residuals were constrained as equal across groups, the addition of subtest residual variance constraints significantly reduced fit according the Δχ2, but not according to ΔCFI and aBIC. The source of misfit was the residual variances of the Word Reasoning subtest. When this parameter was freed, model fit improved substantially and no longer differed significantly compared to the first-order factor loading/subtest intercept invariant model. Next, when structural parameters (second-order loadings, first-order unique variances) were constrained as equal between groups in steps. There was no result in deterioration of fit. In fact, aBIC generally improved across all steps, suggesting these steps achieved measurement invariance.
The small size of the indicators of noninvariance for Word Reasoning should be interpreted in light of the complexity of the model and strictness of the test. We concluded that the WISC-IV shows acceptable levels of invariance among factors between the normative and clinical groups. Differences in subtest scores on the WISC-IV are generally due to latent constructs, and the test is not biased by clinical state. Means of the four latent factors in the normative group were fixed to zero, and the nonstandardized latent means for VCI, PRI, WMI, and PSI in the clinical group were freely estimated as –2.15, –1.98, –2.32, and –3.02, respectively. This finding suggests, not surprisingly, that the clinical group scored lower on average on the underlying first-order factors than did the normative sample. Error variances for Word Reasoning subtest for normative and clinical children were estimated as .42 and .30, respectively. The error variance for the clinical group was slightly lower, suggesting that the communality of Word Reasoning was higher for clinical children.
Invariance Between Normative and Clinical Samples in the Validated Five-Factor Model
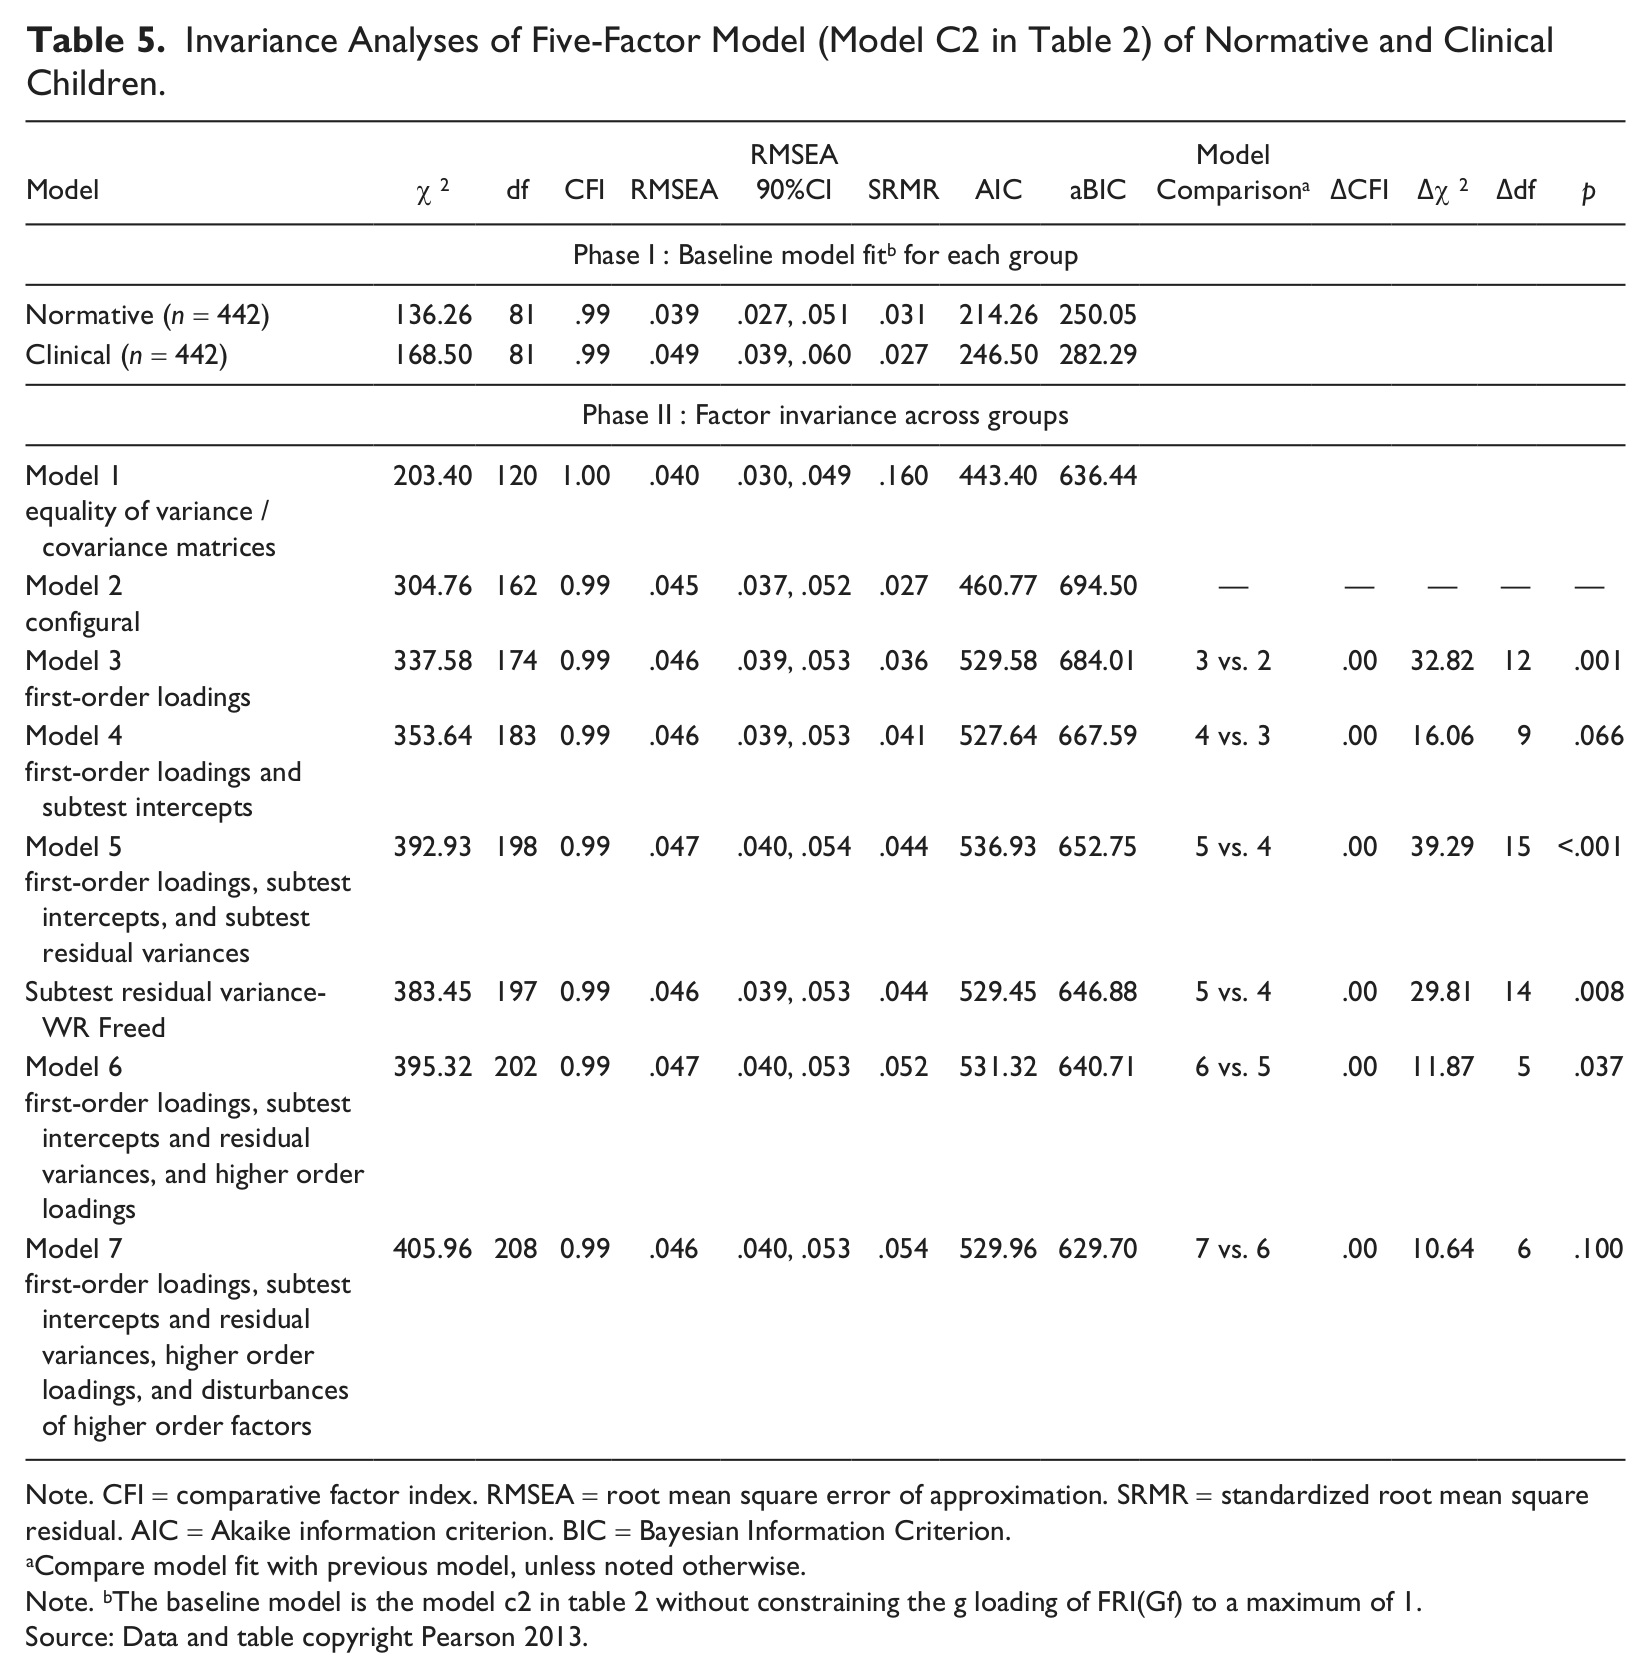
Following a similar procedure, factorial invariance of the final validated five-factor model (Model C2 in Table 2) was assessed. Fits of the various models are shown in Table 5. Evaluation of various indices, such as ΔCFI and aBIC, generally supported full measurement invariance. The five-factor model demonstrated good levels of factorial invariance between normative and clinical children. 2 When the more strict Δχ2 criterion was considered, only one parameter was revealed as slightly noninvariant: the Word Reasoning error variance was freely estimated as .42 and .30 for the normative and clinical samples, respectively. Again, the clinical group was slightly lower on this error variance, model specified latent factors explained more WR variance for clinical children.
Invariance Analyses of Five-Factor Model (Model C2 in Table 2) of Normative and Clinical Children.
Note. CFI = comparative factor index. RMSEA = root mean square error of approximation. SRMR = standardized root mean square residual. AIC = Akaike information criterion. BIC = Bayesian Information Criterion.
Compare model fit with previous model, unless noted otherwise.
Note. bThe baseline model is the model c2 in table 2 without constraining the g loading of FRI(Gf) to a maximum of 1.
Source: Data and table copyright Pearson 2013.
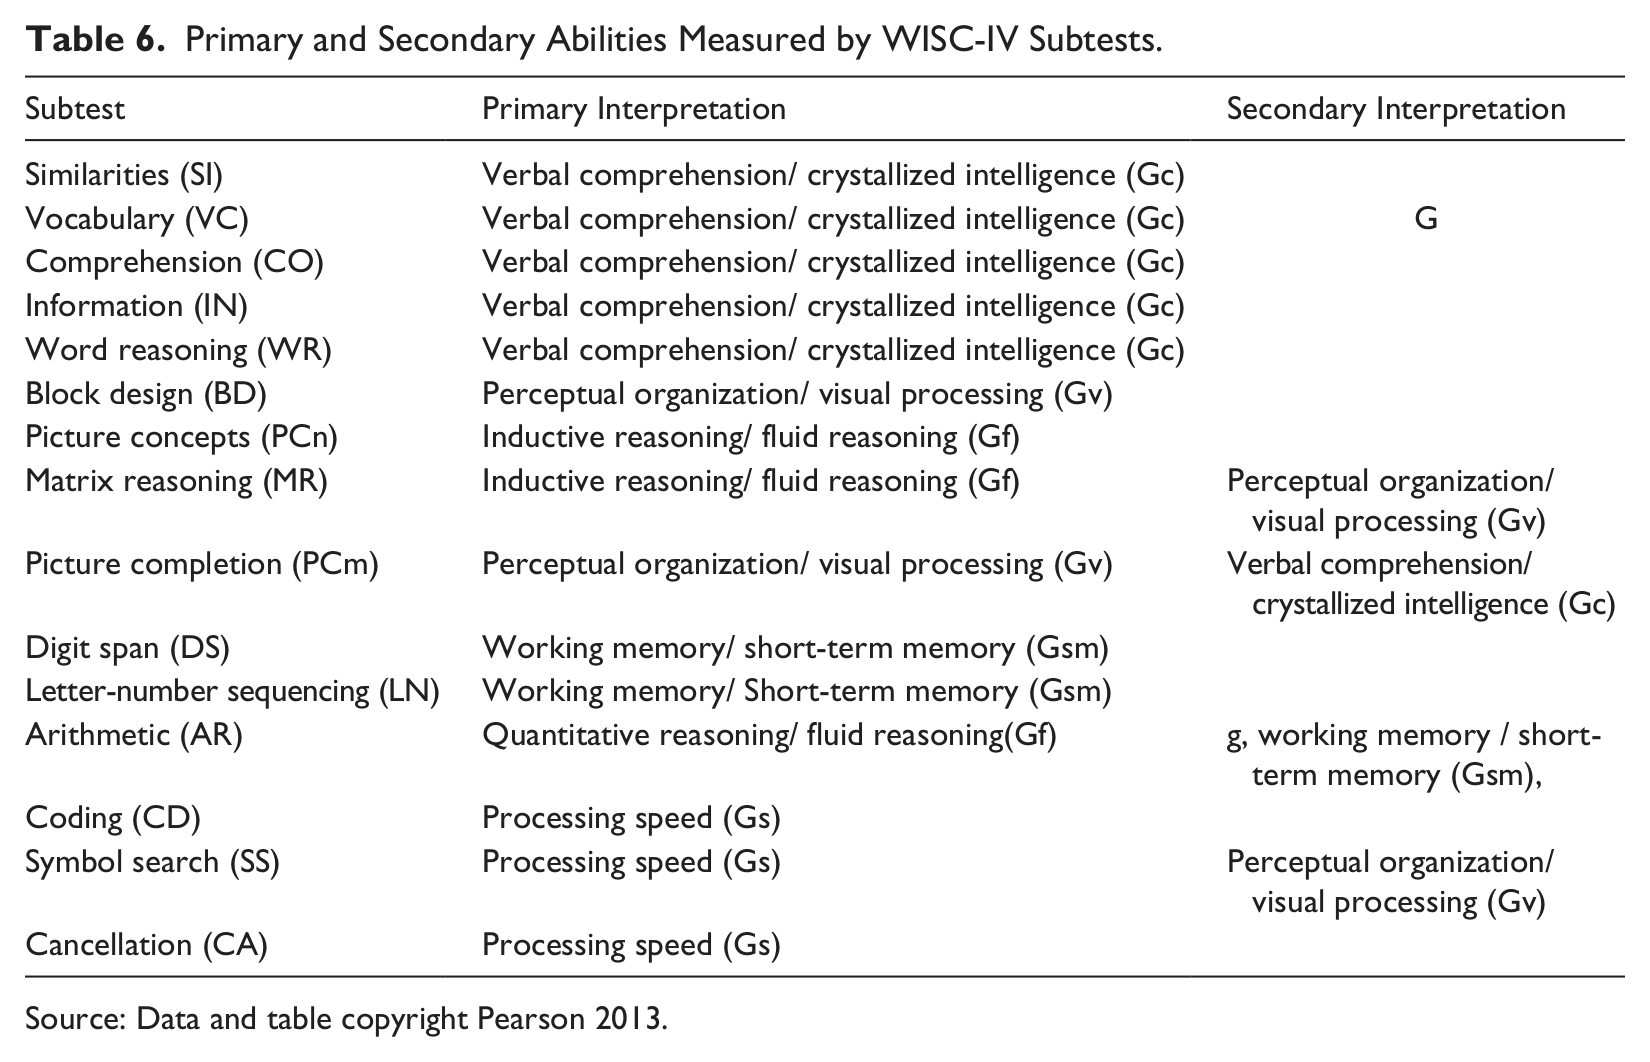
Likely primary and secondary interpretations of each WISC-IV subtest are shown in Table 6 based on the pattern of factor loadings observed.
Primary and Secondary Abilities Measured by WISC-IV Subtests.
Source: Data and table copyright Pearson 2013.
Discussion
This study was designed to help understand the constructs measured by WISC-IV and to determine the consistency of measurement for these constructs across large normative and clinical samples. This study is important because it is the first study to evaluate the clinical validity of an alternative five-factor measurement model for the WISC-IV. The 4 factor interpretive approach is the model published with the test’s technical manual (Wechsler, 2003). The alternative model reorganized the 15 WISC-IV subtests into five factors with the additional factor labeled fluid reasoning, which consists of the Arithmetic subtest and two inductive reasoning measures, Matrix Reasoning and Picture Concepts.
The first major set of findings in this study is that both four and five-factor models fit the data well and provide meaningful strategies for interpreting WISC-IV scores. Fit statistics were within the ideal range for both models. Comparatively, when no cross-loadings were specified, the four-factor model fit slightly better. In contrast, when cross-loadings were allowed, recognizing the complexity of some of the subtests, the five-factor model showed a slightly better fit, providing psychometric support for separating the WISC-IV PRI into two composites as follows: POI(Gv) consisting of Block Design and Picture Completion; and FRI(Gf) consisting Matrix Reasoning, Picture Concepts, and Arithmetic. Our results are consistent with previous studies by Keith et al. (2006), and Chen et al. (2009) in supporting an alternative five-factor model, but we did not find evidence of clear superiority for one model over another.
The second and most important set of finding is that both four- and five-factor models derived from the normative data provide a good fit to the clinical data. Invariance analyses supported invariance of both models across normative and clinical groups. The WISC-IV 15 subtests demonstrated the same underlying theoretical latent constructs, strength of relations among factors and subtests, validity of each of the first-order factors, and the same subtest intercepts and communalities regardless of clinical status. Thus, each model demonstrated nearly full factorial invariance between clinical and nonclinical samples. This means that whichever model is used, the WISC-IV subtests have the same meaning regardless of clinical status.
The clinical sample showed slightly lower error variance on the optional Word Reasoning subtest in both the four- and five-factor models. Although strict criterion identified this subtest’s error variances as noninvariant in the clinical sample, the small magnitude of the differences identified, around .10 of the total variance, likely has little clinical meaning given model complexity and the strictness of parameter constraints, and does not jeopardize overall WISC-IV clinical invariance. Compared to the normative children, a slightly higher percentage of the Word Reasoning variance could be explained by g and by a verbal comprehension factor (Gc) for children in the clinical sample. 3
A third set of major findings concerns clarification of multiple abilities required by some subtests as evidenced by cross-loadings on more than one factor, and confirmation of subtest g loadings. As expected, the Arithmetic, Matrix Reasoning, Picture Completion, and Symbol Search subtests measured multiple abilities. Arithmetic, Vocabulary and Information had the highest g loadings. Cancellation had the lowest g loading.
The Arithmetic subtest likely requires examinees to integrate a complex mix of abilities in both child (Chen et al., 2009; Keith et al., 2006) and adult populations (Benson et al., 2010; Bowden, Saklofske, & Weiss, 2011; Bowden, Weiss, Holdnack, & Lloyd, 2006; Lichtenberger & Kaufman, 2009; Ward et al., 2011). In this study, Arithmetic mainly measured working memory (.59), with some perceptual reasoning (.24) in the four-factor model. In the five-factor model, Arithmetic loaded mainly on the fluid reasoning factor (.79). These results are consistent with previous research with WISC-IV (Keith, et. al, 2006; Chen, et. al, 2009) and WAIS-IV (Benson, et. al., 2010; Weiss, et. al., 2013). These findings are also consistent with current research into the theoretical structure of intelligence which documents considerable shared variance between working memory and fluid reasoning (Conway, Cowan, Bunting, Therriault, & Minkoff, 2002; de Jong & Das-Smaal, 1995; Engle, Tuholski, Laughlin, & Conway, 1999; Fry & Hale, 1996, 2000; Kane, Hambrick, & Conway, 2005). Specifically, the cognitive control mechanisms involved in working memory have been identified as the source of the link between working memory and fluid intelligence (Engel de Abreu, Conway, & Gathercole, 2010). This potentially explains the cross-loading of the Arithmetic subtest on the WMI(Gsm) and PRI in the four-factor solution, and the movement of Arithmetic from the WMI (Gsm) to the FRI (Gf) factor in the five-factor solution. It seems plausible that one reason that Arithmetic loads on fluid reasoning and is such a strong measure of g is that performing multiple, sequential mental arithmetic calculations while keeping the word problem in mind invokes the executive functions to integrate multiple cognitive abilities for successful completion of the task in a timely manner (Weiss, et. al., 2010; Weiss, Saklofske, Schwartz, Prifitera, & Courville, 2006). As a complex task that appears to require executive integration of multiple abilities, Arithmetic is among the best measures of g in the battery.
At the same time, however, the numerical content of the Arithmetic subtest and its high correlation with mathematics achievement (Wechsler, 2003) are difficult to ignore. The numerical stimuli of the Arithmetic task logically invoke interpretations based partly on quantitative reasoning (RQ), which is considered a narrow ability under fluid reasoning in the CHC model of intelligence (Carroll, 1993; see Keith & Reynolds, 2012, pp. 793-795 for a test of the RQ-Gf hypothesis). Lecerf et al. (2010) proposed that Arithmetic best fit as a stand-alone factor they termed quantitative reasoning in a six-factor model of the French WISC-IV. With the addition of the new Figure Weights subtest in the WAIS-IV, designed as a measure of quantitative and analogical reasoning, several researchers have observed correlated errors between Arithmetic and Figure Weights and identified these subtest as forming a residual factor or narrow ability subsumed under fluid reasoning (Benson, et. al., 2010; Ward, et. al., 2011; Weiss, et. al., 2013). It is presently unclear if this finding is due to the additional quantitative marker subtest (Figure Weights) present in WAIS-IV but not WISC-IV, or a cognitive developmental trend specific to adults. Further research is needed including additional marker variables of quantitative reasoning for children to clarify the meaning of the fifth factor in WISC-IV. Such research could also include markers for quantitative knowledge/achievement (Gq), given research that suggests that this is also a component of successful performance on the WISC-III Arithmetic subtest (Phelps et al., 2005).
Three other subtests, Picture Completion, Matrix Reasoning, and Symbol Search measured mixed abilities. These results were also observed by Keith et al. (2006). In the five-factor model, Picture Completion measured mainly perceptual organization (Gv)(.40) and some verbal comprehension (Gc) (.32). In this subtest, the examinee is asked to view a picture and then point to or name the important part missing within a specified time limit. Based on the response processes required by this task, it seems reasonable for this subtest to involve visual processing and some verbal mediating abilities, as well as the narrow ability of general verbal information. Matrix Reasoning loaded on the PRI in the four-factor model. In the five-factor model, Matrix Reasoning measured both inductive reasoning under FRI(Gf) and POI(Gv) (factor loadings were .48 and .32, respectively). If Matrix Reasoning indeed requires both inductive reasoning and visual processing, it makes sense for it to show cross-loadings when such factors are separated, but a single loading on a combined factor. Symbol Search loaded on the PSI and PRI in the four-factor model. In the five-factor model, it measured both PSI(Gs) and POI(Gv) (factor loadings were .54 and .29, respectively). These results were also sensible in terms of the known response processes.
The finding that some subtests cross-load on more than one factor does not necessarily indicate lack of content validity for tasks in an intelligence test. Cognitive abilities are interrelated in nature (Weiss, et. al., 2006). Moreover, data from Figures 1 and 2 show that for every subtest the factor loading for each main ability was clearly higher than its loading for the secondary abilities. The point of the discussion regarding cross-loadings is to clarify the constructs measured by the subtests relative to the factors so as to inform clinical interpretation of unusual patient profiles. Proposed interpretive hypotheses for each subtest based on its primary and secondary factor loadings are shown in Table 6 above. Given consistent subtest scores within indexes, the column labeled “primary interpretation” is probably the best interpretation of constructs measured by each subtest. When inconsistencies are found, or when examiners wish to test specific hypotheses, the abilities listed in the column “secondary interpretation” may be worth considering.
Our findings have applied implications for interpretation of WISC-IV results. Acceptability of the four- and five-factor models in both the normative and clinical samples suggests that these are useful and complementary models for interpreting WISC-IV findings. For children with consistent subtest scores within each of the four WISC-IV composites, the current four WISC-IV Index scores constitute an appropriate level of interpretation. For children with discrepant subtest scores within some of the four composites the five-factor model suggests a likely interpretive reorganization. For those children who present subtest scatter within the PRI or WMI composite, our findings suggest that a common pattern may be consistencies between POI(Gv) subtests (i.e., Block Design and Picture Completion), and between FRI(Gf) subtests (i.e., Matrix Reasoning, Picture Concepts, and Arithmetic)—but inconsistencies across these two factors. Practitioners might also evaluate inconsistencies among the FRI(Gf) subtests in which Arithmetic scores may differ from Matrix Reasoning and Picture Concepts and consider the possibility of specific strengths or weaknesses in quantitative versus inductive reasoning. Furthermore, our data suggest that this interpretative approach should be equally applicable for examinees from the general school age population and those with psychoeducational or clinical conditions.
As Prifitera, Weiss, Saklofske, and Rolfhus (2005) suggested, while factor analysis is a useful tool for informing the best way to interpret relations among subtests, clinical utility should always be considered when selecting factors. Accumulating and balancing validity evidence from psychometric and clinical perspectives should continue.
The choice of four- or five-factor models is somewhat controversial in the Wechsler literature. For example, based on the US adult data, Keith reported that “The WAIS-IV four-factor structure fits better than the CHC model when Arithmetic is excluded” (Lichtenberger & Kaufman, 2009, p. 32). Chen et al. (2009) also reported the superiority of the five-factor model over the four-factor model is somewhat less salient in a population of Asian children: “Taiwanese children revealed more strongly correlated fluid reasoning and visual-spatial processing factors than do American children. The correlation between visual-spatial processing and working memory was also higher (Chen et al., 2009. p. 100)”. Comparing current results to related work based on the U.S. adult data (Weiss, Keith, Zhu, and Chen, 2012), it seems that the model-data fit discrepancies between four- and five-factor models were smaller for the child population. Therefore, many others variables, such as culture, age, and subtest combination, should be considered when studying factor structures.
The recent literature concerning a possible fifth Wechsler factor has sometimes been cast as a contest between the Wechsler and CHC models of intelligence (Benson, et. al, 2010; Ward, et. al., 2011). However, adding working memory and processing speed factors to the original two-factor Wechsler model has been a systematic research goal for the Wechsler test development team which began with the third editions and was fully implemented in the fourth editions (Weiss, et. al., 2006; Weiss, et. al, 2010). Similarly, adding a fluid reasoning factor to the Wechsler model has been a systematic research goal since 1997 with the addition of Matrix Reasoning to the WAIS-III; the addition of Picture Concepts and Matrix Reasoning to the WISC-IV; the addition of Figure Weights to the WAIS-IV; and the modifications made to force Arithmetic to pull more for working memory and fluid reasoning than numerical skill (i.e., less complex arithmetic calculations but with more sequential steps to process) in both WISC-IV and WAIS-IV. While the psychometric fit of the third and fourth editions of the Wechsler series to a four-factor model has been well established for decades, the continuous evolution of the Wechsler scales has been guided less by CHC-related factor analytic findings and more by ongoing clinical research in neuropsychology and cognitive information processing as discussed above. The good news for our science is that independent research labs have derived surprisingly similar models of intelligence based on different lines of research, and this is ultimately confirming of the progress the field is making in better understanding the nature of intellectual functioning.
Footnotes
Declaration of Conflicting Interests
Drs. Weiss, Zhu, and Chen were involved in the research and development of the WAIS-IV and WISC-IV as employees of Pearson, which is the publisher of numerous psychological tests including the Wechsler scales.
Funding
The authors received no financial support for the research, authorship, and/or publication of this article.