
Abstract
The influential Common Core State Standards for Mathematics (CCSSM) expect students to start statistics learning during middle grades. Thus teacher education and professional development programs are advised to help preservice and in-service teachers increase their knowledge and confidence to teach statistics. Although existing self-efficacy instruments used in statistics education focus on students, the Self-Efficacy to Teach Statistics (SETS) instrument measures a teacher’s efficacy to teach key CCSSM statistical topics. Using the results from a sample of n = 309 participants enrolled in a mathematics education or introductory statistics course, SETS scores were validated for use with middle grades preservice teachers to differentiate levels of self-efficacy to teach statistics. Confirmatory factor analysis using the Multidimensional Random Coefficient Multinomial Logit Model supports the use of two dimensions, which exhibit adequate reliabilities and correspond to the first two levels of the Guidelines for Assessment and Instruction in Statistics Education adopted by the American Statistical Association. Item and rating scale analyses indicate that the items and the six-category scale perform as intended. These indicators suggest that the SETS instrument may be appropriate for measuring preservice teacher levels of self-efficacy to teach statistics.
Keywords
Central to teacher beliefs and attitudes is teacher efficacy (Gresham, 2008; Smith, 1996)—a teacher’s “belief that they have the skills to bring about student learning” (Ashton, 1985, p. 142). In general, teacher efficacy affects teacher motivation, willingness to use more innovative techniques, student achievement, and time spent teaching certain concepts (Czerniak & Chiarelott, 1990; Riggs & Enochs, 1990; Wenta, 2000). Research about teacher efficacy in mathematics and science also indicates that levels of teacher efficacy are related to teachers’ content knowledge, pedagogical content knowledge, and beliefs and attitudes regarding content (Çakıroğlu, 2000; Gresham, 2008; Huinker & Madison, 1997; Swars, 2005; Wenta, 2000). Teacher efficacy forms before the teacher enters the classroom (Smith, 1996) and is then hard to change (Woolfolk Hoy & Burke-Spero, 2005).
Several instruments measure teaching efficacy. The Teachers’ Sense of Efficacy Scale (TSES; Tschannen-Moran & Woolfolk Hoy, 2001) is used to examine teacher efficacy regarding classroom management, student engagement, and use of instructional technologies. The Science Teaching Efficacy Beliefs Instrument (STEBI; Riggs & Enochs, 1990) measures preservice teacher efficacy to teach science. Similarly, the Mathematics Teaching Efficacy Beliefs Instrument (MTEBI; Enochs, Smith, & Huinker, 2000) identifies preservice teachers with high and low mathematics teaching efficacy. Such instruments can examine the effect of teacher efficacy on other variables related to teaching effectiveness. Giving the MTEBI and the Mathematics Anxiety Rating Scale (MARS) to 156 preservice teachers and interviewing 20 of them, Gresham (2008) found preservice teachers’ beliefs about their ability to teach mathematics effectively is affected by their attitudes toward mathematics.
Statistics education research is still a relatively new discipline. Zieffler et al. (2011) note that the lone journal, whose primary focus is statistics education research, started in 2002. The few researchers who have studied self-efficacy in statistics have focused on students, not teachers. Finney and Schraw (2003) developed two student measures: Current Statistics Self-Efficacy (CSSE) and Self-Efficacy to Learn Statistics (SELS). The instruments aimed to examine the relationship between statistics self-efficacy and performance, and provide a measure for growth in self-efficacy. The instruments were found to be positively related to each other as well as to mathematics efficacy and attitudes toward statistics. Both instruments are also positively correlated to two measures of statistics performance: overall course performance and performance on two 14-question exams measuring concepts relevant to CSSE and SELS items. Both instruments are negatively related to general test anxiety and statistics anxiety.
Recommendations from the National Council of Teachers of Mathematics (2000), the Guidelines for Assessment and Instruction in Statistics Education (GAISE; Franklin et al., 2007), and the Common Core State Standards for Mathematics (CCSSM; National Governors Association, 2010) have sparked research on teacher preparation as well as student and teacher attitudes toward the statistics concepts presented in GAISE and the revised pre-K-12 mathematics curriculum. This project focused on GAISE Levels A and B (but not on C): “Although these three levels may parallel grade levels, they are based on development in statistical literacy, not age” (Franklin et al., 2007, p. 13). In Franklin et al. (2007), the three levels lack explicit concise definition, but characteristics in their Table 1 suggests this description: “Level A” is the most concrete level; students generally focus on teacher-provided questions answerable by a census of their own classroom, without comparing groups and without generalization beyond the classroom. “Level B” starts to include questions that are posed by students and that acknowledge random selection, sampling variability, and between-group differences. “Level C” is the most advanced level; students pose their own questions that seek generalization, utilize designs such as randomized experiments, use distributions, and quantify sampling error or association.
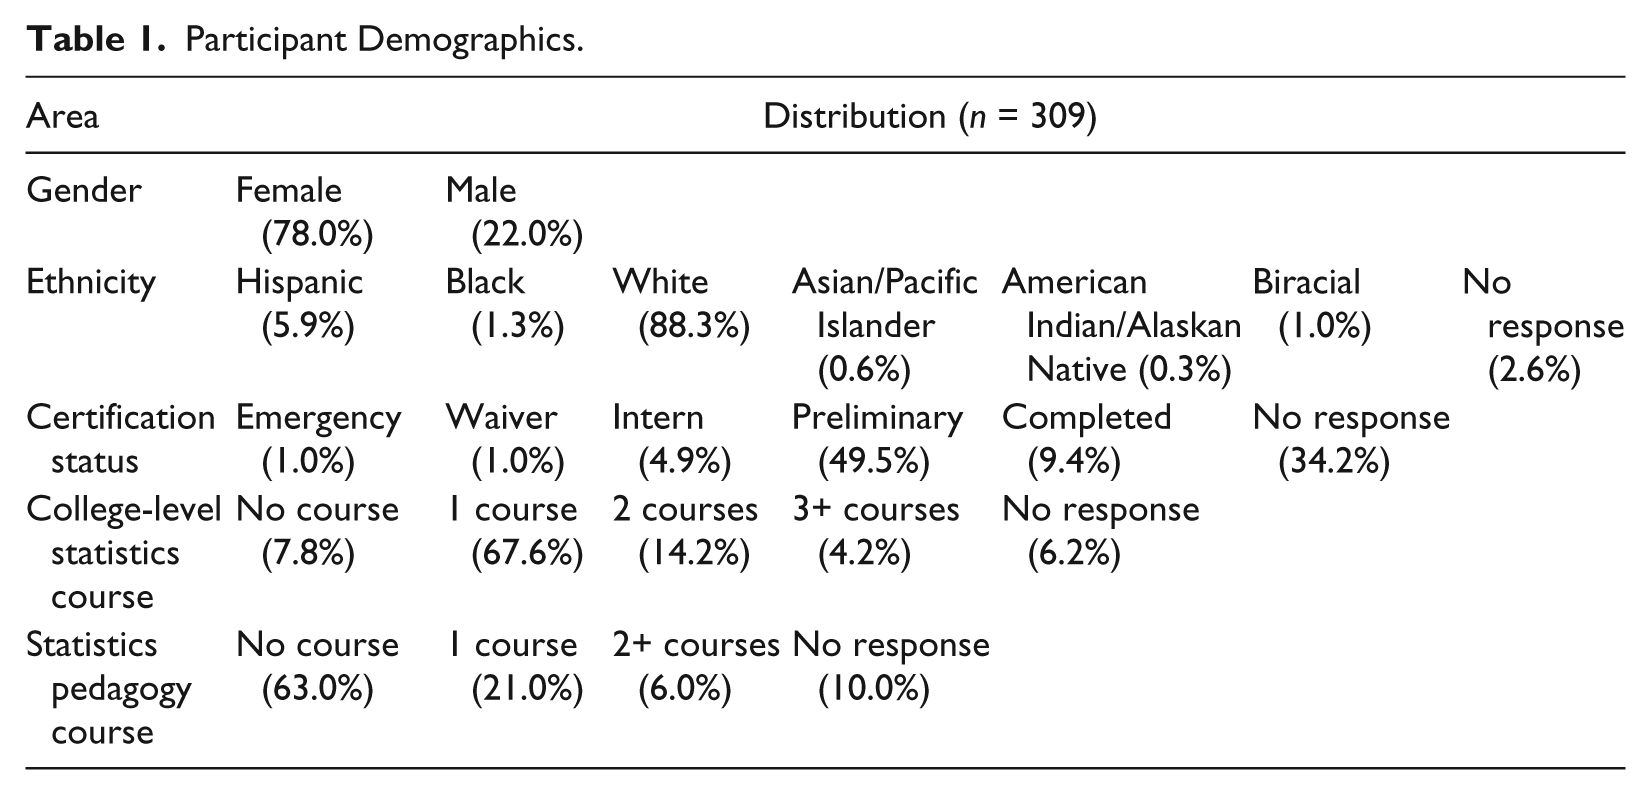
Participant Demographics.
Teacher self-efficacy to teach statistics is a potentially more complex construct than in mathematics or science education because K-8 teachers of statistics generally graduate mathematics or mathematics education programs rather than statistics programs. However, as state-mandated standards incorporate statistics and probability into K-8 mathematics curricula, exploring teacher efficacy to teach statistics gains importance. In one of the few studies of preservice teacher self-efficacy toward statistics, Lancaster (2008) administered five questionnaires to preservice teachers in a mathematics content course and in its prerequisite mathematics content course. The questionnaires measured general attitudes toward statistics, self-efficacy toward current ability to perform statistics, statistical reasoning, attitudes toward the pursuit of continuing professional development in statistics, and current self-efficacy to learn statistics. Primary conclusions were (a) preservice elementary teachers’ self-efficacy to learn statistics in the future (e.g., through professional development) may affect their attitudes regarding the potential impact of professional development in statistics on the improvement of their teaching, and (b) self-efficacy toward statistics and attitudes about their current statistics course may affect their self-efficacy to learn statistics.
Research is needed to determine which factors or experiences increase statistics teaching efficacy. The aforementioned instruments (TSES, STEBI, MTEBI, CSSE, and SELS) measure various types of self-efficacy, but not a teacher’s efficacy to teach statistics concepts that appear in the GAISE or CCSSM. This article’s authors therefore developed the Self-Efficacy to Teach Statistics (SETS) instrument to align with mathematics standards and to measure preservice middle school teachers’ self-efficacy to teach topics at pre-K-12 GAISE Levels A and B. This article presents validity results for the SETS instrument.
Method
Participants
This study was conducted in four different large-sized public institutions of higher education with teacher education programs. Two institutions are located in the Midwest United States with the other two in the south-central United States. The sample consisted of n = 309 preservice teachers enrolled in a mathematics education or introductory statistics course. As institutions do not always offer a statistics course taken only by preservice teachers, participants were recruited from a variety of courses, including mathematics courses taken only by preservice elementary and/or middle grades teachers (e.g., number sense, geometry, algebra), probability and statistics, as well as other courses required in teacher education programs, such as history of mathematics. As such, the preservice teachers were at various stages in their teacher preparation program (see Table 1). Some preservice teachers provided inconsistent or nonstandard grade band intervals to describe their (intended) certifications, but 83.5% reported an interval including one or more of the middle grades (i.e., 5-9), and 11.3% did not respond. Of the 88.7% who responded to this item, 94.2% reported an interval including one or more of the middle grades years. Table 1 summarizes participants’ backgrounds.
The Self-Efficacy to Teach Statistics (SETS) Instrument
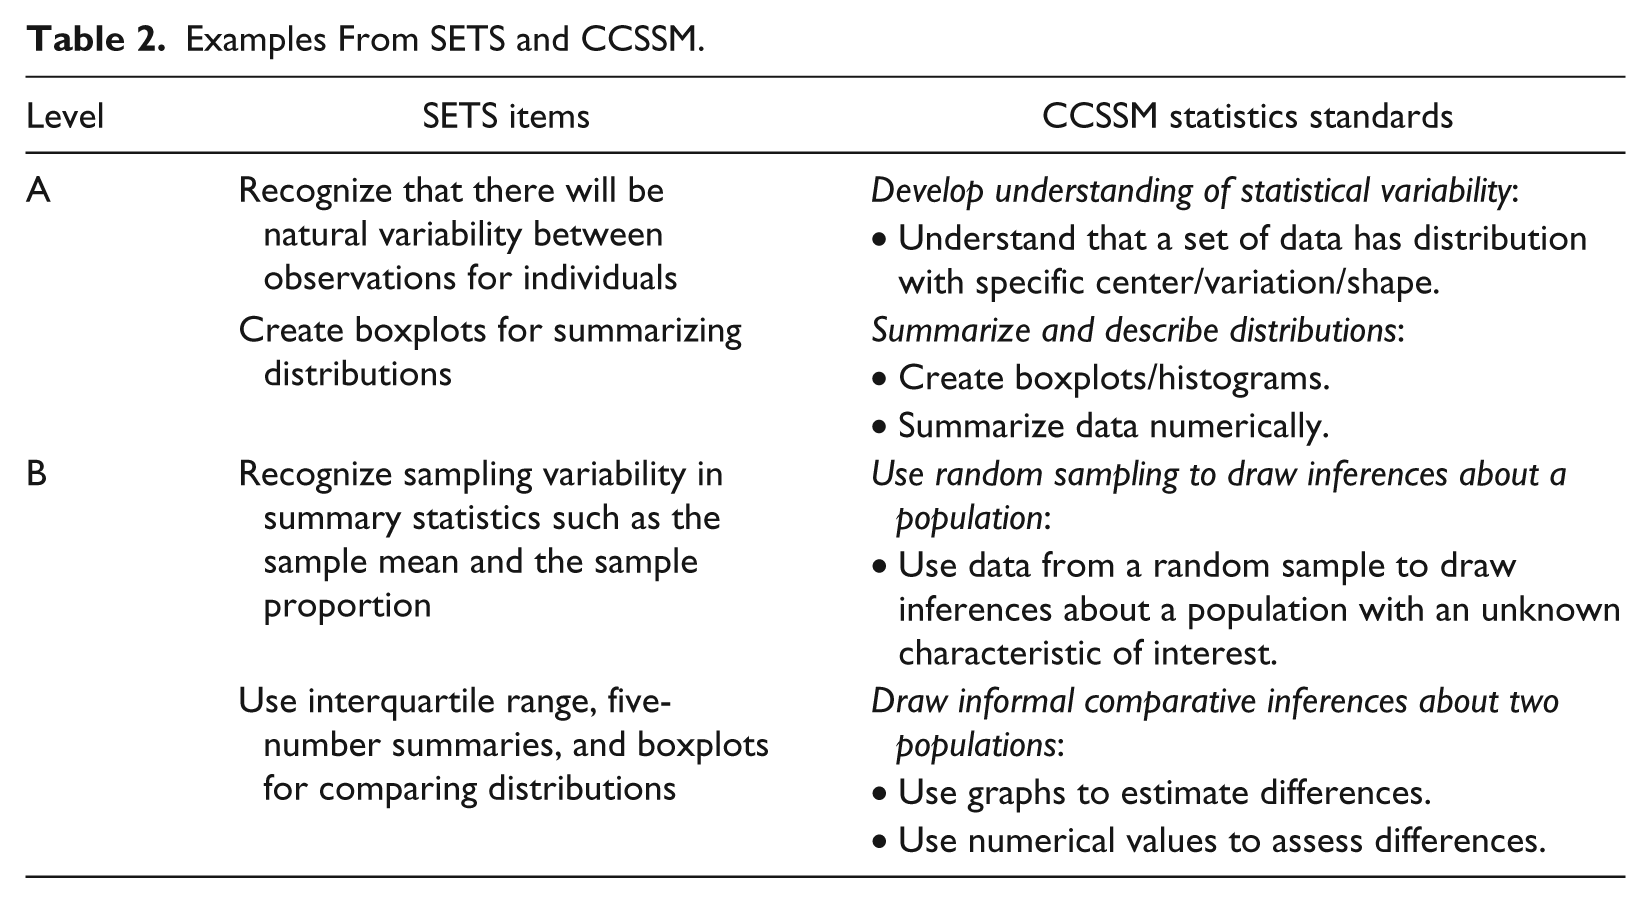
The SETS instrument aims to measure levels of self-efficacy to teach statistics, based on the pre-K-12 GAISE report and state standards for teacher knowledge and student learning outcomes that have specific statistics requirements, such as the CCSSM. Groth and Bargagliotti (2012) explore the complementary nature of GAISE and CCSSM. After 15 demographic questions, the SETS instrument consists of 11 items corresponding to GAISE Level A and 15 items to Level B. The instrument has respondents rate their confidence in teaching [specific statistics concepts to] middle school students using a 6-point scale in which higher values correspond to higher confidence. Table 2 presents examples from the SETS and the associated CCSSM Statistics Standard. A response of “confident” (the scale’s 4th point) for every item yields a Level A subscore of 44 (of 66) and Level B subscore of 60 (of 90).
Examples From SETS and CCSSM.
Unlike a Structural Equation Modeling (SEM) or Item Response Theory (IRT) framework, which approaches measurement by finding the best model to fit the data, the Rasch framework used focuses on a data generation process that conforms to a specific measurement model. The analysis stage emphasizes exposing data anomalies, not comparing model fit (Andrich, 2004a, 2004b).
Following Wolfe and Smith (2007a), the purpose and frame of reference for the instrument was identified. State mathematics standards for teacher and student statistics content knowledge were obtained from each state’s department of education website and reviewed in conjunction with the items described in GAISE Levels A and B to identify representative behaviors that the SETS instrument would measure. A polytomous scoring model with a 6-point scale was selected to align with SELS and CSSE. To measure two levels of efficacy, the Multidimensional Random Coefficient Multinomial Logit Model, a multidimensional Rasch model, was selected as the scaling model (Adams, Wilson, & Wang, 1997; Briggs & Wilson, 2003).
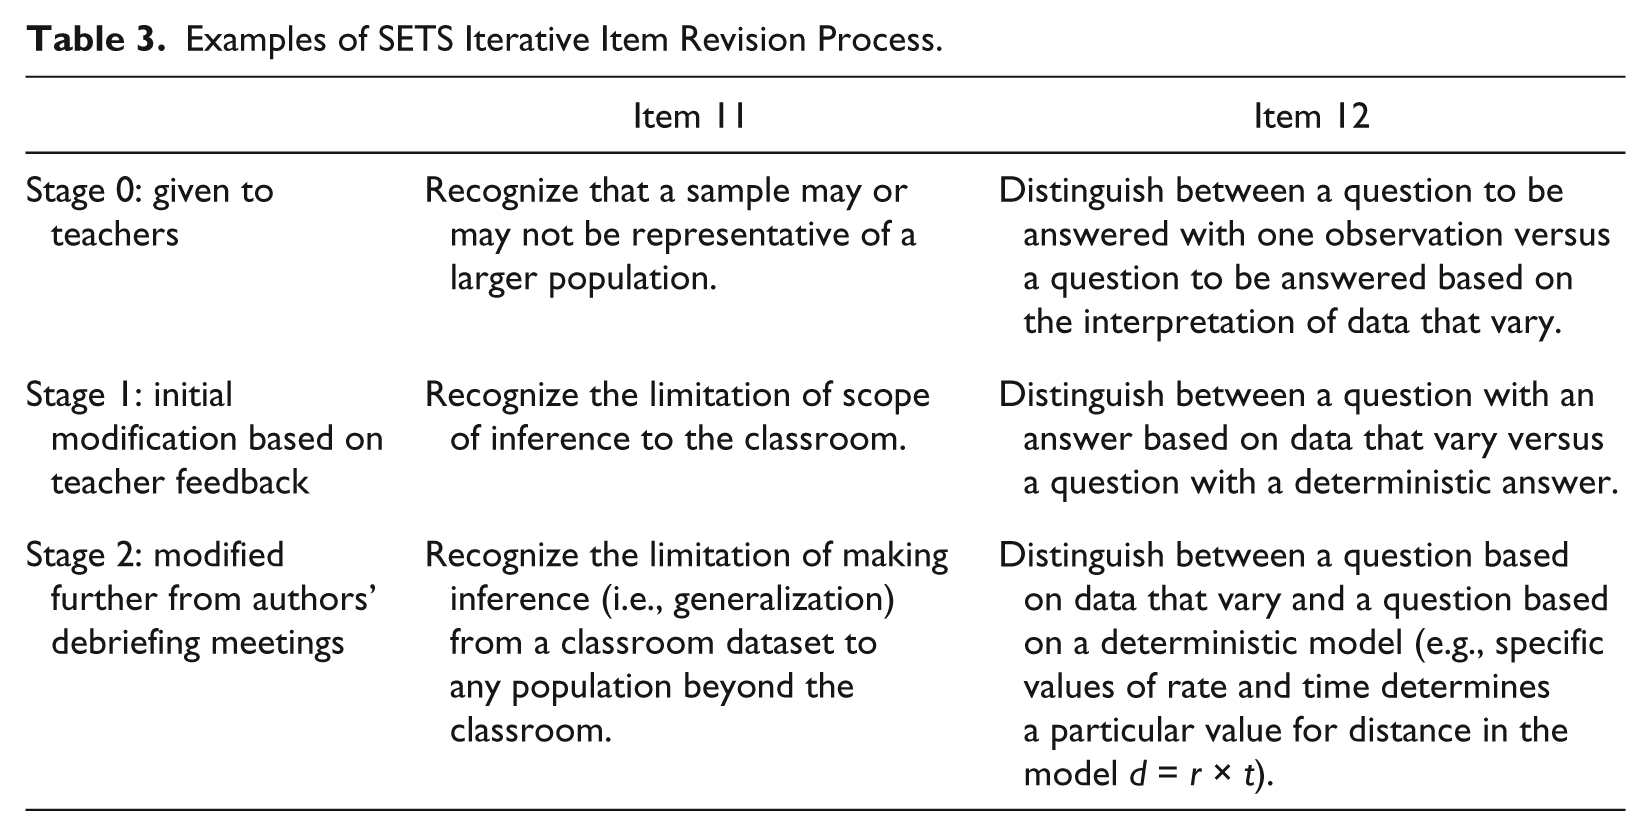
The item-writing process started in spring 2008. Comments on the item wording were solicited from 12 in-service middle and elementary school teachers enrolled in a mathematics specialist K-8 graduate program at a mid-Atlantic state university. Teaching experience ranged from 2 to 19 years, with a median of 6. About an hour of time was granted during a weekly class meeting taught by the coordinator of the specialist program for teachers to complete the instrument and provide anonymous written comments or suggested changes about item wording. Table 3 illustrates the iterative process of item revision that was completed in fall 2008.
Examples of SETS Iterative Item Revision Process.
In spring 2009, the revised instrument was piloted with 23 middle grades preservice teachers and 21 noneducation majors at a doctorate-granting public university in the south-central United States for the basis of an informal exploration of response category usage and item hierarchy. Participants were undergraduates in two sections of an introductory statistics course required for future middle school teachers and other majors such as psychology, biochemistry, industrial technology, and nursing. To explore variability in teaching efficacy levels, stacked bar graphs were generated for each item, showing the percentage of responses in each category level for the entire group as well as for just the education majors (Harrell, Pierce, Sorto, Murphy, & Lesser, 2009). Each of the six rating scale categories was used for each item. Furthermore, descriptive statistics for the items showed that respondents indicated higher efficacy for teaching statistical topics associated with Level A than with those at Level B, confirming the hierarchy intended in the items.
Analysis
Evidence from this study provides some support for validity of SETS measures to differentiate two levels of teachers’ self-efficacy to teach statistical concepts in middle grades. Using the language in Friel, Curcio, and Bright (2001), SETS items about graphical representations in Level A equate to “reading the data,” while Level B requires more advanced knowledge to “read between the data” (pp. 130-132). The SETS authors borrow this language to describe the two dimensions in terms of statistical thinking and reasoning. Continuing the Rasch framework into the confirmatory factor analysis (CFA), the data were scaled to the Multidimensional Random Coefficients Multinomial Logit Model (MRCMLM) with two correlated latent traits using the Rasch-based software Conquest (Wu, Adams, Wilson, & Heldane, 2007). The data were additionally scaled to a unidimensional rating scale model (Andrich, 1978; Rasch, 1960; Wright & Masters, 1982), modeling self-efficacy to teach statistics as a single latent trait. These two factor structures were the only ones compared in the CFA as they were the only theory-driven models for the instrument. Such a CFA decision would provide evidence for either supporting only a composite score from all items or supporting the reporting of two subscores.
Item and teacher parameters for both the factor structures were estimated in Conquest software. AIC (Akaike Information Criteria; Akaike, 1973, 1987) and BIC (Bayesian Information Criteria; Schwarz, 1978) were calculated for each structure. Traditional SEM-based fit indices were not calculated. Indices that require comparison to the null (or independence) model, such as the CFI or TLI, cannot be used in the Rasch-based CFA approach since Rasch model constraints preclude an independent model. With the Rasch emphasis on identifying anomalies, several analyses were conducted using Winsteps software (Linacre, 2011) to investigate potential issues with the rating scale as well as item and person fit. A rating scale analysis was performed using Linacre’s (2004) criteria. Using Messick’s (1995) validity evidence framework, evidence for content, substantive and structural aspects of validity are presented using the aforementioned analyses.
Results
Structural Evidence
Continuing with the Rasch framework, confirmatory factor analysis using the 2009-2010 data (n = 309) was conducted using Conquest. Both AIC and BIC were smaller for the two-dimensional model (AIC = 21541, BIC = 21558) than for the unidimensional model (AIC = 21765, BIC = 21780), thus supporting use of the two subscales in further analysis.
Substantive Evidence
Linacre’s criteria (Linacre, 2004) were used in evaluating the performance of the rating scale. These eight criteria are divided into two groups: “essential” and “helpful” (see last column, Table 4). The 6-point rating scale in the SETS instrument meets all four essential criteria. The Count column of Table 5 shows at least 10 observations for each response category and a unimodal distribution of frequencies. Because each category is being utilized and the distribution of the frequencies follows a bell-shaped curve, the pitfalls of low frequencies for a rating scale category or a bimodal distribution of frequencies do not affect model estimates. The average respondent measure associated with each category increases with the values of the rating scale categories (see Average θ column), indicating teachers with more efficacy overall respond with the higher categories. The unweighted mean-square fit statistics indicate how responses to each rating category match Rasch model expectations. These values are each less than 2.0, indicating a reasonable amount of randomness exhibited in the responses.
Linacre’s Criteria for Rating Scale Evaluation.

Rating Scale Category Structure.

Half of the four helpful, but nonessential, criteria were met. The category thresholds increase as categories increase (see Table 5), supporting the current ordering of the categories. For measure-to-category coherence, Categories 2, 3, and 4 are just below the 40% guideline. For category-to-measure coherence, Categories 1, 2, 3, and 6 exhibit less success than the 40% guideline, ranging from 14% to 35%. These category-to-measure coherence percentages indicate that Categories 2 and 3 (“Only a Little Confidence” and “Somewhat Confident”) may be too close in meaning for the respondents to differentiate between them as the model expects. For a 5-point rating scale, the difference in logits between the thresholds of adjacent categories should be at least .81 logits (Wolfe & Smith, 2007b). Although the SETS instrument uses a 6-point scale, the differences between the thresholds are compared to the 5-point criteria. The difference in the first and second thresholds (“Not at all confident” vs. “Only a little confident”) is only .45, while the difference between the remaining adjacent categories is at least .84. Table 5 shows results of the analysis using Linacre’s criteria.
Winsteps estimated the reliability of separation coefficients for the “Reading the Data” and “Reading Between the Data” subscales as .87 and .91, respectively. With subscales’ differing in numbers of items (11 vs. 15, respectively), this observed difference is expected. These estimates are analogous to Cronbach’s alpha, indicating very little measurement error in the scores. Since the estimates exceed .80, decisions based on the SETS scores could be used for either group-based or individual decisions. Conquest estimated the correlation between subscales as .85.
Content Evidence
The item development process itself provides evidence of content validity. The SETS items were derived from the GAISE and states’ standards for teacher and student knowledge of statistics. As previously described, the items were reviewed by in-service teachers enrolled in a K-8 mathematics specialist program to evaluate the wording of the items, which resulted in item revisions. During the final stages of the validation process for the SETS instrument, the CCSSM were released. Informal comparison of the SETS instrument and the CCSSM showed that the items aligned, which was unsurprising given that several GAISE authors helped to develop the CCSSM. Groth and Bargagliotti (2012) discuss connections between GAISE and CCSSM.
Both the item-measure correlations and mean square fit indices are used to evaluate the quality of the items and provide evidence of content validity (Wolfe & Smith, 2007b). The Fisher transformations of the point-polyserial correlations for each item, with the total from its subscale, are shown in the third column of Table 6. The direction and magnitude (all greater than .67) of these correlations indicate a strong, positive relationship between the polytomous item score and the subscale score based on the remaining items. The observed correlations are much greater than the minimum value (.40) suggested by Wolfe and Smith (2007b) for flagging polytomous items.
Item Quality Index Summary.
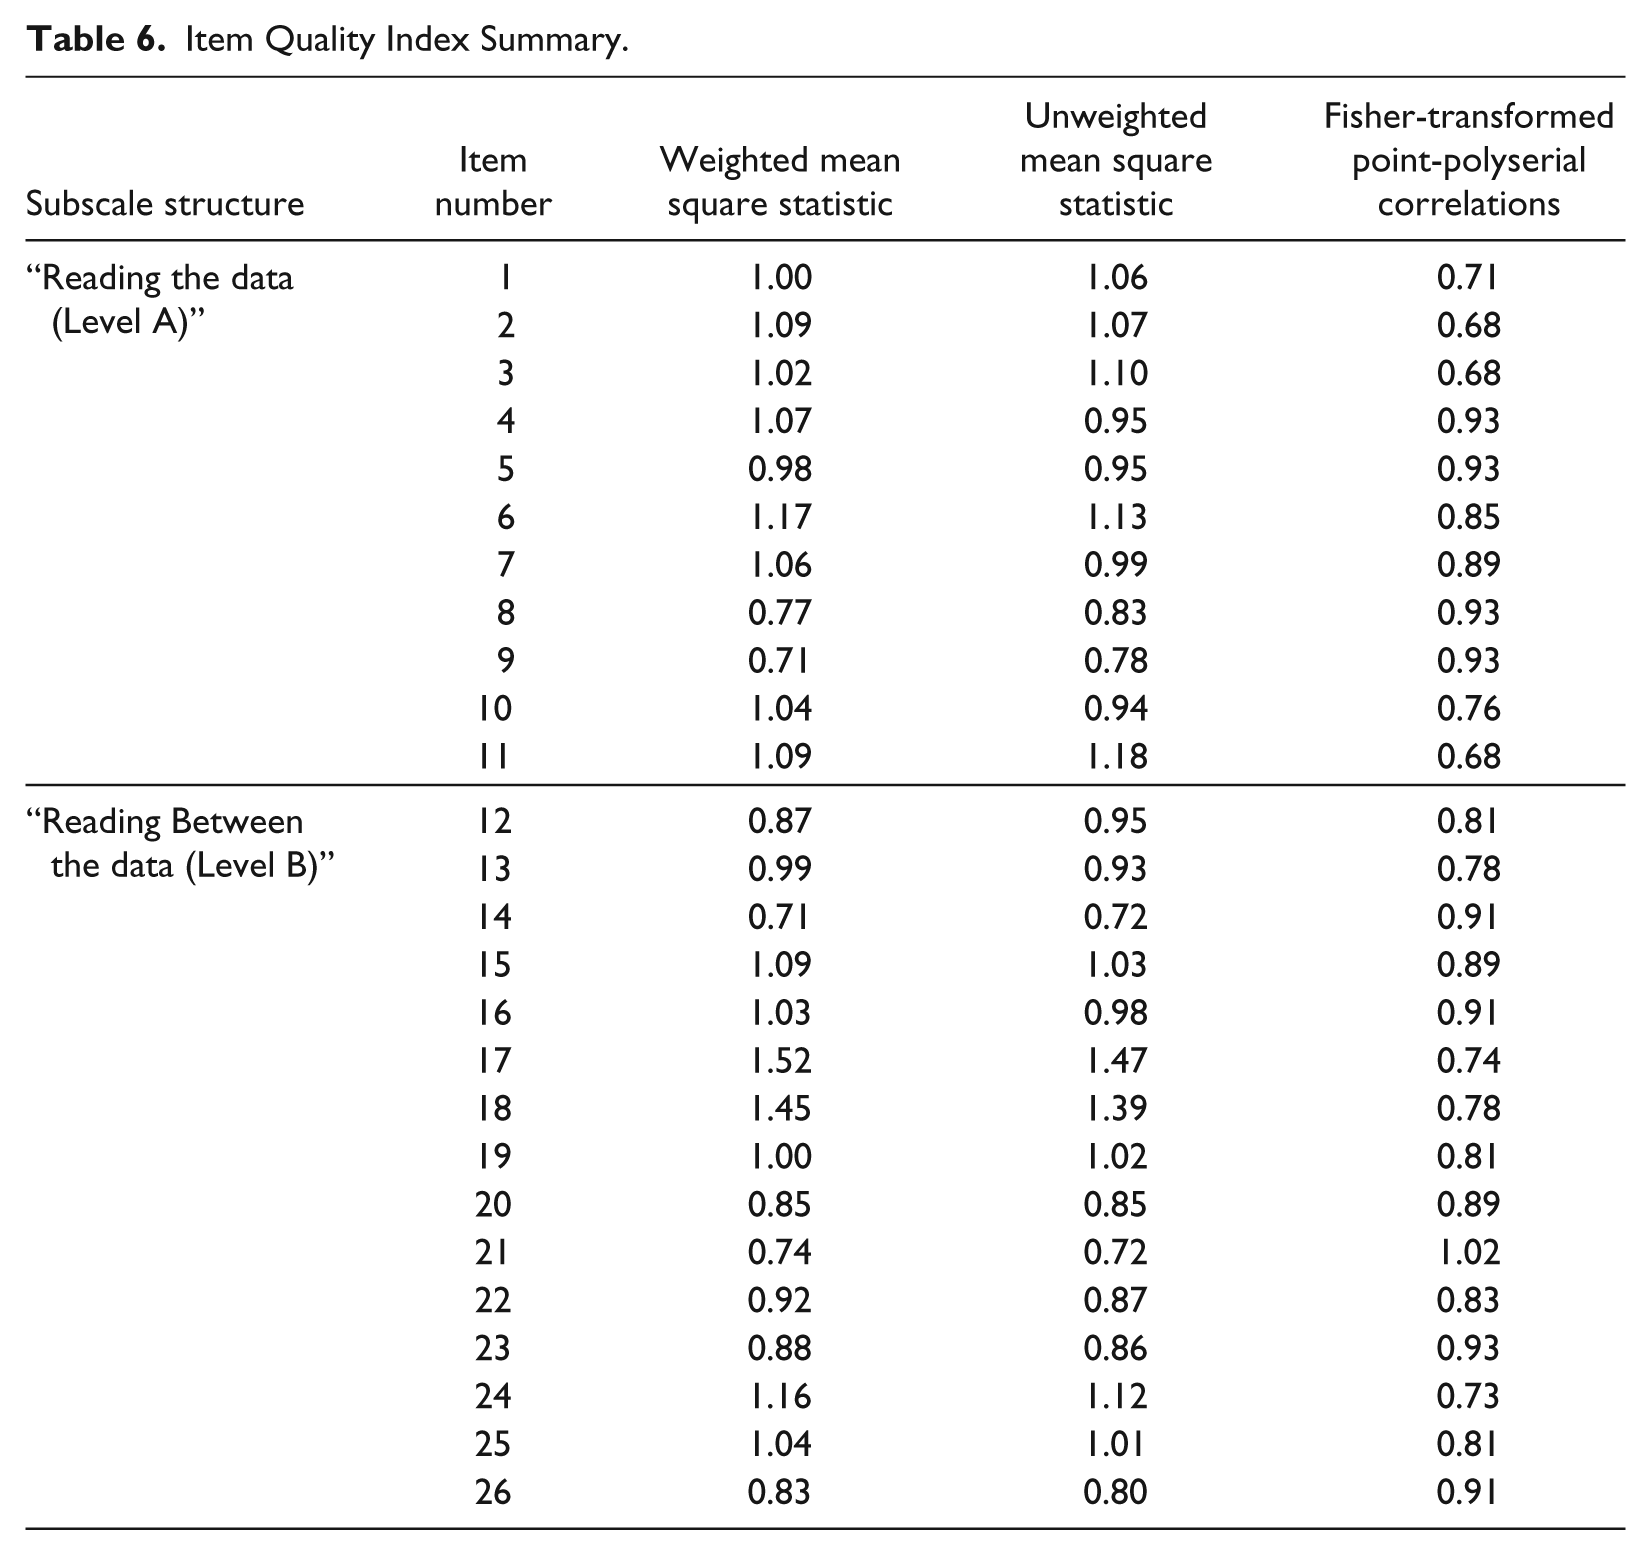
Winsteps-generated mean square fit indices for the items in each subscale are summarized in the last two columns of Table 6. The unweighted mean-square statistic (outfit) indicates items where unexpected responses are observed, but the responses are close to the respondent’s ability. Weighted mean-square statistic (infit) indicates items where unexpected responses are far from the respondent’s ability. The average for both fit indices was near 1, indicating that, on average, the observed responses differ from the expected responses by roughly the amount predicted by the Rasch model. For almost all items, the mean square statistic was within the acceptable range of 0.5 to 1.5 (Linacre, 2011). The exception is Item 18, whose Infit MNSQ of 1.52 exceeds the suggested 1.5 cutoff by a negligible amount. Based on the correlation and mean square values, there are no items that are flagged as problematic in terms of item quality.
Discussion
The analyses in this article provide structural, substantive, and content validity evidence for the SETS. Based on the CFA results, the SETS is a two-dimensional instrument, with subscales that differentiate “Reading the Data” from “Reading Between the Data.” The high reliability of separation values for the composite and subscales suggest internal consistency. Item-fit indices indicate that the items perform well. Rating scale analysis showed that the categories were used in their intended ways. The SETS instrument was validated for use with middle grades preservice teachers, with the intent to differentiate levels of self-efficacy to teach statistics.
From a measurement perspective, the results support using and reporting two separate subscales to represent levels of confidence to teach statistical concepts for which teachers are responsible. This aspect matters for researchers seeking to capture the variation of self-efficacy among preservice teachers to investigate the relationship between such measures and other variables (e.g., student achievement). For example, the evidence of multidimensionality in the instrument may inform the way researchers design coursework for future teachers or professional development models for in-service teachers. Instead of using one overall score, researchers could compare the effects of teacher growth on student achievement using the two subscales.
A limitation to consider is that teacher preparation programs vary across institutions and results might have been influenced unduly by the nature of the statistics and mathematics education courses at the participating institutions. Specifically, not all mathematics teacher preparation programs offer and/or require a course on teaching statistics. Additionally, it was not feasible to track the statistics content and statistics education backgrounds of the participants beyond the number of courses. It is possible that the participants did not have the opportunity to learn the content related to some of the items to which they were responding. For instance, a preservice teacher who completed only a mathematical statistics course may not have seen exploratory graphical tools such as boxplots. Furthermore, this article did not present evidence of external validity with other measures commonly associated with teacher development.
Evidence for generalizability or external validity was not provided in this study. Studies comparing preservice teachers early and near the completion of their teacher preparation program would contribute generalizability, while determining how the SETS correlates with other measures of self-efficacy, such as the SELS, CSSE, or MTEBI would provide evidence for external validity.
A delimitation is our focus on statistical thinking, not probability. Specifically, the GAISE pre-K-12 report (Franklin et al., 2007, pp. 8-9) says “probability is a tool for statistics” and “an intuitive grasp of probability will suffice at these [precollege] levels.” The focus of GAISE and the SETS instrument is the formulation of research questions, data collection, and analysis as well as the interpretation of results.
A potential use for the SETS instrument is indicating needs in professional development programs for in-service teachers. As initial validity evidence focused on preservice teachers with no or minimal teaching experience, future studies with other populations (e.g., new and experienced in-service teachers) are warranted. Participants may have based their responses only on their experience as learners of statistics, rather than as teachers of statistics. So they might believe a particular concept is hard to teach because it was hard for them to learn, while an in-service teacher might think a concept is hard to teach because she has tried several different teaching strategies with limited effectiveness. The authors are also conducting a validation study of a parallel instrument of items aligned with CCSSM and GAISE Level C to assess teacher self-efficacy to teach statistics in the high school grades.
Although not directly measuring teachers’ knowledge or classroom practices, the SETS instrument could serve as a dependent variable (pretest/posttest) to inform professional development and teacher preparation programs without having to rely on teacher perception of the program itself. The SETS instrument could measure change in teachers’ self-efficacy as a result of the intervention; the SETS instrument measures these levels with a domain-specific approach other instruments lack, potentially better indicating impact.
Footnotes
Authors’ Note
This work was presented in part at the 2012 American Educational Research Association Meeting and at the August 14, 2012 Consortium for Advancement of Undergraduate Statistics Education (CAUSE) Webinar. Readers interested in using the SETS instrument should contact the authors.
Declaration of Conflicting Interests
The author(s) declared no potential conflicts of interest with respect to the research, authorship, and/or publication of this article.
Funding
The author(s) disclosed receipt of the following financial support for the research, authorship, and/or publication of this article: The researchers gratefully acknowledge support from CAUSE (under NSF DUE Award No. 0618790).