
Abstract
Traditional resources for ascertaining risk and protection for disengaged youth are often unsuitable, due to the stamina and skill required to complete them. Many of these tools assess risk without considering participants’ potential for personal growth. The present study outlines the development and initial validation of a tool titled the Contextualized Assessment Tool for Risk and Protection Management (CAT-RPM), which was administered to 499 participants across a range of high school settings. Six factors emerged that were highly correlated and had good internal consistency. Multivariate tests strongly suggest that the CAT-RPM is a valid and psychometrically sound assessment tool for differentiating groups across sex, age, and antisocial behavior. The research reveals a reliable measure of risk and protection that can assist young people to recognize and build on their strengths and adds a positive dimension to traditional risk assessment tools.
The Contextualized Assessment Tool for Risk and Protection Management (CAT-RPM) was designed from a strengths-based social cognitive perspective. It provides a holistic measure to assist in the case management of young people who require support due to potential or actual involvement with the juvenile justice system. The tool calculates from raw scores, a scaled and weighted measure that separates out a score for risk and a score for protective factors. This dual score assists young people to identify their strengths and develop their potential through the effective application of relevant interventions. The process of separating out risk and protection will not be reported in this study, primarily because it is the focus of another article (Bower, Carroll, & Ashman, 2013). The aim of this study was to establish the validity and reliability of the CAT-RPM when differentiating groups.
Background
Complexities of Risk and Protection
For most young people, adolescence is a complex time. Positive and negative events and interactions with others at home, with peers, at school, and in the community contribute to a sense of identity, mould future relationships, and shape life paths. (Larson, 2000; Moffitt, 2003). Significant life events such as loss of a parent or finding a partner can also impact heavily. When negative experiences overwhelm the positives across multiple settings, risk factors such as antisocial behavior, a lack of social and academic skills, and disengagement can result (Gabalda, Thompson, & Kaslow, 2010; Rutter, 2003). In some cases risk and protection can mirror each other, with high risk inferring low protection and vice versa, but not in all cases. For example, a young person holding down a paid job may indicate protection, but not doing so would not indicate risk. While it is important to consider risk and protective factors, one must also consider the interplay of factors and the contexts in which they occur (Rutter, 2003).
Importance of Contexts When Identifying Strengths
Risk and protective factors have been commonly reported across the contexts of self, family, school, peers, community, and significant life events (Carroll, Houghton, Durkin, & Hattie, 2009; National Crime Prevention, 1999), however these domains are not discrete.
Young people need certain social and personal capabilities to function effectively in society (Australian Curriculum Assessment and Reporting Authority [ACARA], 2012a; Collaborative for Academic, Social, and Emotional Learning, 2000-2011). These competencies within the self can spill over into other contexts. For example, a greater sense of well-being may improve attitudes toward others, and improve school performance (Durlak, Weissberg, Dymnicki, Taylor, & Schellinger, 2011). Positive developmental outcomes such as self-awareness, self-management, social awareness, and social management can result (Whitlock & Hamilton, 2003). Through understanding and managing their own emotions and behaviors, many young people are able to understand others and develop healthy relationships at work, home, and in the community (Durlak et al., 2011).
Positive relationships can also impact across contexts in reducing risk and promoting protection. For example, interactions at school, home, and with peers can affect learning. Young people with a sense of connectedness to others at school, perform better academically, and have higher levels of self-esteem, identity development, and social skills across contexts (Furlong, O’Brennan, & You, 2011; Karcher, 2005).
Students are most engaged when the school environment meets their social and emotional needs (Wang & Eccles, 2012). School engagement is an important protective factor for youth at risk. We know that school engagement is positively correlated with school success, and that positive relationships to teachers, peers, and family have been shown to improve self-worth, self-esteem, and consequentially, engagement at school (Gutman & Eccles, 2007; Martin & Dowson, 2009).
In the same way, the wider community can protect against risk by providing opportunities for paid work, participation in community groups, and relationships with mentors. Involvement in community programs provides opportunities for positive connections with committed adults and has been identified as a key asset for positive youth development (Lerner, Almerigi, Theokas, & Lerner, 2005).
Accordingly, Positive Youth Development research by Lerner and colleagues has demonstrated that positive behavior change can occur as a consequence of young people developing skills and sustaining positive relationships with significant people across these contexts. (Lerner, Lerner, Almerigi, & Theokas, 2005). Positive interactions can have a protective effect that mediate risk across multiple contexts, just as negative interactions and life events can exacerbate risk.
A strengths- rather than risk-focused view of development, therefore requires a balanced measure of risk and protective factors across the contexts of self, family, school, peers, community, and significant life events. (National Crime Prevention, 1999; Pollard, Hawkins, & Arthur, 1999; Theokas & Lerner, 2006).
Measuring Differences Across Groups
All young people have some element of potential risk in life although it is often not until the risk is extreme that attention is given to the label. At different periods in life such as childhood, adolescence, and adulthood, there is a variation of markers that place an individual at risk of, or protect him or her against, poor life outcomes. During the schooling years, predominant markers of risk are antisocial behaviors across contexts. Often discussed in the literature are the overrepresentation of males and the age of onset of this behavior (Bond, Toumbourou, Thomas, Catalano, & Patton, 2005; Carroll et al., 2009). Differentiating levels of risk across sex, age, and antisocial behavior while identifying protective factors, is important for developing effective interventions for positive growth.
Antisocial Behavior in Schools
Historically, school administrators have adopted punitive measures to deal with challenging students. Exclusions and suspensions are often outcomes for young people impacted by cumulative risk across contexts. As risk increases and compounds, antisocial behavior tends to be exacerbated (Lewis & Sugai, 1999; Nathan, Houghton, Tan, & Carroll, 2011) Schools may use exclusion as a last resort for those who display challenging behavior, such as physical assault or violation of school rules (Carroll et al., 2009). Such strategies have been shown to be ineffective (Hemphill, Toumbourou. Herrenkohl, Morris, & Catalano, 2006; Nathan et al., 2011; Sugai & Horner, 2002). Furthermore, Hemphill and colleagues (2006) in a study concluded that school suspensions were likely to increase antisocial behavior in populations across Australia and the United States. Nevertheless, students who have been suspended or expelled, generally display higher levels of cumulative risk across contexts and less-protective factors than those who have not (Carroll et al., 2009; Hemphill et al., 2006).
Differences Across Age
Individual risk and protective factors also differ across age groups (Hartman, Turner, Daigle, Exum, & Cullen, 2009; Palermo, 2009). Development of antisocial behavior has been considered in terms of developmental pathways from puberty to adulthood. For example, Loeber and Stouthamer-Loeber (1996) suggest that some at-risk youth progress through three levels: authority conflict; covert antisocial acts, for example, shoplifting; or overt pathways, for example, aggression. Other researchers describe adolescent-limited and life-course persistent behaviors (Moffitt, 2003). Moffit suggests that adolescent-limited antisocial behavior emerges during puberty and is common, normal, and relatively temporary. These behaviors tend to peak around 15 years, however, this figure varies slightly for males (15-16 years) and females (14 years; Hay, 2000).
Differences across Sexes
Males tend to be more involved in delinquency (Rutter, 2003). Indeed, Australian males constitute 90% of youths in the juvenile justice system (Taylor, 2009). Researchers suggest that differences in cultural gender roles (Petersen, Silbereisen, & Sorensen, 1996) or differences in parenting response to aggression by girls and boys (Keenan & Shaw, 2003) may be the cause. Furthermore, males tend to seek out participation in antisocial activities as a means of promoting a nonconforming reputation among their peers (Carroll et al., 2009).
Associated with this disparity in male and female behavior are differences within the self, e.g., self-confidence, self-image, social awareness, and sense of responsibility (see Offer, Kaiz, Howard, & Bennett, 1998). Low self-esteem has been shown to be a predictor of association with deviant peers, more so in girls than in boys (Bartlett, Holditch-Davis, Belyea, Tucker-Halpern, & Beeber, 2006), possibly because such associations boost “tough” reputations in boys, adding to a masculine identity (Hay, 2000).
Relationships with peers differ across sexes also. Females tend to be socially conforming, encouraging abstinence from antisocial behavior. They tend to place more value on friendship, group membership, getting good grades, being seen as trustworthy, or being kind. In contrast, boys tend to admire socially nonconforming behaviors such as breaking rules (Carroll et al., 2009).
The literature, therefore, suggests that to accommodate the differences across groups, a measure of risk and protection should show variance across age, sex, and at-risk groups and consider the potential of the individual. So, how should these be measured?
Current Measures
Measuring the potential of youth displaying antisocial behavior in schools is a challenge when risk and protection need to be considered. While measures exist that assess risk and protection, they tend to focus on negative behaviors, ignore context, or disregard the intricate balance of risk and protection (e.g., Youth Self-Report). Such measures diagnose problems, but provide limited information about the individual or their potential to thrive. In contrast, measures such as the Communities that Care Survey Youth Survey, the Behavioral and Emotional Screening System (BASC-2) or the Profile of Student Life: Attitudes and Behaviors Survey do consider risk and protective factors, however, they rely on test formats that challenge the literacy and attentional needs of many disengaged youth.
Young people who experience risk factors such as academic failure and poor relationships with others are more susceptible to antisocial behavior (Pollard et al., 1999). They, like all young people, have strengths on which to build. Those measures that best meet the needs of vulnerable youth consider literacy and attentional needs and assess risk and protection. For example, the Strengths and Difficulties Questionnaire, measures emotional and behavioral problems, the Multidimensional Students’ Life Satisfaction Scale, life satisfaction and the Positive and Negative Affect Schedule, affect.
Focusing on strengths rather than risks can assist professionals who mentor young people in determining important life decisions. This research addresses the scarcity of self-assessment tools that support strengths-based methods of intervention for at-risk populations and measure social and emotional behaviors.
In previous work, the items in the CAT-RPM were developed from interviews with vulnerable youth aged 12-18 years, so the language and relevance of items is appropriate for prompting accurate information. The practical significance of the CAT-RPM is that it measures risk and protective factors contributing to social and emotional well-being across the contexts of self, school, family, peers, and community. This measure is a necessary addition to schools where vulnerable youth often equate long questionnaires with being tested for deficits. Consistent with a strengths-based perspective, the intent is that this measure will assist young people to identify and build on their strengths to reduce risks and reach their potential.
This present study addressed two research questions:
Research Question 1: What are the dimensions underlying the CAT-RPM?
Research Question 2: Is the CAT-RPM a psychometrically sound measure to differentiate groups?
To address these, it was hypothesized that:
There would be six dimensions underlying the CAT-RPM in accordance with the various contextual domains (self, family, school, peers, community, and significant life events).
Young people who have been excluded from school would have higher levels of risk (e.g., antisocial peers, poor academic ability, or poor social skills), and less protection (e.g., parent involvement at school, teacher support, or academic success) than those who had not been excluded. Those who had been suspended for short periods would be expected to score lower risk and higher protection than those who had been excluded.
There would be differences in levels of risk and protection across age groups, with levels of risk peaking around 14-16 years of age.
Males would tend to have higher levels of risk and lower protection than females.
Method
Participants and Settings
Of 15 schools across three Australian states invited to take part in the research, 11 were involved. Schools comprised a convenience sample that represented a cross-section of socio-economic groups (ICSEA: 878 to 1132), but did not include either extremely advantaged or extremely disadvantaged groups. In Australia, the Index of Community Socio Educational Advantage (ICSEA) is a published measure used to meaningfully compare student performance by combining individual, family, school, and community information. ICSEA scores range between 500, representing extreme disadvantage, and 1,300, representing extreme advantage. M = 1,000, SD = 100 (See ACARA, 2012b). Participants attended metropolitan (61%), rural (39%), single- (38%) and mixed-sex (62%) high schools representing a cross-section of the national population. (see Australian Bureau of Statistics, 2012).
Recruitment for the CAT-RPM trial was conducted in several ways. Nine schools were contacted directly and five agreed to participate. The research was presented at education conferences where another four schools from two other Australian states sought inclusion in the trial. Finally, two schools were invited to augment the sample sizes in various age and sex groups once the distribution of participants was established after the first round of data collection. Complete data were collected from 499 participants (266 males). Approximately 40% of participants were invited to take part through guidance officers or learning support teachers at the schools, however, the CAT-RPM was completed during mainstream classes and no specific data were collected on special education programs. Ages of participants ranged from 12 to 17 years with a mean age of 14.5 years (14.6 years for males; 14.3 years for females). Participants indicated their cultural connection by choosing from the following categories: None (n = 11); Aboriginal or Torres Strait Islander (n = 22); Australian (n = 432); or Non-Australian (n = 34).
Instrumentation
The CAT-RPM was developed using qualitative and quantitative research methods in three phases. In the first phase, risk and protection within a group of young people in high schools and detention centers were investigated using a semi-structured interview. These interviews led to a pool of items that used terms, concepts, and contexts that were appropriate for young people at risk of disengagement from school. Thirty-six nonoffenders, 31 early-onset offenders, and 36 late-onset offenders were matched on age, sex, and culture. Themes emerged from interview transcripts that were indicative of risk and protection across six domains: self, family, school, peers, community, and significant life events (Bower, Carroll, & Ashman, 2012).
Items developed from Phase 1 led to the construction of the CAT-RPM (Phase 2). First, a pencil-and-paper form was constructed, reviewed, and critiqued by a group of experts. Content validity was addressed along with issues relating to the relevance of the prototype instrument for at-risk and Indigenous youths. Consideration was given to readability, user-friendliness, questionnaire length, and the need to weigh items according to their significance as risk or protective factors. Ultimately, the prototype was reduced to 66 items and an online version was constructed for testing.
The CAT-RPM is a two-part, semantic differential questionnaire measuring risk and protection across six domains, gathering demographic information about age, sex, family composition, and schooling experience. For each item, the participant indicates their level of agreement on a sliding scale. Twenty-seven of the 66 items were reverse scored. A higher score indicates higher risk and lower protection and a lower score indicates lower risk and higher protection.
Participants accessed the assessment tool in two ways: (a) a pencil-and-paper version; and (b) an online version. Participants responding online moved a slider between two opposing anchors and those using the hard copy marked on paper to indicate their agreement or disagreement with the various items. The online instrument collected interval data between 0 and 10 to 2 decimal spaces. Each item in the pencil-and-paper version was scored using whole numbers between 0 and 10, and these were manually recorded.
Procedure
The Behavioral and Social Sciences Ethical Review Committee at The University of Queensland, Australia, approved the study. Gatekeeper approval from education offices is required to collect data in Australian schools. This was sought through State, Catholic, and Independent Education offices in three Australian States.
Principals of participating schools were given an information pack including a description of the study, consent form, and a copy of the questionnaire items. They also distributed an information letter and consent form for parents and students to sign. Participants who returned co-signed consent forms were included in the study and comprised a 76% response rate.
Administration directions for both versions of the assessment tool were kept as close as possible. For the online version, students sat at individual computers and were directed to login and complete the demographic questions. They then completed the questionnaire under examination conditions. The pencil-and-paper task was also completed under examination conditions.
Three hundred and seventy-six participants completed the online version of the assessment tool and 135, the pencil-and-paper version. The online version was the preferred delivery method. Both options were provided because some schools found it easier to participate in the research project if they could distribute a pencil-and-paper version during a class period. Data from 12 participants were discarded due to excessive missing information.
Prior to the main analyses, a 2 × 6 × 2 (Format × Age × Sex) Multivariate Analysis of Variance (MANOVA) was conducted to identify differences between the data collected via the two versions across age and sex over the six domains. While there was a significant multivariate interaction for Format by Sex, F(6, 472) = 3.68, p < .01, η2 = .05, there were no significant univariate statistics. There was no multivariate main effect for Format F(6, 472) = 1.35, p = .24, η2 = .02. These findings suggest that comparable data were collected using both types of administration.
Results
To determine whether the CAT-RPM was suitable for extracting factors, two tests were conducted: Bartlett’s test of sphericity (Bartlett, 1954) and Kaiser–Meyer–Olkin’s Measure of Sampling Adequacy (MSA) (Kaiser, 1970, 1974). Bartlett’s test reached statistical significance, χ2 = 14512.16, df = 2145, p < .001, demonstrating suitability of the correlation matrix for factor analysis (Bartlett, 1954). In addition, the MSA value obtained was .92, exceeding the recommended minimum value of .60 (Tabachnick & Fidell, 2007). The correlation matrix of the CAT-RPM, therefore, met two stipulated criteria on factorability of a data matrix.
To address Hypothesis One, a Maximum Likelihood factor analysis was conducted to identify the latent constructs underlying the variables measured in the CAT-RPM (Fabrigar, Wegener, MacCallum, & Strahan, 1999) and to determine if the number of items could be reduced (Floyd & Widaman, 1995). Maximum Likelihood Factor Analysis was chosen for factor extraction as it allows testing of statistical significance of factor loadings and correlations among factors (Costello & Osborne, 2005; Fabrigar et al., 1999).
Four procedures were used to determine the number of factors to be extracted: percentage of variance accounted for by the factor solution; Kaiser’s criterion for extracting factors with eigen value greater than one (Kaiser, 1970, 1974); examination of the Scree plot (Cattell, 1966); and examination of factor loading tables extracting fixed numbers of factors (Costello & Osborne, 2005; Floyd & Widaman, 1995).
Six factors accounted for 44.6% of the variance. Factor One accounted for 23.7% of variance, and each factor thereafter, between 6.6% and 3.1% of variance. This seemed to be a logical number of factors.
Fourteen factors had eigen values greater than one. Used alone, Kaiser’s criterion has led to over factoring (Costello & Osborne, 2005; Fabrigar et al., 1999; Velicer & Jackson, 1990) and 14 seemed excessive. The scree plot suggested three to nine factors, accounting for 34.3% to 51.5% of cumulative variance.
Several maximum likelihood factor analyses were performed. Direct oblimin rotation was chosen as the complexities of risk, protection, and behavior generally interact in some way, so correlation among factors would be expected (Costello & Osborne, 2005). Four to eight factors were extracted manually.
Costello and Osborne (2005) suggested that a clean factor structure would include a factor loading above .3, no loadings above .3 across factors, and three or more items per factor. Six domains (self, family, school, peers and leisure-time, community, and significant life events) are commonly reported in the literature for deconstructing risk and protection (Bond et al., 2005; National Crime Prevention, 1999). Six factors were accepted as the optimum number.
A direct oblimin rotation explored the underlying dimensions of items (Kim & Mueller, 1978). Small coefficients with an absolute value below .3 were suppressed. The result of the Maximum Likelihood Factor Analysis with oblique rotation reflected well the original six domains, supporting Hypothesis 1. These factors were labeled Family Belonging, Involvement in Risky Activities, Self-Awareness, School Experience, Peer Connectedness, and Social Responsibility (see Table 1). Six items failed to load above .3 on any factor and were deleted from further analysis (italicized in Table 1). A seventh item, There are many people in my community who I really look up to, was also removed. It described connectivity to others in the community and did not fit with the other items in Factor 1. Removing this item had no effect on the reliability of Factor 1.
Items and Factor Loadings for the CAT-RPM–Maximum Likelihood Factor Analysis.

Note. Extraction Method = Maximum Likelihood; Rotation Method = Oblimin with Kaiser Normalization. A. Rotation converged in 12 iterations. Items with loading <.30 have been omitted.
The remaining 59 items produced six reliable, readily explained factors thus supporting Hypothesis One. A correlation matrix was prepared showing the interrelatedness between factors confirming that correlations between factors were not high (< .41).
Reliability
Two reliability checks were made: internal consistency and test–retest. The 59 items were analyzed for internal consistency to establish their contribution to each construct. Cronbach’s alpha scores between .7 and .8, are considered satisfactory (Bland & Altman, 1997; Streiner, 2003). Internal consistency was high, with factors ranging from .78 to .87.
Reliability is a characteristic of the test scores of the particular group, not the test itself (Streiner, 2003). The test can be deemed reliable within the sample tested, therefore, if scores are consistent over time. If the test scores, administered at two different times to the same group, are highly correlated, the test has good test–retest reliability (Gay, Mills, & Airasian, 2006). In this study, 30 participants from two schools were randomly selected from the larger sample to complete the questionnaire a second time, 2 weeks later. Intercorrelations at the level of the factors showed the instrument to have strong test–retest reliability. Using Pearson’s correlations, test–retest intercorrelations for mean factor scores ranged from .65 to .91.
Validity
Validity of the CAT-RPM was confirmed in two ways: content validity and discriminant validity.
Content validity
Content validity ensures that content of an assessment tool is representative of the elements being measured (Lynn, 1986), and was conducted in the development phase to establish the instrument content as appropriate to measure risk and protection across contexts. Briefly, consultation was conducted with 15 experts from professional and academic backgrounds in the areas of behavior management, youth at-risk, and Indigenous ways of learning. A two-stage approach was followed: a developmental stage (including generation of items, and formatting the instrument), and a judgment stage (including consultation with experts). Content validity was established through rigorous and systematic consultation to address the relevance of content to vulnerable and Indigenous young people, consistency in terms of risk/protection and domains, and to consider how to distinguish between items on the basis of their impact as risk or protective factors. It was crucial that the CAT-RPM be inclusive of Indigenous young people given their overrepresentation in disciplinary actions in schools and communities. For example, in Queensland, Australia, Indigenous young people on supervised youth justice orders represented 13 times the rate of non-Indigenous in 2010 (Queensland Commission for Children and Young People and Child Guardian, 2011), and the number of school disciplinary absences for Indigenous young people are 3 times that of non-indigenous students (Education Queensland, 2013).
Discriminant validity
The second confirmation of validity used was discriminant validity. This exists when a measure differentiates groups as expected (Messick, 1995). To be a valid measure of risk and protective factors, the CAT-RPM should distinguish groups with low risk and high protection and those with high risk and low protection. Young people who have been suspended or expelled from school would be expected to fall into the latter category. The sample was divided into three: (a) Group 1 included 449 young people who reported no exclusion from school; (b) Group 2 included 40 participants who reported exclusion one time only for one to five days; and (c) Group 3 consisted of 10 participants who had been excluded from school for six or more days. It was expected that those with increasingly problematic behavior would have higher mean scores across the factors.
To address Hypothesis 2, discriminant validity was tested as follows. Composite mean scores were calculated for each group for each of the six factors. Scores were plotted (see Figure 1). Results were as expected, with risk increasing across all factors as problem behavior increased in intensity, thus supporting Hypothesis 2.
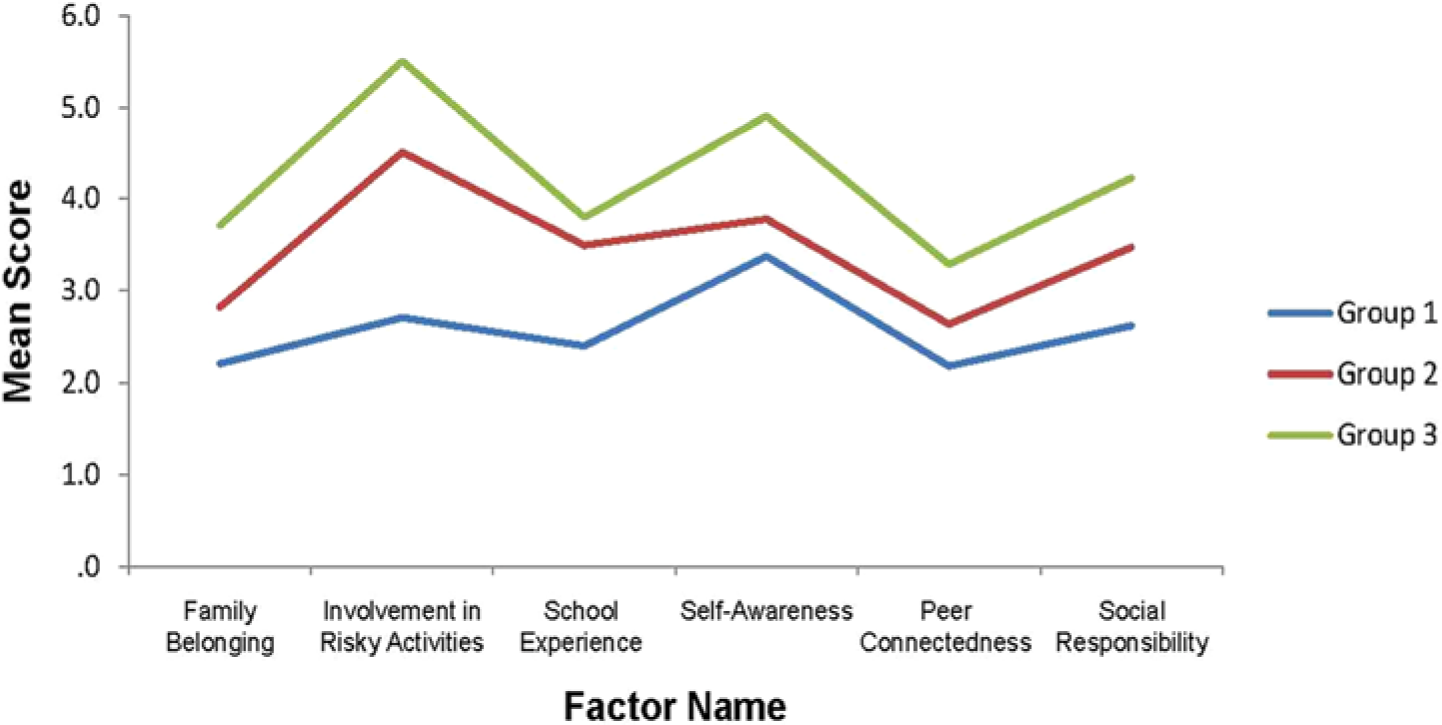
Composite mean scores for differentiating groups based on exclusion from school.
Multivariate tests analyzed differences between groups based on Exclusion from School. Multivariate significance was calculated using Wilk’s Lambda, converted to an approximate F statistic, F(12, 982) = 5.68, p = .000, η2 = .07.
A one-way MANOVA was conducted using the exclusion group as the independent variable and the six composite mean scores for each factor as dependent variables: Family Belonging F(2, 496) = 5.93, p = .00, Involvement in Risky Activities F(2, 496) = 29.42, p = .00, Self-Awareness F(2, 496) = 6.01, p = .00, School Experience F(2, 496) = 12.06, p = .00, Peer Connectedness F(2, 496) = 3.79, p = .02, and Social Responsibility F(2, 496) = 11.57, p = .00. Univariate F tests confirmed significant differences (p < .01) between groups for all factors except Peer Connectedness (p < .025). Therefore, the CAT-RPM appears to differentiate groups based on risky behavior.
Multivariate Analyses of Variance
Hypothesis 3 and Hypothesis 4 concerned identification of differences in age and sex across the 6 factors.
Main effects—Age and sex differences
There were significant main effects for Age, F(30, 1930) = 3.61, p = .000, η2 = .043, and Sex, F(6, 482) = 12.95, p < .000, η2 = .14, and a significant univariate statistic for Age on the dependent variable of Involvement in Risky Activities, F(5, 487) = 11.83, p < .001.
For the main effect of Sex, the univariate F tests, indicated significant differences on the dependent variables of Involvement in Risky Activities, F(1, 487) = 21.33, p = .000 and Self-Awareness, F(1, 487) = 11.01, p = .001. The observed means for Sex indicated that males participated in significantly more risky activities (N = 3.3) than females (N = 2.5) and post hoc tests for Self-Awareness, revealed significant differences between males (N = 3.3) and females (N = 3.7).
Interaction effects
Multivariate tests using a general linear model were conducted to analyze differences according to sex and age. Wilk’s Lambda, converted to an approximate F statistic, was again used to evaluate multivariate significance with probability set at p = .05. A full factorial model showing differences in the independent variables were plotted for each MANOVA. Bonferroni’s post hoc test with equal variance assumed was chosen as it was a conservative estimate that allowed for error variance. Univariate F values were deemed significant at p < .01 to control for Type 1 errors (Huck, Cormier, & Bounds, 1974).
A 2 × 6 MANOVA was conducted using Sex and Age as grouping variables and the six composite mean scores as the dependent variables: Family Belonging F(5, 487) = .85, p = .52, Involvement in Risky Activities F(5, 487) = 3.33, p = .01, Self-Awareness F(5, 487) = .36, p = .88, School Experience F(5, 487) = 1.36, p = .24, Peer Connectedness F(5, 487) = .96, p = .44, and Social Responsibility F(5, 487) = .66, p = .66. There was a significant Sex by Age interaction effect, F(30, 1930) = 1.60, p = .022, η2 = .02. Subsequent univariate F tests confirmed that Involvement in Risky Activities F(5, 487) = 3.329, p < .007, η2 = .03 was the major contributing factor in the significant interaction.
The interactions are shown in Figure 2. They indicate that until the age of 14 years, involvement in risky activities are similar for boys and girls; with 12- to 14-year-old boys scoring means of 1.7, 2.3, 3.2 and girls of the same ages scoring 1.9, 1.9, and 2.9, respectively. At the age of 15, risky activities drop off for girls (3.0) and continue to do so for 16- (2.6) and 17-year-old girls (2.3). For boys, participation in risky activities increases at age 15 years (3.6), and continues to do so at ages 16 (3.7) and 17 years (4.8). These results support Hypotheses 3 and 4.

Interaction effect for sex by age for variable of risky activities.
Discussion
These findings confirm established research that young people participate in risky activities at varying levels as they progress through their adolescent years (Carroll et al., 2009; Moffitt, 2003).
Involvement in risky activities such as drinking alcohol, getting into trouble at school, lack of parental supervision, and participation in illegal activities differs across age and sex. Until the age of 14 years, participation in risky activities was similar for boys and girls. At age 15 years, risky activities dropped off for girls, possibly due to maturation, but also because being linked to antisocial behavior tends to be more isolating for girls (as shown by Hay, 2000). For boys, however, involvement in risky activities increased. This makes sense in that some boys tend to engage in antisocial behavior to enhance their choice of a nonconforming identity among their peers (see Carroll et al., 2009).
There were also significant differences on Self-Awareness for girls and boys. The construct of Self-Awareness in this study explored self-concept, self-esteem, being hopeful about the future, and self-regulation. A positive future orientation and strong feelings of self-worth have been associated with reduced association with risk behaviors (Haegerich & Tolan, 2008). It is recognized that self-concept is multidimensional and includes a self-evaluative component associated with peers and school (Carroll, Houghton, Wood, Perkins, & Bower, 2007). In the present study, boys had a lower mean score for Self-Awareness indicating less self-confidence, less awareness of their strengths, and less self-regulation than their female peers. Higher levels of self-esteem and self-worth act as a protective factor against delinquency for girls, but not for boys (Hartman et al., 2009). Hay (2000), also suggested that self-concept and involvement in risky behavior might be linked, when adolescents, particularly boys, compensate for poor social self-concept through antisocial behaviors.
Although males and females had increased scores for Self-Awareness around age 13 years, boys then stayed relatively stable in this factor till age 17 years. In contrast, the mean score for girls dropped at age 15 years before increasing again at age 17 years. Researchers such as Carroll et al. (2007) and Caspi, Lynam, Moffitt, and Silva (1993) have suggested that girls focus on a social and academic self-concept, whereas boys focus on physical and peer self-concept (see e.g., Hay & Ashman, 2003). The drop at age 15 years could be associated with the connection between self-esteem and body image issues around physical maturation that occurs around this time (Alipoor, Goodarzi, Nezhad, & Zaheri, 2009) and a growing propensity toward eating and anxiety disorders in girls (Bulik, Sullivan, Fear, & Joyce, 1997).
These findings have important conceptual and practical implications for educators and psychologists. Conceptually, this study builds on theory based in positive approaches to youth development and behavior management (Lerner, Lerner, Almerigi, & Theokas, 2005; Scales & Leffert, 2004) by adding to present knowledge about the complex interactions of risk and protective factors in young people’s emotional, intellectual, and social lives. Practically, the CAT-RPM can distinguish differences across sex and age groups, and contexts such as the home, school, and community where young people’s behavior may be subject to diverse influences. It separates out risk and protection, allowing the user to identify the strongest domain on which to build strength. This contrasts with other instruments that isolate an individual’s risk when diagnosing conditions underlying a behavior.
Important limitations to this study should, however, be noted. The sample was a convenience sample that did not include extremely disadvantaged or extremely advantaged students. Additional data are needed from diverse groups of participants and across time to continue confirmation of the instrument’s psychometric properties. The study relied on self-report data and this may have increased method variance. Triangulation of data through collection of school record data and teacher reports or parent reports would strengthen psychometric properties.
Future research might compare the CAT-RPM constructs against similar established tools. A longitudinal study could gather data from a larger group of young people examining personal and social development over time. This could assist in establishing the instrument’s predictive validity, aid the construction of relevant interventions, and assist with the early identification of at-risk students.
Footnotes
Declaration of Conflicting Interests
The author(s) declared no potential conflicts of interest with respect to the research, authorship, and/or publication of this article.
Funding
The author(s) disclosed receipt of the following financial support for the research, authorship, and/or publication of this article: The interviews that formed the basis for the CAT-RPM items were part of the Creating Safer Communities Project (2003-2005), funded by the Australian Research Council.