
Abstract
The predictive validity and accuracy of an oral reading fluency (ORF) measure for a statewide assessment in English language arts was examined for second-grade native English speakers (NESs) and English learners (ELs) with varying levels of English proficiency. In addition to comparing ELs with native English speakers, the impact of English proficiency was examined among ELs. The results suggest that the predictive validity of ORF is stronger for native English speakers than for ELs. ORF scores for ELs with intermediate English proficiency were less correlated to the state assessment than for other EL subgroups. Similarly, the predictive accuracy of ORF was found to vary by English proficiency. Results suggest that ELs should not be treated as a homogeneous group and that cut scores should be used with caution.
Reading is a critical foundational skill needed for success in school and society. Yet, the National Assessment of Educational Progress indicates that more than 50% of fourth graders are not proficient in reading (National Center for Education Statistics, 2011). The percentage of ethnic minorities in the U.S. student population has increased from 22% to 35% between 1985 and 2010. Many of these students are also English Learners (ELs), a majority of whom speak Spanish as their native language (National Center for Education Statistics, 2011). English proficiency poses an additional challenge for ELs who are learning to read in English. Considering the above issues, it is important for educators to have adequate screening tools to identify students, both native English speakers (NESs) and ELs, who are at risk for reading difficulties.
With the focus on accountability and high-stakes state assessment in the current educational climate, numerous studies have examined the use of curriculum-based measures of oral reading fluency (ORF) as screeners to predict reading performance on high-stakes state assessments. In a recent meta-analysis, Reschly, Busch, Betts, Deno, and Long (2009) found that ORF exhibited an average correlation of .65 with state assessments, which led them to suggest that ORF was a relatively adequate predictor of future reading performance. Aside from this meta-analysis, various studies have found correlations between ORF and state assessments to range from .43 to .81 (Baker et al., 2008; McGlinchey & Hixson, 2004; Stage & Jacobsen, 2001; Wiley & Deno, 2005). In addition to correlational evidence, studies using regression analyses have found that ORF contributes approximately 30% to 49% of the variance in performance on state assessments (Baker et al., 2008; Muyskens, Betts, Lau, & Marston, 2009; Pearce & Gayle, 2009).
Although there have been numerous studies examining the predictive validity of ORF as screener for performance on state assessments, one major limitation is that there is much less research conducted among EL students. When evaluating the predictive validity and accuracy of screening tools, it is important to explore possible sources of predictive bias so that the utility of screeners can be maximized for EL students. The presence of predictive bias is confirmed when a test’s predictive validity and accuracy differ by group (American Educational Research Association [AERA], 1999). Predictive bias does not refer to the presence of mean differences between groups. More research is needed to examine EL status as a possible source of predictive bias.
In the few studies that have explored EL status as a source of predictive bias for using ORF as a screener to predict performance on state assessments, mixed results have been found. Specifically, evidence of bias was found in some studies (e.g., Klein & Jimerson, 2005; Wiley & Deno, 2005), while lack of bias was found in other studies (e.g., Hosp, Hosp, & Dole, 2011; Muyskens et al., 2009; Roehrig, Petscher, Nettles, Hudson, & Torgesen, 2008). Klein and Jimerson (2005) examined the role of several factors on the predictive validity of ORF for performance on the Stanford Achievement Test (SAT-9) for first through third graders. Among these factors, language background was found to be the primary factor contributing to predictive bias. In addition, Wiley and Deno (2005) found that the usefulness of ORF as a predictor for performance on the Minnesota Comprehensive Assessment (MCA) varied as a function of EL status in a sample of third and fifth graders.
In contrast to these results, Roehrig and colleagues (2008) found that ORF predicted performance on the Florida Comprehensive Assessment Test–Sunshine State Standards (FCAT-SSS) and the SAT-10 equally well for third-grade students regardless of EL status. Similarly, Muyskens and colleagues (2009) found that ORF predicted performance on the MCA equally well for fifth-grade students from different language backgrounds. In addition, Hosp and colleagues (2011) found that ORF predicted performance on the Utah State Criterion-Referenced Tests (UCRTs) equally well for a sample of first through third graders regardless of EL status.
Due to the conflicting evidence, the role of language status on the predictive validity and accuracy of ORF as a screener for performance on state assessments is unclear. In discussing the mixed results, it is first important to note that although the participants in these studies varied by grade, the conflicting results are likely not due to grade because studies indicating the presence and absence of bias used participants who overlapped in grade. Rather, the mixed results may likely be due to the fact that ELs were conceptualized as a homogeneous group. Although it is well-known that ELs possess various levels of English proficiency, research has not explored predictive bias as a function of English proficiency. English proficiency levels are important to examine because ELs who have just been exposed to English are very different from ELs who have been exposed to English for a few years. By not considering English proficiency in studies of predictive validity, results can oftentimes be difficult to interpret. For example, a study may have found no significant differences between ELs and NESs because the EL group was mostly composed of “almost proficient” individuals. Similarly, a study might have found significant differences between groups because the EL group was mostly composed of individuals who were only recently exposed to English. Considering the wide range of students and skills encompassed under the category of “English Learner,” examining this population with regard to English proficiency may help explain some of the mixed results in the current literature.
Purpose of the Study
To address the gaps in the ORF screening literature regarding the impact of English proficiency, we examined the predictive validity and accuracy of ORF for NESs and Spanish-speaking ELs with varying levels of English proficiency. Our goal was to determine whether ORF was differentially predictive of performance on a high-stakes state assessment. The following research questions were examined:
In a multitiered model, the purposes of screening are to identify at-risk students and examine the impact of core instruction. Fall ORF administration allows for the identification of at-risk readers early on in the school year. Winter administration is expected to contribute additional information regarding risk status and examine the impact of instruction over the previous 3 months.
Method
Participants
The participants included 1,143 second-grade students from 13 elementary schools in one urban school district in Southern California. Among the participants, 596 were NESs and 547 were Spanish-speaking ELs. The ELs included 198 students with low English proficiency, 193 students with intermediate English proficiency, and 159 students with advanced English proficiency. As a whole, the district had an enrollment of 27,452 students in 17 elementary schools, 5 middle schools, 5 traditional high schools, and 2 alternative high schools. The ethnic background of the students in the district were as follows: 73% Hispanic, 17% Black, and 6% White. Regarding language status, 31% of the students in the district were classified as ELs. Approximately 76% of the district’s students were from socioeconomically disadvantaged backgrounds (e.g., free/reduced-price lunch eligibility). Ethnic background and socioeconomic status data specific to the participants were not collected.
Measures
DIBELS ORF 6.1
DIBELS ORF is an individually administered standardized assessment of reading fluency. The student reads aloud a grade-level passage. The score is based on the number of words read correctly in 1 min. Reliability coefficients for elementary students range from .89 to .94; criterion-related validity with norm-referenced achievement tests range from .49 to .94 (Dynamic Measurement Group, 2008).
California standards tests–English language arts (CST-ELA)
The CST is a state assessment administered in the spring to all students in Grades 2 to 11 (California Department of Education [CDE], 2008). The CST-ELA is a component of the CST that measures student performance against California’s English/Language Arts content standards. Student scores are categorized as far below basic, below basic, basic, proficient, and advanced. The test content validity of the CST-ELA was established during test development through item review by experts in ELA (CDE, 2008). Regarding convergent validity, correlations between the second-grade CST-ELA and the CAT/6 Reading and CAT/6 Language were .77 and .76, respectively (CDE, 2008). Internal consistency reliability for the second-grade CST-ELA was α = .94 (CDE, 2008).
California English Language Development Test (CELDT)
The CELDT (CDE, 2007) is a test administered each year in the fall to measure the English proficiency levels of all ELs in California. It assesses English development in the areas of listening, speaking, reading, and writing. The overall score representing the level of English proficiency ranges from 1 to 5 (1 = beginning, 2 = early intermediate, 3 = intermediate, 4 = early advanced, and 5 = advanced). Regarding content validity, items on the CELDT are aligned with the CELD standards. During test development, construct validity was addressed by educational experts who aimed to minimize construct-irrelevant variance and construct underrepresentation. Internal consistency reliability of the CELDT ranges from α = .73 to .86 across all domains (CDE, 2007).
Procedure
ORF measures were administered to all participants during the fall and winter screening periods (e.g., once in September and once in January). Prior to administration, test administrators received a 6-hr training session with video examples and practice administrations. All examiners completed interrater reliability observations to ensure that reliability was above .90. School staff administered the CELDT to all EL students during the fall and the CST to all students during the spring.
Results
Descriptive statistics for ORF and the CST-ELA are provided in Table 1. On initial visual inspection, it appears that ORF and CST-ELA scores increased with English proficiency among EL students. Variability on ORF also increased with English proficiency among ELs. It is also noted that the ELs with intermediate and advanced English proficiency scored higher on ORF than did the NESs. On the CST-ELA, ELs with advanced English proficiency scored higher than did the NESs. These previous statements regarding patterns in the descriptive data are qualitative and do not imply the presence of significant mean differences.
ORF and CST-ELA Descriptive Statistics by EL Status and English Proficiency.
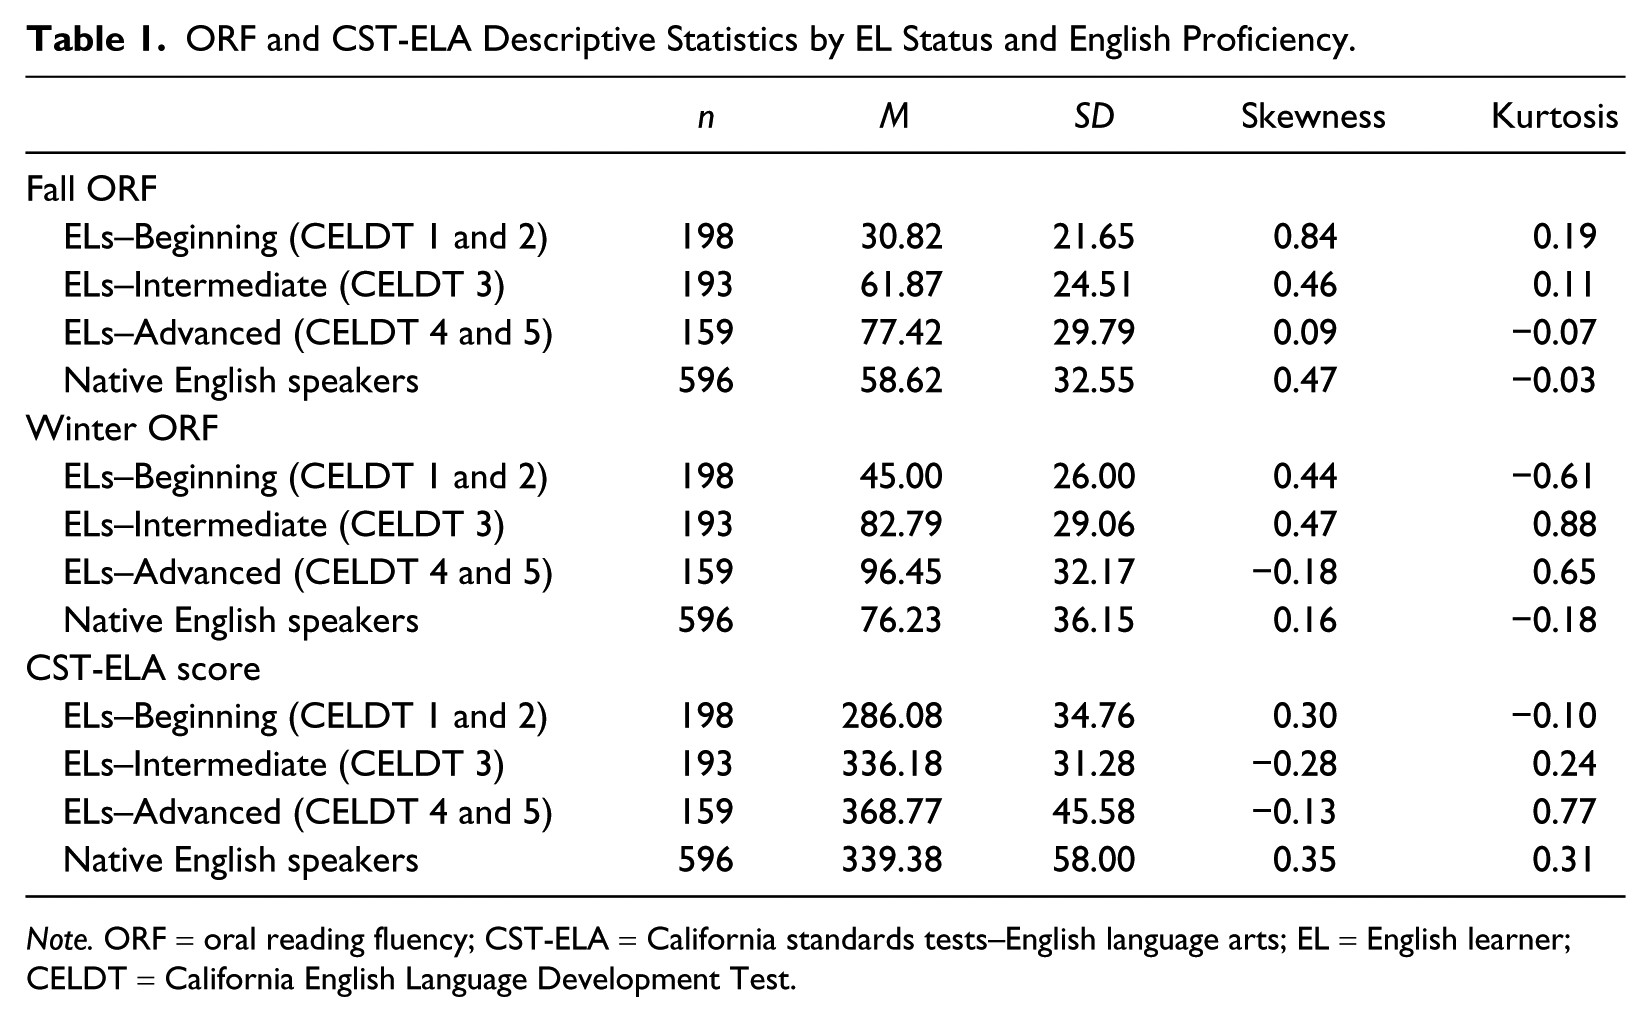
Note. ORF = oral reading fluency; CST-ELA = California standards tests–English language arts; EL = English learner; CELDT = California English Language Development Test.
Statistical assumptions for multiple regression were examined separately by group prior to data analyses. The data were generally normally distributed with skewness and kurtosis levels all between +1 and −1. Scatter plots indicated linear relationships between ORF and the CST-ELA. Residual plots indicated that the assumption of homoskedasticity was met. Regarding multicollinearity, fall and winter ORF were significantly correlated at r = .87. This was expected because they represent the same measure given at different time points and are expected to explain overlapping variance in the outcome. This did not pose a problem to the analyses because one of the research questions focuses on examining the additional variance explained by winter ORF.
Predictive Validity Analyses
Correlational analyses
The first research question examined the relationship between fall and winter ORF scores with spring reading outcomes and the extent to which English proficiency affects this relationship. To examine the effect of English proficiency, separate correlations were conducted for NESs and ELs at varying levels of English proficiency (e.g., beginning, intermediate, and advanced). The results of this analysis are reported in Table 2. For both fall and winter ORF, NESs exhibited the highest correlation, while intermediate level ELs exhibited the lowest. Correlations for beginning-level ELs and advanced-level ELs were similar.
Pearson’s Correlations for ORF and CST-ELA During Fall and Winter Screening.

Note. ORF = oral reading fluency; CST-ELA = California standards tests–English language arts; EL = English learner; CELDT = California English Language Development Test.
p < .01.
After examining the initial correlations between ORF and CST-ELA, the correlations between each group of students were compared for significant differences using a Fisher’s Z transformation. In examining the correlations between fall ORF and CST-ELA, the correlation for NESs was significantly higher than the highest correlation among the EL groups. The correlations among the EL English proficiency groups were not significantly different from each other. For winter ORF, the correlation for NESs was also significantly higher than the highest correlation among the EL groups. However, unlike fall ORF, ELs with intermediate English proficiency exhibited a significantly lower correlation than ELs with beginning or advanced English proficiency. Because two of the EL groups had the same correlations, the group with the fewer participants was used for the previous two comparisons because it would yield a higher p value. In these previous analyses, a total of four comparisons were made, which yielded one nonsignificant difference and three significant differences. Among the significant differences, the family-wise alpha value was p = .094. A correction for possible Type I error was not made. It is also noted that although the analyses yielded three significant differences, these correlations were all within the same order of magnitude (e.g., large) based on Cohen’s (1992) criteria of > .50.
Regression analyses
Following the initial validity analyses using correlations, predictive validity analyses were conducted using hierarchical linear regression. The predictors were entered in the following order: (a) fall ORF and (b) winter ORF. Separate analyses were conducted for each group (NESs and EL subgroups) rather than including group as a predictor in the model because we were interested in exploring the usefulness of ORF for each group by examining possible differences in proportion of variance explained in the outcome (CST-ELA). The results are reported in Table 3.
Proportion of Variance Explained by Fall and Winter ORF.
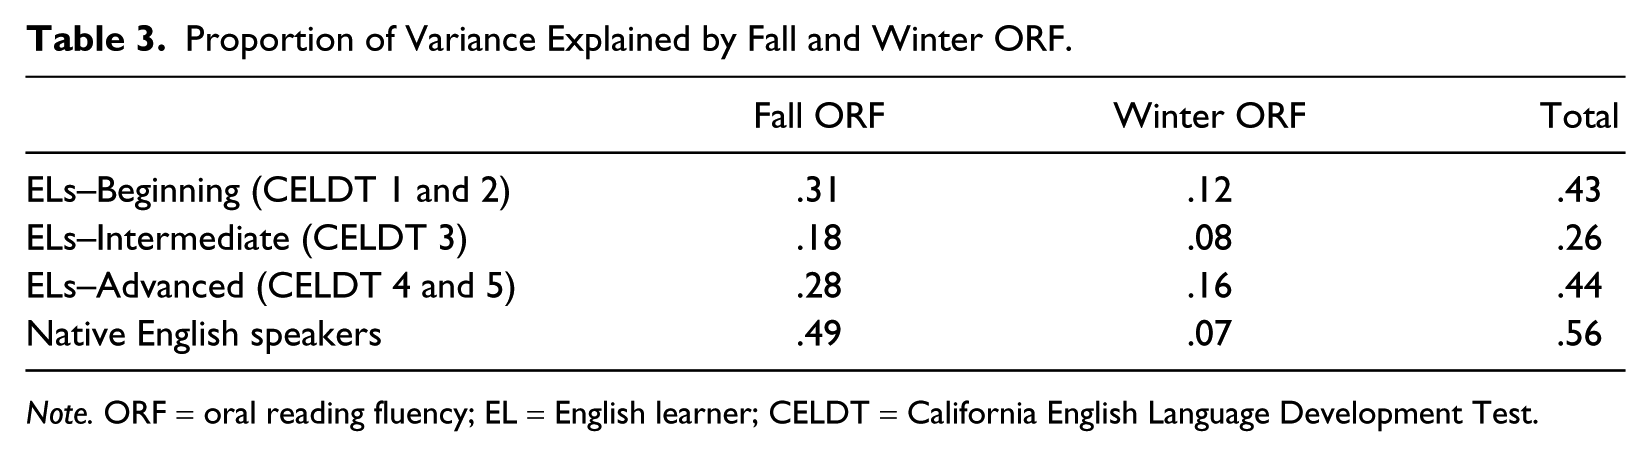
Note. ORF = oral reading fluency; EL = English learner; CELDT = California English Language Development Test.
In examining the combined explanatory role of both fall and winter ORF, the results indicated that ORF explained a greater proportion of the variance in CST-ELA for NESs (total R2 = .56) than for the EL groups (total R2 = .26, .43, .44). This was also found to be the case when only considering fall ORF as a single predictor (NES R2 = .49 vs. EL R2 = .18, .28, .31). However, when examining the added contribution of winter ORF, it was found that ORF contributed the least amount of additional variance for NES (R2 = .07) than for the EL groups (R2 = .08, .12, .16). In examining the three EL groups, ORF explained the lowest proportion of the variance in CST-ELA for ELs with intermediate English proficiency during fall (R2 = .18) and winter (R2 = .08). However, ORF explained a relatively similar proportion of the variance in CST-ELA for ELs with beginning and advanced English proficiency (fall R2 = .31 and .28; winter R2 = .12 and .16).
Predictive Accuracy Analyses
To assess predictive accuracy, receiver operating characteristic (ROC) analyses were conducted to assess the sensitivity and specificity of the DIBELS cut scores for each group of students. Sensitivity is the percentage of students not passing the CST-ELA who were identified as at-risk by ORF. Specificity is the percentage of students passing the CST-ELA who were identified as not at-risk by ORF. ORF cutoff scores for risk status were used to group students for each assessment period into “at risk” and “not at risk.” For the CST-ELA, students who scored in the proficient or advanced category were categorized as “passing,” while students who scored in the basic, below basic, or far below basic category were categorized as “not passing.”
The results of the predictive accuracy analyses are displayed in Table 4. Sensitivity values were found to be low, ranging from .07 to .49 for fall ORF and .15 to .64 for winter ORF. Specificity values were found to be high, ranging from .90 to 1.00 for fall ORF and .90 to .99 for winter ORF. Comparing these findings with the recommendation of 80% (Carran & Scott, 1992) for classification accuracy, these sensitivity values failed to meet these minimum recommended levels. The specificity values, however, were adequate. Regarding the effect of EL status and language proficiency, both fall and winter ORF yielded the highest sensitivity for ELs at the beginning of English proficiency, which were then followed by NES, ELs with advanced English proficiency, and ELs with intermediate proficiency.
Classification Accuracy of DIBELS Cut Scores.
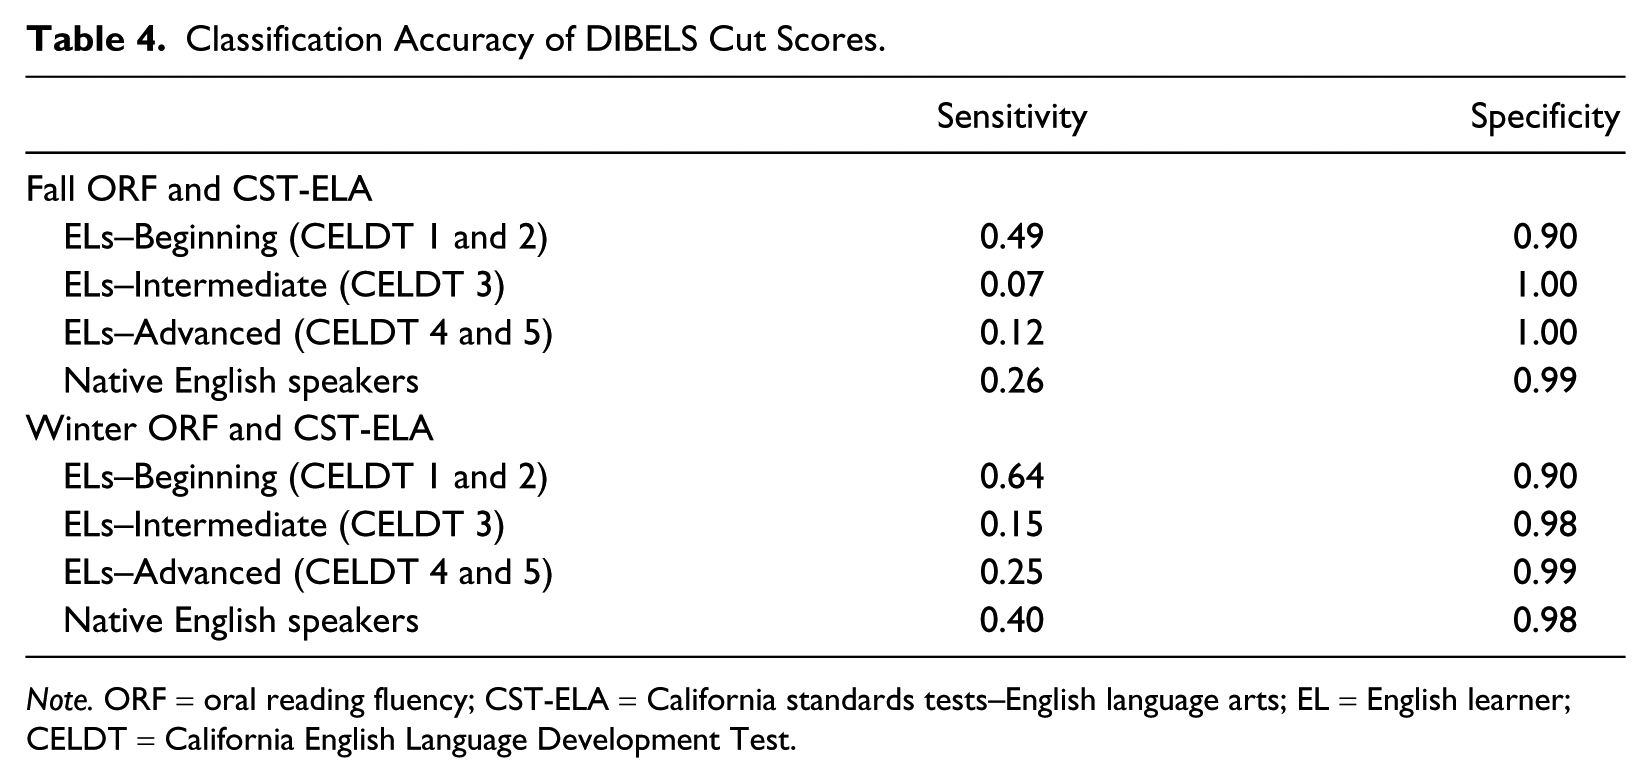
Note. ORF = oral reading fluency; CST-ELA = California standards tests–English language arts; EL = English learner; CELDT = California English Language Development Test.
After examining the predictive accuracy of the current DIBELS cut scores, the results of the ROC analyses were used to determine the cut scores of optimal classification accuracy for NESs and ELs at various levels of English proficiency. Following the recommendations as set forth in the recent screening literature (Johnson, Jenkins, & Petscher, 2010), sensitivity was set to .90 to minimize false negatives. The corresponding cut scores and specificity values for the time when sensitivity was set to .90 are displayed in Table 5. A wide range of cut scores was found depending on EL status and English language proficiency. These cut scores ranged from 60 to 110 WCPM for fall ORF and 83 to 110 WCPM for winter ORF. The corresponding specificity values ranged from .20 to .51 for fall ORF and .20 to .55 for winter ORF. The lowest cut scores were found for ELs with beginning English proficiency.
ORF Cut Scores and Specificity Values With Sensitivity Set at .90.

Note. ORF = oral reading fluency; CST-ELA = California standards tests–English language arts; EL = English learner; CELDT = California English Language Development Test.
Discussion
Conceptually, screening tools should allow educators to more efficiently allocate resources and target students who are most in need of supplemental services (Torgesen, 2002). Unfortunately, when an attempt is made to determine which screening tools are appropriate for ELs, it is almost impossible to make a research-based conclusion. Although there is a clear recognition that ELs who are at the beginning stages of English language development have a much different set of language skills than more advanced ELs, most research analyses lump all ELs together. The purpose of our study was to determine whether there were differences in predictive validity and accuracy of ORF within the EL group and also as compared with NESs.
Oral Reading Fluency is a Valid Predictor for English Learners
To determine the relationship between DIBELS ORF and CST-ELA, correlations were conducted across DIBELS administrations. Correlations were significant across the fall and winter administrations (r = .43 to .75), replicating previous research (e.g., Baker et al., 2008; McGlinchey & Hixson, 2004; Stage & Jacobsen, 2001; Wiley & Deno, 2005). The median winter screening correlation to the CST-ELA was .66 for ELs, which can be considered a strong relationship. The median percent of variance accounted for by the combination of fall and winter screening was 43%, which suggests that there are many any other factors that account for CST-ELA performance.
Within-Group and Between-Group (EL and NES) Differences Exist
By breaking the EL group into three separate subgroups, one subgroup stood out as having scores that were differently correlated to the primary outcome measure than the other two. The Intermediate subgroup had a significantly lower correlation between the winter ORF and the CST-ELA than the low and advanced English proficiency groups. In addition, the combination of the fall and winter ORF scores accounted for a substantially smaller portion of the variance of CST-ELA for the intermediate group than for the other two EL and the NES groups. In other words, for students with an intermediate level of English proficiency, a general outcome measure of reading is significantly correlated with later outcomes, yet the prediction of future performance for students in this group is less accurate than for other EL and NES students. It is also important to note that ORF was much more highly correlated and predictive for NES than for any of the EL subgroups.
ORF Cut Scores Should Be Used With Caution With ELs
The accuracy of the ORF at-risk label for CST-ELA outcomes was examined using ROC analyses. Specificity outcomes for all groups were excellent as each assessment was larger than .90, surpassing the Carran and Scott (1996) guideline of .80 or greater. Sensitivity scores were generally well below the guideline of .80. The low sensitivity scores reflect that a large proportion of students who do not pass the CST-ELA assessment are not labeled as at-risk. The group with the lowest sensitivity that could be most negatively affected by the cut scores are those who have intermediate English proficiency skills. The failure to accurately identify those students who do not pass the CST-ELA assessment could be due to several factors. One factor may be the dichotomization used in the at-risk analysis, which categorized students as at-risk and not at-risk. The not at-risk category is a combination of the some-risk and low-risk categories. The poor outcomes for those students in the some-risk grouping may have negatively affected the overall sensitivity.
To better understand the differences within the EL group and between EL and NES, a second set of ROC analyses were completed using a sensitivity of .90. The resulting adjusted benchmark scores, as seen in Table 5, are higher than the recommended ORF benchmark scores and add additional insight into the heterogeneity of the EL population. First, when sensitivity was set to .90, the range of scores produced for the EL subgroups is 50 points in the fall and 27 in the winter. Second, the produced cut scores for the intermediate and advanced groups are higher than that produced for NESs. Third, the only groups that come close to approximating the standards for specificity when sensitivity is set at .90 are the advanced EL subgroup in the winter and the NES groups in the fall and winter.
Limitations
There are several limitations to this study that must be considered when interpreting the results. The generalizability of the results is limited by several factors. First, convenience sampling was used as participants for this study were derived from one school district in Southern California. Second, the demographics of the sample may limit the generalizability of the results to students from a similar background (e.g., second-grade Spanish-speaking ELs). Third, although the schools had not implemented Tier II targeted interventions, information regarding what, if any, additional reading interventions were given to students was unavailable. The presence of intervention would have muddled the predictive relationship between the screening and outcome measures. Last, there are limitations associated with the strength of psychometric properties of the English proficiency measure used in this study. Specifically, content and construct validity of the CELDT was addressed by expert judgment during the test development process rather than comparing it with other measures of English proficiency.
Implications
Screening assessments provide a critical source of data to help educators best determine how to allocate resources; yet, there is no consensus about the best way to use these tools. One approach is to use a criterion-referenced decision-making system such as DIBELS. The advantage of using a criterion-referenced approach is that schools can theoretically allocate resources to those who most need help getting their skills to an appropriate level (i.e., criterion). Yet, defining the criterion (e.g., proficiency) is not a straightforward process given the recent movement to using large-scale assessments that are based on state-specific standards.
In one of the only other studies to conduct a diagnostic accuracy analysis with DIBELS, Roehrig and colleagues (2008) found that the cut scores needed to be lowered to increase the test’s predictive accuracy of the FCAT-SSS. We, however, found that an increase in DIBELS cut scores increased the test’s predictive accuracy of the CST. This is important information for schools whose goal is to get every student to the level their state considers proficient.
One of the most critical implications of this study is the finding that there are substantial and significant differences in the predictive validity and accuracy for students possessing varying levels of English proficiency. Specifically, ORF accounted for less variance and was more inaccurate in overall classification for students with an intermediate level of English proficiency than for other ELs and for NESs. There is a clear need for future studies that include ELs to clearly identify the English proficiency characteristics of their samples, and if possible, to conduct analyses that account for the impact of English proficiency level on the variables addressed by the research questions.
Footnotes
Declaration of Conflicting Interests
The author(s) declared no potential conflicts of interest with respect to the research, authorship, and/or publication of this article.
Funding
The author(s) received no financial support for the research, authorship, and/or publication of this article.