
Abstract
In an era of test-based accountability, there has been a renewed interest in understanding the relationship between test anxiety and test performance. The development and validation of test anxiety scales have grown with the rise of test anxiety research. Research is needed to critically examine the psychometric properties of these scales prior to widespread use. The purpose of this brief report is to demonstrate the use of latent profile analysis (LPA) to develop test anxiety profiles on the FRIEDBEN Test Anxiety Scale. LPA was performed using a sample of 1,133 students from five high schools in a Midwestern state. Results indicate three distinct test anxiety profiles (i.e., high, mid, and low anxiety profiles).
Introduction
Test-based educational accountability policies have fundamentally changed the definition of school success. Policies such as the No Child Left Behind Act emphasize the use of student test performance data in important educational decisions ranging from evaluations of teacher tenure to student promotion and graduation. These policies have led to numerous unintended consequences, including the increase of test anxiety (McDonald, 2001; von der Embse & Hasson, 2012). Clinical levels of test anxiety have been estimated in 10% to 40% of students (Segool, Carlson, Goforth, von der Embse, & Barterian, 2013), and students with disabilities, women, and minority students report even higher rates of test anxiety (Putwain, 2007; Sena, Lowe, & Lee, 2007; Zeidner, 1998). Test anxiety is associated with decreased academic performance, lower motivation and self-efficacy, and generalized anxiety (Hembree, 1988; King, Mietz, Tinney, & Ollendick, 1995; Putwain, 2007; Raffety, Smith, & Ptacek, 1997). Furthermore, without intervention and treatment, the negative effects of test anxiety may increase in severity over time (Swanson & Howell, 1996).
Test Anxiety Definition and Measurement
Test anxiety has been defined as behavioral, emotional, and physiological responses to perceived negative consequences following an exam (Zeidner, 1998). In contrast to traditional test anxiety scales, such as the Test Anxiety Inventory (TAI), which reflect a two-factor model of test anxiety, current research supports a multidimensional model of test anxiety. Lowe and colleagues have proposed a biopsychosocial model of test anxiety that includes biological (e.g., physiological arousal), psychological (e.g., emotional or cognitive factors), and social (e.g., parent pressure) factors in addition to task irrelevant behaviors (Lowe & Lee, 2008; Lowe et al., 2008). Unfortunately, contemporary scale development and validation has not caught up to these theoretical advances in test anxiety research.
There is a clear need for instruments that reflect current conceptualizations of the multidimensional nature of test anxiety. The most widely used test anxiety scales were developed more than 30 years ago (Spielberger, 1980) and may not be appropriate for an adolescent or child population (Wren & Benson, 2004). There are several promising test anxiety instruments based on a biopsychosocial model of test anxiety that have recently been developed (Friedman & Bendas-Jacob, 1997; Lowe, Grumbein, & Raad, 2011; Lowe & Lee, 2008; Wren & Benson, 2004). Typically, these scales have been studied using exploratory factors analysis (EFA) with one sample to identify relevant test anxiety factors, and confirmatory factor analysis (CFA) with a second sample to measure the consistency of factor identification so that it fits the hypothesized measurement model (Fabrigar, Wegener, MacCallum, & Strahan, 1999). This work is promising; however, there is a need for further research and validation of these scales. With few exceptions (Lowe & Ang, 2012), much of the scale development research has not been replicated across diverse samples. Furthermore, none of these measures provide criteria for classifying students’ test anxiety levels.
An important step to extending current scale development research is to focus on enhancing the utility of scales in common educational practice. One step toward meeting this goal is to identify unique profiles of test anxiety using existing instruments. There is limited research that examines test anxiety profiles (e.g., high versus low on multiple subscales) in relation to test performance that can be used to classify student test anxiety (Segool et al., 2013). Latent profile analysis (LPA) techniques offer an important advancement in scale development research by identifying clusters of observations that have similar values on set indicators (i.e., individuals with different profiles of test anxiety). This is the first study to use LPA techniques to identify unique profiles on a biopsychosocial test anxiety scale. LPA solutions were examined to (1) differentiate unique profiles of test anxiety and (2) to examine differences in achievement using these profiles.
Methods
Sample
High schools were selected as a convenience sample based on their willingness to be involved in the research and proximity from the local university. All students who were eligible to take the Midwest Merit Exam 1 (MME, annual state exam) were invited to participate. The MME is a criterion-referenced test, taken over three school days, that measures students’ skills in core content areas and consists of American College Test (ACT®) plus writing, and state-specific Mathematics, Reading, Writing, Science, and Social Studies subtests. The current sample includes 1,133 11th grade students from five high schools (total population of 1,650 for a participation rate of 69%). There were 579 females, 537 males, and 17 responses with unknown gender. The racial composition of the sample was 79.9% Caucasian, 3.4% Hispanic, 2.7% Asian, 3.5% African American, 1.1% Native American, and 7.8% Multiracial. In addition, 9.6% of students received special education services, 5.4% received gifted education services, and 29.3% reported receiving free or reduced lunch. Chi-square analyses indicated no significant differences between the demographics of the sample and school population for each of the five schools.
One hundred thirty-eight students were excluded from the current study (data were collected on 1,271 students), including students taking the alternative assessment (which is designed for students with severe cognitive disabilities), students who did not complete at least 10% of the total survey items, and students who provided an unusual response pattern (e.g., filled in all Cs on the survey). Analyses revealed that the current sample performed significantly better on the ACT Composite and MME subtests than those students who were excluded.
Measures
Test anxiety
The FRIEDBEN Test Anxiety Scale (FTAS) was used to measure test anxiety (Friedman & Bendas-Jacob, 1997). The FTAS is a 23-item Likert-type scale that includes a global biopsychosocial measure of test anxiety comprised of three subscales: Social Derogation (SD), Cognitive Obstruction (CO), and Physiological Tenseness (PT). SD measures concern over public embarrassment or social belittlement following test performance. CO measures concentration, information recall problems, and difficulties in problem solving. The PT subscale measures bodily discomfort associated with the testing experience. Reliability and validity evidence for the FTAS had been obtained using a sample of nearly 2,000 students from high schools and junior high schools. Internal consistency estimates of reliability were 0.91 for total scores and .86, .85, and .81 for each of the three subscales, respectively (Cizek & Burg, 2006). Concurrent validity was examined in relation to the TAI and found to be an acceptable .84 and .82 (Friedman & Bendas-Jacob, 1997).
Test performance
Performance was defined as scaled scores on the multiple-choice MME subtests and ranged from 950 to 1,250.
Data Collection Procedures
The FTAS was administered 1 week prior to the MME by school administrators and teachers who used standardized administration procedures. Prior to survey administration, student assent was solicited; students were informed that individual data would be confidential. Students were also informed that they had the right to decline participation.
Data Analysis
A total of 1,133 participants were included in the LPA. LPA, a specific case of finite mixture modeling, classifies individuals into homogeneous groups based on their scores across multiple continuous variables (Lazarsfeld & Henry, 1968). Analyses were conducted in Mplus 7 (L. K. Muthén & Muthén, 1998-2012). Generally, the model selected as the best representation of the data has the lowest Bayesian Information Criterion (BIC), Adjusted BIC, and Akaike Information Criterion (AIC; Hix-Small, Duncan, Duncan, & Okut, 2004); a high entropy value (Hix-Small et al., 2004); and utility in practice (B. O. Muthén & Muthén, 2000; Nagin, 2005). A Lo Mendell Rubin Likelihood Ratio Test (LMR LRT; Beyers & Seiffge-Krenke, 2007) was used to compare fit between models. Furthermore, additional latent profile analyses were used following the identification of test anxiety profiles to examine the predictive ability of the ACT and MME subtests on profile membership.
Results
Two to four profile models were evaluated. A five-profile model was initially tested; however, it did not converge and was not considered a viable model. Table 1 contains the BIC, Adjusted BIC, Entropy, and LMR LRT values for the three models tested. Table 2 contains the average latent class probabilities for most likely latent class membership by latent class. Considering established criteria, a three-profile model best represented the data. The three-profile model had the second lowest BIC, Adjusted BIC and AIC values, a moderate entropy value, and a statistically significant LMR LRT value. While the four-profile model had lower BIC, Adjusted BIC, and AIC values, the LMR LRT was not statistically significant. In addition, the three-profile model identified within the present study is consistent with test anxiety profiles among college students identified by Pastor and colleagues (2007).
Fit Indices and Profile Prevalence (%) of the Latent Profile Analyses (N = 1,133).
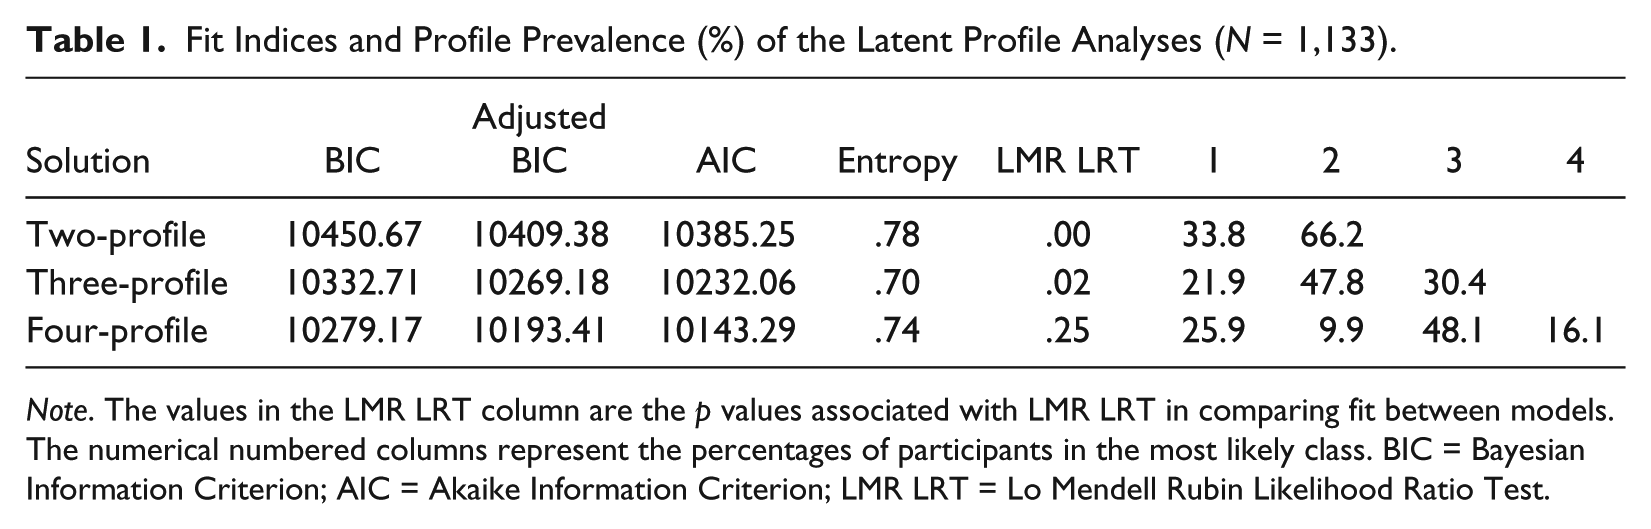
Note. The values in the LMR LRT column are the p values associated with LMR LRT in comparing fit between models. The numerical numbered columns represent the percentages of participants in the most likely class. BIC = Bayesian Information Criterion; AIC = Akaike Information Criterion; LMR LRT = Lo Mendell Rubin Likelihood Ratio Test.
Average Latent Class Probabilities for Most Likely Latent Class Membership (Row) by Latent Class (Column).

Note. The columns refer to the latent class, and the rows refer to the most likely profile membership.
The three-profile model (see Figure 1) included the following profiles: Profile 1 (Low Anxiety Profile; 21.9%; n = 248), Profile 2 (Mid Anxiety Profile; 47.7%; n = 541), and Profile 3 (High Anxiety Profile; 30.4%; n = 344). Low Anxiety had the lowest SD, CO, and PT values across the three profiles. Within the Low Anxiety Profile, SD was the lowest, followed by PT and then CO. Members of the Mid Anxiety Profile reported the second lowest scores on SD, CO, and PT values across the three profiles, and, within the Mid Anxiety Profile, CO was the lowest, followed by SD and PT. Finally, the High Anxiety Profile reported the highest levels of SD, CO, and PT across the three profiles. Within the High Anxiety Profile, PT was significantly higher compared with the scores on SD and CO.

Three profiles of test anxiety.
Furthermore, analyses demonstrated performance on a high-stakes achievement test differentially predicted the three profiles (see Figure 2). MME Math performance differentially predicted the High Anxiety (B =.01, eb = 1.01, p = .004) and Mid Anxiety (B =.01, eb = 1.01, p = .03) members from the Low Anxiety members. For every one unit increase in MME Math performance, the likelihood of being a member of the Low Anxiety profile increased by 1.3% and 1.1% compared with the High Anxiety and Mid Anxiety profiles, respectively. MME Reading, MME Science, MME Social Studies, and MME Writing were all significant predictors of profile members in High Anxiety and Mid Anxiety from Low Anxiety members; the range of predictive power was between 1% and 2% per unit of performance. Similar to the MME subtests, ACT performance differentially predicted the High Anxiety (B =.09, eb = 1.09, p < .001) and Mid Anxiety (B = .04, eb = 1.08, p = .003). While the increase in likelihood of profile membership ranged from 8% to 9% per unit of performance, scale scores were different on the ACT (1-36) and MME (950-1,250).
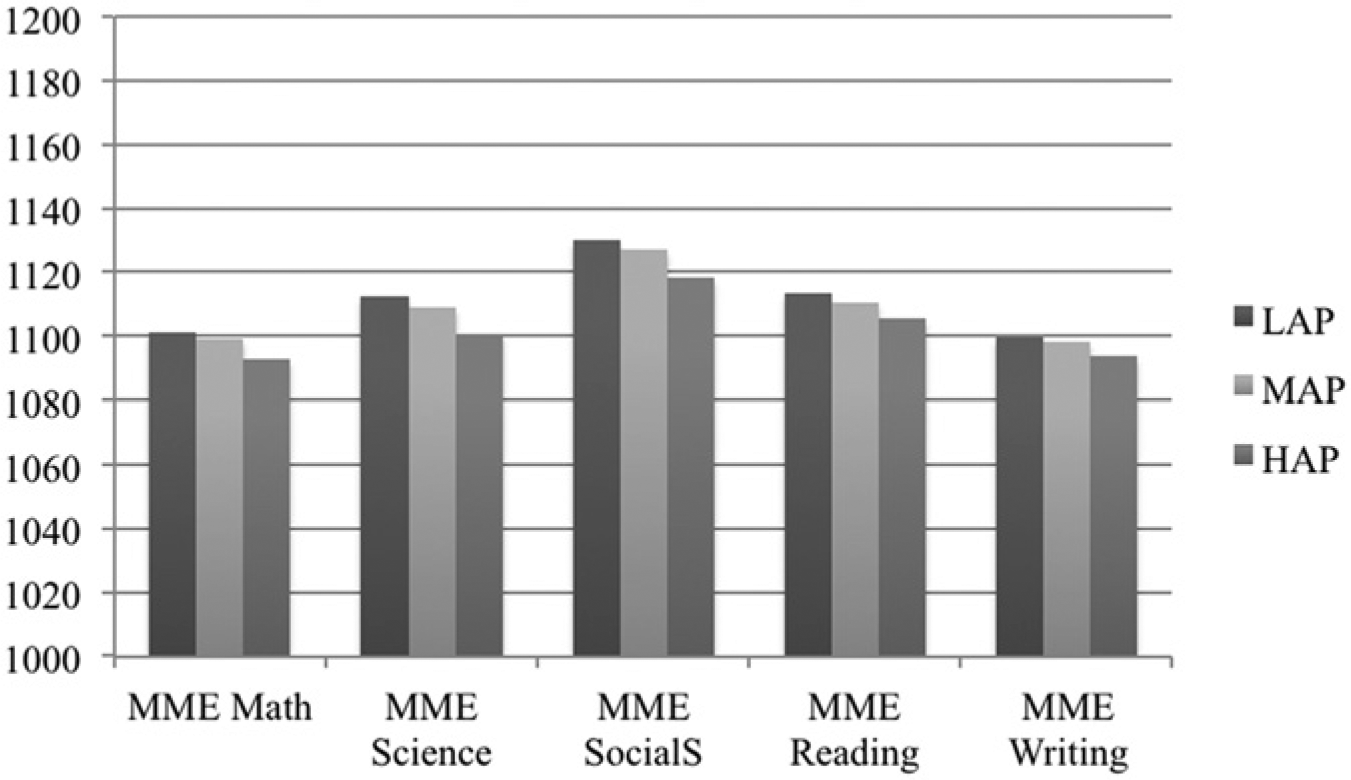
MME subtest performance by test anxiety profile.
Discussion
Test-based accountability policies have increased the importance of student test performance. Educators need to assess any factor that may impede test performance, including test anxiety. The purpose of this pilot investigation was to add to the extant test anxiety scale development literature by utilizing an advanced statistical technique to identify test anxiety profiles on a widely used test anxiety instrument. The three identified profiles have several implications for test anxiety measurement and use in practice. First, data from this study support recent theoretical advances in test anxiety. For example, the biopsychosocial model (Lowe & Lee, 2008) proposes multiple aspects of test anxiety beyond a total score; in this study, three unique profiles using several indicators of test anxiety (social, cognitive, and physiological) were identified.
Second, the use of LPA techniques demonstrated the value of profile analysis when considering the multidimensional nature of test anxiety. Future scale development, and the utility of current test anxiety assessments, may be strengthened by using LPA to identify unique groupings of individuals. Researchers and practitioners may consider the use of these profiles, in addition to total score, when using the FTAS to identify those individuals who may be experiencing significantly elevated test anxiety. Additional research is needed with new test anxiety scales (e.g., Test Anxiety Scale for Elementary Students [TAS-E], Lowe & Ang, 2012; Children’s Test Anxiety Scale [CTAS], Wren & Benson, 2004) to determine the utility of profile analysis for identification of clinically significant groupings and relationship with test performance.
Finally, differences in performance as predictors of profile membership further illustrate the potential utility of profile identification for intervention design and implementation. The finding that 30% of students who comprised the High Anxiety Profile performed significantly lower on the ACT composite and MME Math, Science, Social Studies, and Reading subtests suggests that test anxiety interventions may be especially warranted for these students. Future research should examine the efficacy of interventions targeting students with different test anxiety profiles. That is, students with different profiles may respond differently to interventions (von der Embse, Barterian, & Segool, 2013).
It should be noted that there are several limitations within the present study. The LPA utilized within the present study was exploratory and replication is needed to confirm the identified profiles. Although large, the sample was representative of only five schools in one Midwestern state and these results need to be replicated in other populations. Furthermore, replication of the performance findings that indicate High Anxiety Profile students experience performance impairments on high-stakes standardized achievement assessments is needed. As further test anxiety profile development and validation occurs, it will be important to consider the validity of the three identified profiles across multiple samples/test anxiety assessments and the practical utility of the identified profiles in predicting student performance.
Footnotes
Declaration of Conflicting Interests
The author(s) declared no potential conflicts of interest with respect to the research, authorship, and/or publication of this article.
Funding
The author(s) received no financial support for the research, authorship, and/or publication of this article.