
Abstract
The Woodcock–Johnson Tests of Cognitive Ability Third Edition is developed using the Cattell–Horn–Carroll (CHC) measurement-theory test design as the instrument’s theoretical blueprint. The instrument provides users with cognitive scores based on the Cognitive Performance Model (CPM); however, the CPM is not a part of CHC theory. Within the instrument’s Technical Manual the authors provide some information about the CPM; however, the structural/theoretical support for the validity of the CPM is limited. Recent research found empirical support for the CPM as intermediate factors within Carroll’s three-stratum theory of intelligence. The results from the present study also provide empirical support of the CPM as intermediate factors lying between the second- and third-strata of a CHC-based theoretical model. In addition, a previously unidentified research-based two-factor CPM is identified as the best-fitting model among several competing CPM.
The revision of the Woodcock–Johnson Tests of Cognitive Abilities III (WJ III COG) represents the third edition of this comprehensive battery that measures general intelligence, broad and specific cognitive abilities, and academic achievement (Woodcock, McGrew, & Mather, 2001). One of the main strengths of the WJ III COG is that it was developed using a theoretical model based on the contributions of John Carroll’s three-stratum theory of intelligence (Carroll, 1993; 1997) and Cattell and Horn’s Extended Gf/Gc theory of approximately eight broad cognitive abilities (Horn, 1965; 1994). The integration of the two similar models under a single umbrella is now typically referred to as Cattell–Horn–Carroll (CHC) theory (McGrew, 2005; Schneider & McGrew, 2012), which many believe is the most empirically supported and theoretically sound model of the structure of human cognitive abilities (Ackermann & Heggestad, 1997; McGrew, 2009; Schneider & McGrew, 2012; Stankov, 2000).
The structure of the integrated CHC model is hierarchical in nature. It contains three levels, the first of which includes approximately 70 narrow cognitive abilities. These narrow abilities are in turn subsumed by about 9 broad abilities at the second level of the hierarchy. At the top or third level of the theoretical model is the general factor of intelligence (g).
Within the WJ III COG’s Technical Manual, the authors present the results of several studies examining the external and internal validity of the instrument. These comprise convergent validly studies between the WJ III COG and several widely used tests of intelligence including the Cognitive Assessment System (Naglieri & Das, 1997), Differential Ability Scales (Elliott, 1990), and the Stanford–Binet Intelligence Scale: Fourth Edition (Thorndike, Hagen, & Sattler, 1986). Results of confirmatory factor analyses of the CHC measurement model at five age-differentiated levels (McGrew & Woodcock, 2001) are also presented within the instrument’s Technical Manual. Taub and McGrew (2004) tested the configural and metric invariance of the WJ III COG’s CHC factor structure across the instrument’s five age groups. 1 Taub and McGrew reported strong support for the interpretation of metric invariance and the stability of the CHC factor structure across the WJ III COG’s wide age range (age 6 to over 90 years of age).
Despite strong structural or internal validity evidence for the WJ III COG’s CHC measurement model, the authors supplemented the CHC measurement-theory test design blueprint by providing clinicians the opportunity to interpret an individual’s performance on the seven broad CHC factors within the framework of a Cognitive Performance Model (CPM; Woodcock, 1997).
The CPM combines scores from the WJ III COG into one of three broad CPM clusters or factors: Cognitive Efficiency, Thinking Ability, and Verbal Ability. Within the CPM, Cognitive Efficiency scores account for variance associated with information processing efficiency. The Thinking Ability factor scores account for performance on tasks requiring problem solving, reasoning, and complex executive functions. The Verbal Ability factor scores reflect an individual’s acquired knowledge. Although potentially beneficial, there is currently little empirical support for the factor structure of the CPM’s theoretical framework. Conceptually, the CPM factors may be considered to be consistent with Carroll’s (1993) suggestion that certain intermediate-level abilities may lie between adjacent strata. In this case, the CPM factors would be viewed as representing factors lying between the broad (stratum II) and general (stratum III) abilities.
Keith (1997) tested the fit of the three CPM clusters scores as intermediate factors within Carroll’s theory. In this study, an early version of the CPM was fit to data from the standardization sample of the predecessor of the WJ III COG, the Woodcock–Johnson Tests of Cognitive Abilities–Revised (Woodcock & Johnson, 1989). Keith reported that the inclusion of the intermediate CPM factors within Carroll’s three-stratum theory provided a statistically significant improvement in fit when compared with the Carroll model without intermediate-level factors. This finding provided support for the possible existence of intermediate factors within Carroll’s theory (Keith, 1997). More recently, Keith (2005) tested competing CPM using 22 tests from the Woodcock–Johnson test battery (WJ III). Keith’s (2005) first CPM included Cognitive Efficiency and Thinking Ability as intermediate factors within the CHC model. The Verbal Ability factor was not included in this model because the CPM’s Verbal Ability factor and the second-order broad CHC factor, Crystallized Intelligence, are indistinguishable (i.e., Crystallized Intelligence was the only factor loading on the CPM’s Verbal Ability cluster). Keith found the categorization of Cognitive Efficiency and Thinking Ability as intermediate factors within the CHC theoretical model resulted in an improvement in the model’s fit, when compared with the CHC model without intermediate CPM factors. Keith further noted that within this model, the Thinking Ability factor and g were indistinguishable (the path coefficient from the Thinking Ability factor to g was not statistically different from 1.00). In this model, Keith removed the Thinking Ability factor because it was found to be indistinguishable from g. In this new simpler model, processing speed and short-term memory loaded on the intermediate Cognitive Efficiency factor (both the Verbal Ability and Thinking Ability factors were excluded from the analysis). Keith found that this parsimonious one-factor CPM model provided the best fit to the data. The results from Keith’s analyses indicated the data from the WJ III’s normative sample did not support the CPM’s Thinking Ability and Verbal Ability factors as intermediate cognitive factors.
The purpose of the present study is to replicate and test the fit of Keith’s (2005) two-factor CPM and parsimonious one-factor CPM with a competing new research-based three-factor CPM. The purpose of these analyses is to determine if the normative data from the WJ III support the existence of a one-, two-, or three-factor CPM, as intermediate factor(s) within the traditional CHC theoretical model.
Method
Participants
The participants for this investigation included two age-based groups from the standardization of the WJ III batteries. The WJ III standardization sample was stratified to control for 10 individual and community variables described by the United States Census projections for the year 2000. The total standardization sample of the WJ III consists of five age-based groups. 2 In the present study, two of the five age-based samples were used. The 9 to 13 age group (n = 2,241) served as the calibration sample and the 14 to 19 age group (n = 1,642) served as the validation sample. Together these samples roughly represent children from upper elementary through high school. Participants in 9 to 13 age group represent the same portion of the standardization sample used in Keith’s (2005) study.
Instruments
All measures included in this study were from the WJ III test batteries. The development, psychometric properties, and standardization of these test batteries have been evaluated favorably (Cizek, 2003; Sandoval, 2003; Taub & McGrew, 2004). Although it is possible to identify the models tested in this study using two indicators per factor, standard factor analytic rules-of-thumb require at least three indicators per factor to properly identify a factor model (Floyd & Widaman, 1995). In an effort to ensure adequate construct representation, this study used 17 tests from the WJ III COG, 1 test from the WJ III Tests of Achievement (WJ ACH; Woodcock et al., 2001), and 3 tests and 1 special composite from the WJ III Diagnostic Supplement (Woodcock, McGrew, Mather, & Schrank, 2003). The special composite, Numerical Reasoning, is a combination of two tests, Number Series and Number Matrices. These 22 measures provided a minimum of three indicators for each of the 7 CHC broad cognitive ability factors. The reader is referred to the instrument’s technical manuals for a description of each of these indicators.
Analysis
This analysis was carried out in two phases. The calibration phase was an exploratory model generation procedure. The purpose of the calibration phase was to (a) find the best fitting CPM model and (b) test this model against Keith’s one- and two-factor CPM. The second phase of the study is the validation phase. In this phase, the best-fitting CPM from the calibration phase was validated in an independent sample. Data for the calibration phase were the correlations and standard deviations for the 9 to 13 age group. The data included in validation phase were the correlations and standard deviations for the 14 to 19 age group. The correlation and standard deviations for each of the two age groups were converted into covariance matrices via the Structural equation modeling (SEM) program (matrices are available from the second author by request). SEM was used for all analyses via the AMOS program (Arbuckle & Wothke, 2004). Correlations and standard deviations were calculated via the missing values subprogram for the Statistical Package for Social Sciences; the matrix was estimated using the expected-maximization algorithm in the presence of incomplete data (Schafer & Graham, 2002).
Results from simulation studies suggest that multiple fit indices should be used when evaluating model fit (Fan & Sivo, 2007). While some fit indices provide redundant information (Meade, Johnson, & Braddy, 2008), several types of fit indices have been developed, each reflecting different facets of model fit. Based on the substantive research questions and probable sources of bias, researchers should select an adequate set of indices for examining model fit (Miles & Shevlin, 2007). The indices utilized in this study included the Akaike information criterion (AIC), the comparative fit index (CFI), the change in chi-square value (Δχ2), and the root mean square error of approximation (RMSEA).
The same measurement model is used in all analyses within the study, only the structural model (endogenous factors) is modified across models tested. The statistical significance of each model was tested via the obtained chi-square. Kline (2005) indicates that two models are nested if “one is a subset of the other” (p. 131). The difference between models tested in the present study consists of the addition or deletion of one or more intermediate factors (structural model) within a single hierarchical model; as such the models tested in this study are considered nested. The change in chi-square value (Δχ2) between competing models was used to evaluate the best-fitting model. Prior research investigating the factor structure of the WJ COG used the differential fit value (DFV) to account for inflation of the χ2 due to sample size (Taub & McGrew, 2004). 3 The DFV is a conversion of the χ2 based on sample size of 1,000. Because the sample size in the present study is considered large (n = 2,241), the DFV conversion of the χ2 was used to evaluate all models.
Model 1
The first model tested is the traditional CHC-based measurement model which is presented in Figure 1. The traditional CHC-based measurement model is hierarchical in nature and contains seven second-order CHC-based broad ability factors and a third-order general factor of intelligence at the apex.
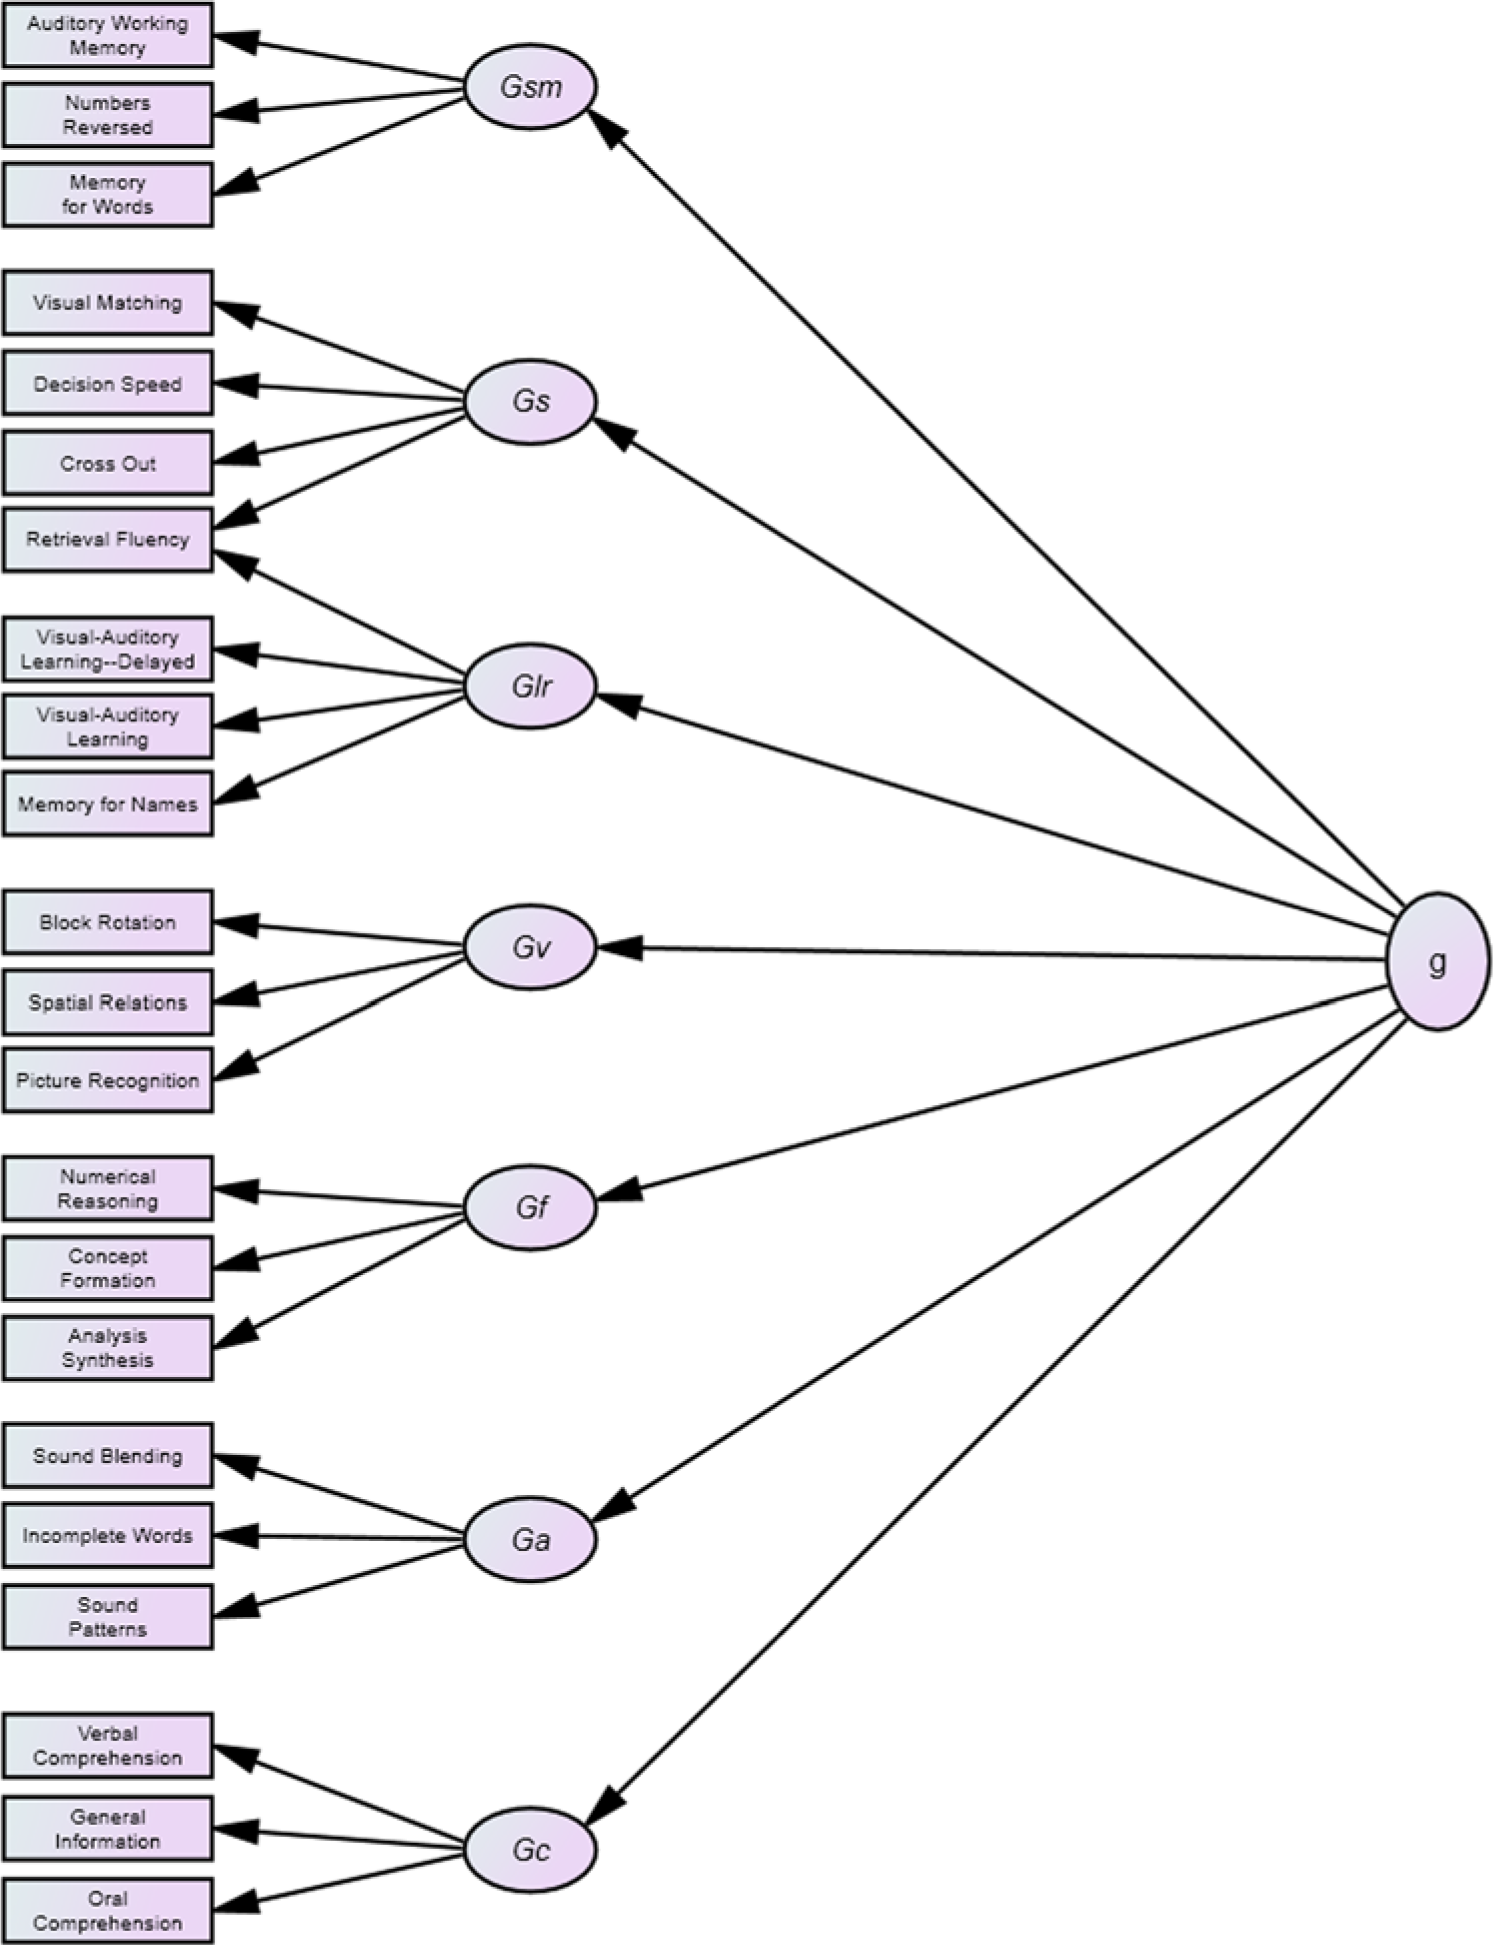
The factor structure of the Cattell–Horn–Carroll theory of intelligence.
Model 2
Model 2 presented in Figure 2 is the traditional CPM model, which includes two Cognitive Performance factors as intermediate factors lying between the second- and third-order factors within the traditional CHC-based measurement model. It is worth noting that although the WJ COG Technical Manual (McGrew & Woodcock, 2001) presents the traditional CPM as a three-factor model, only two factors were included in the present analyses. The Verbal Ability factor was eliminated from Figure 2 because it is an intermediate latent variable with only one indicator, Crystallized Intelligence (Gc). Thus, the variance accounted for by Verbal Ability in Model 2 is isomorphic with second-order broad CHC factor, Gc.

The factor structure of the Cognitive Performance Model.
Model 3
Model 3 is presented in Figure 3. This model is a replication of Keith’s (2005) parsimonious one-factor CPM wherein the Thinking Ability and Verbal Ability factors are subsumed by the third-order general ability factor.

The factor structure of the one-factor Cognitive Performance Model.
Model 4
Model 4 as presented in Figure 4 is similar to Model 2 with two differences. First, Model 4 includes the CPM factor, Verbal Ability. To provide adequate construct representation of Verbal Ability in Model 4, a second indicator was added, Auditory Processing (Ga). In this model, the variance accounted for by the broad CHC factor Ga was moved from the CPM Thinking Ability factor to the CPM Verbal Ability factor. This research-based model was tested for two reasons. First, Model 4 is theoretically consistent with Carroll’s (1993) analyses wherein phonetic code, a narrow auditory processing ability, is identified as a narrow verbal (Gc) and auditory processing (Ga) ability. Second, an inspection of the correlations between the WJ III tests measuring Ga abilities with Verbal and Thinking abilities revealed stronger relations with the former. For example, Sound Blending has a stronger relation with Verbal Comprehension (.44) when compared with Concept Formation (.36), Analysis Synthesis (.29), Visual–Auditory Learning (.32), and Spatial Relations (.27). This pattern was generally consistent across all tests measuring Ga, and the CPM Thinking and Verbal ability factors.

The factor structure of the research-based three-factor Cognitive Performance Model.
Model 5
Model 5, which is not pictured, is a hybrid model. In this model, Ga shares variance with Thinking and Verbal ability. Thus, Model 5 incorporates the traditional placement of Ga as a component of Thinking Ability (Figure 2) and a component of Verbal ability as presented in Figure 4.
Model 6
Model 6 (Figure 5) is similar to Model 4; however, in Model 6 the intermediate CPM factor Thinking Ability is considered isomorphic with the third-order g factor.

The factor structure of the parsimonious research-based three-factor Cognitive Performance Model.
Results
Calibration Phase
The traditional CHC-based measurement model (Model 1; Figure 1) was the first model tested. This model served as the base model to compare the fit of the traditional CPM, Model 2 (Figure 2). As presented in Table 1, the inclusion of scores on the intermediate CPM factors within a CHC-based model produced a statistically significant decrease in χ2 and improvement in the goodness-of-fit indices. This was interpreted to suggest that the addition of intermediate CPM factors within a traditional CHC theoretical framework (Model 2) provided an improvement in overall fit when compared with the traditional CHC-based measurement model (Model 1). These findings were consistent with Keith’s (2005) CPM results.
Comparison of the Fit Between CPM Models Testing Various Intermediate Factors Between Stratum Two and Stratum Three in the CHC Theory of Intelligence.
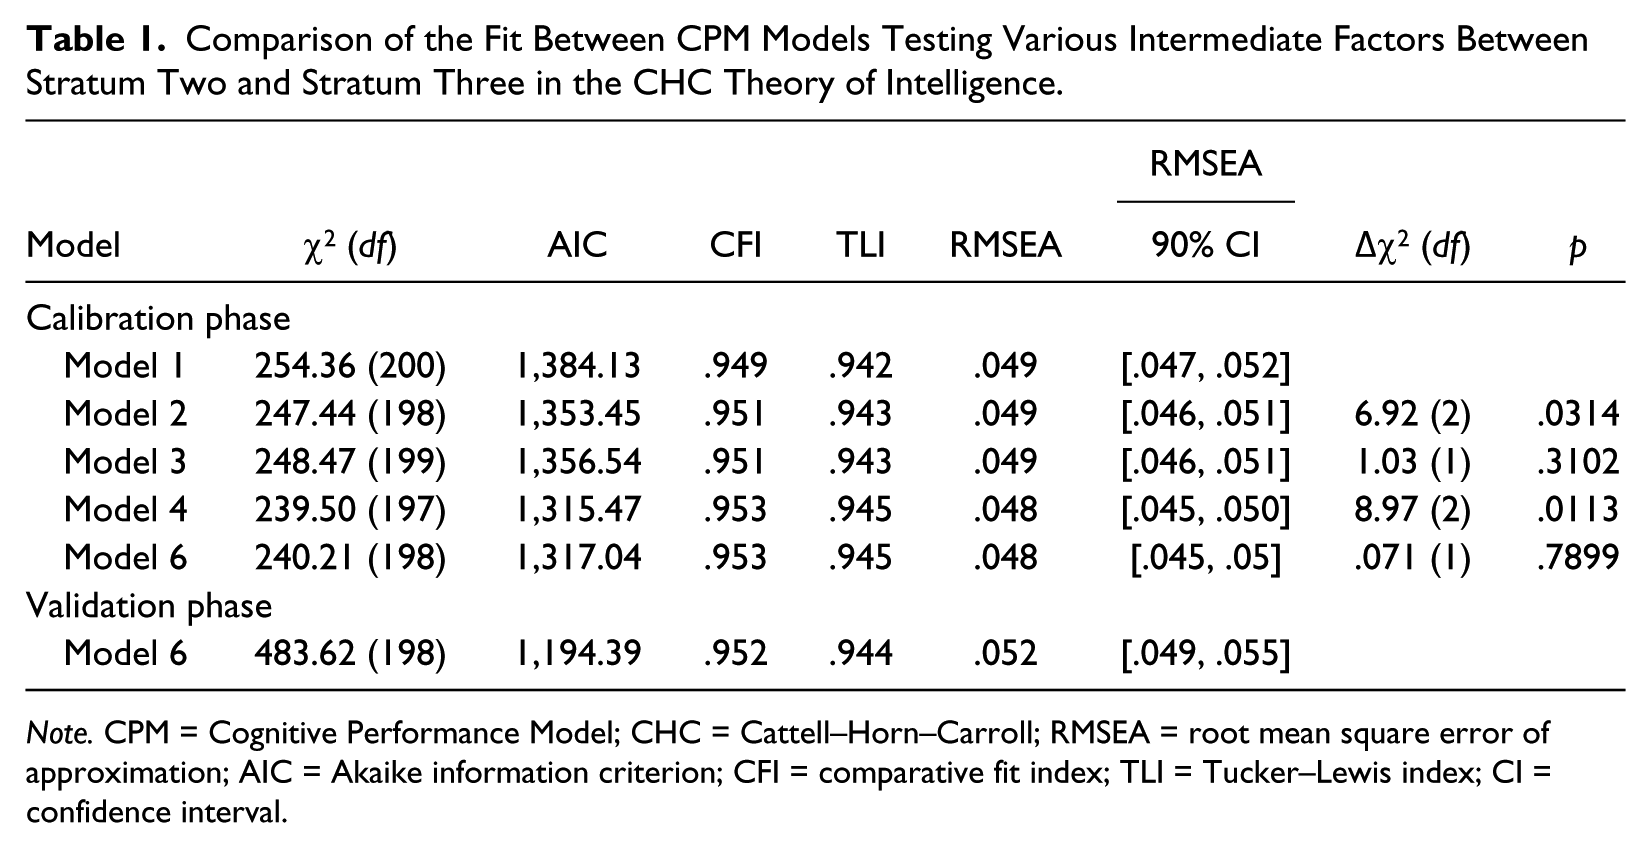
Note. CPM = Cognitive Performance Model; CHC = Cattell–Horn–Carroll; RMSEA = root mean square error of approximation; AIC = Akaike information criterion; CFI = comparative fit index; TLI = Tucker–Lewis index; CI = confidence interval.
The second set of analyses tested the fit of competing CPM-hypothesized models. The first analysis compared the fit of Keith’s parsimonious one-factor CPM (Model 3; Figure 3) with the traditional CPM (Model 2; Figure 2). In Model 3, scores for the Verbal Ability and Thinking Ability factors were subsumed by g. As indicated in Table 1 and consistent with Keith (2005), a non-statistically significant increase in the Δχ2was identified. The finding of a non-significant increase in chi-square for a more parsimonious model indicated the parsimonious model, Model 3, provided the best fit to the data.
The next analysis compared the fit of the new theoretical three-factor CPM (Model 4; Figure 4) with Keith’s (2005) one factor CPM (Model 3; Figure 3). As presented in Table 1, the results indicate a statistically significant decrease in chi-square and an overall improvement in the goodness-of-fit indices. This indicated that the new previously unidentified three-factor CPM (Model 4; Figure 4) provided the better fit to the data.
Model 5 was a combination of the traditional CPM in which Ga shares variance with Thinking Ability (Model 2; Figure 2) and Model 4 (Figure 4), wherein Ga shares variance with Verbal Ability. The analysis of scores within Model 5 resulted in a negative path coefficient between Ga and Thinking Ability. Negative standardized path coefficients are outside the theoretical boundaries of permissible values, thus Model 5 was rejected as a plausible model.
Model 6 (Figure 5) was developed after a visual inspection of Model 4 revealed a standardized path coefficient of .98 between the intermediate CPM factor Thinking Ability and the third-order g factor. Such a high path coefficient may indicate that Thinking Ability scores are isomorphic with g. Model 6 tested this possibility by eliminating the Thinking Ability factor from the model. As presented in Table 1, a comparison of the Δχ2 between Model 4 and Model 6 resulted in a non-statistically significant increase in the Δχ2. A non-statistically significant increase in chi-square, within a more parsimonious model, indicated the parsimonious model provided the best fit to the data.
Validation Phase
The best-fitting CPM identified in calibration (Model 6; Figure 5) was validated on an independent sample (i.e., the 14-19 age group) during the validation phase of the study and is presented in Figure 6. The results from this analysis are presented in Table 1 under Validation Phase, Model 6. As presented in Table 1, there was some degradation in the fit of the scores from the validation model compared with the calibration data set. This is not unexpected as the development of models that make use of exploratory model-generation procedures typically capitalize on sampling error and typically show poorer fit when cross-validated in an independent sample. The purpose of validation in the present study is to validate the finding from the calibration phase on an independent data set. Although the change in model fit was relatively small, the results did raise concern regarding the generalizability of Model 6 as the best-fitting model. To ensure the results were generalizable across samples, an a priori decision was made to test the fit of scores from the validation sample to Model 4 and compare the Δχ2 across models. The result from this analysis was similar to the result within the calibration sample, Model 6 provided a small (.45) non-statistically significant increase in chi-square (p = .50).
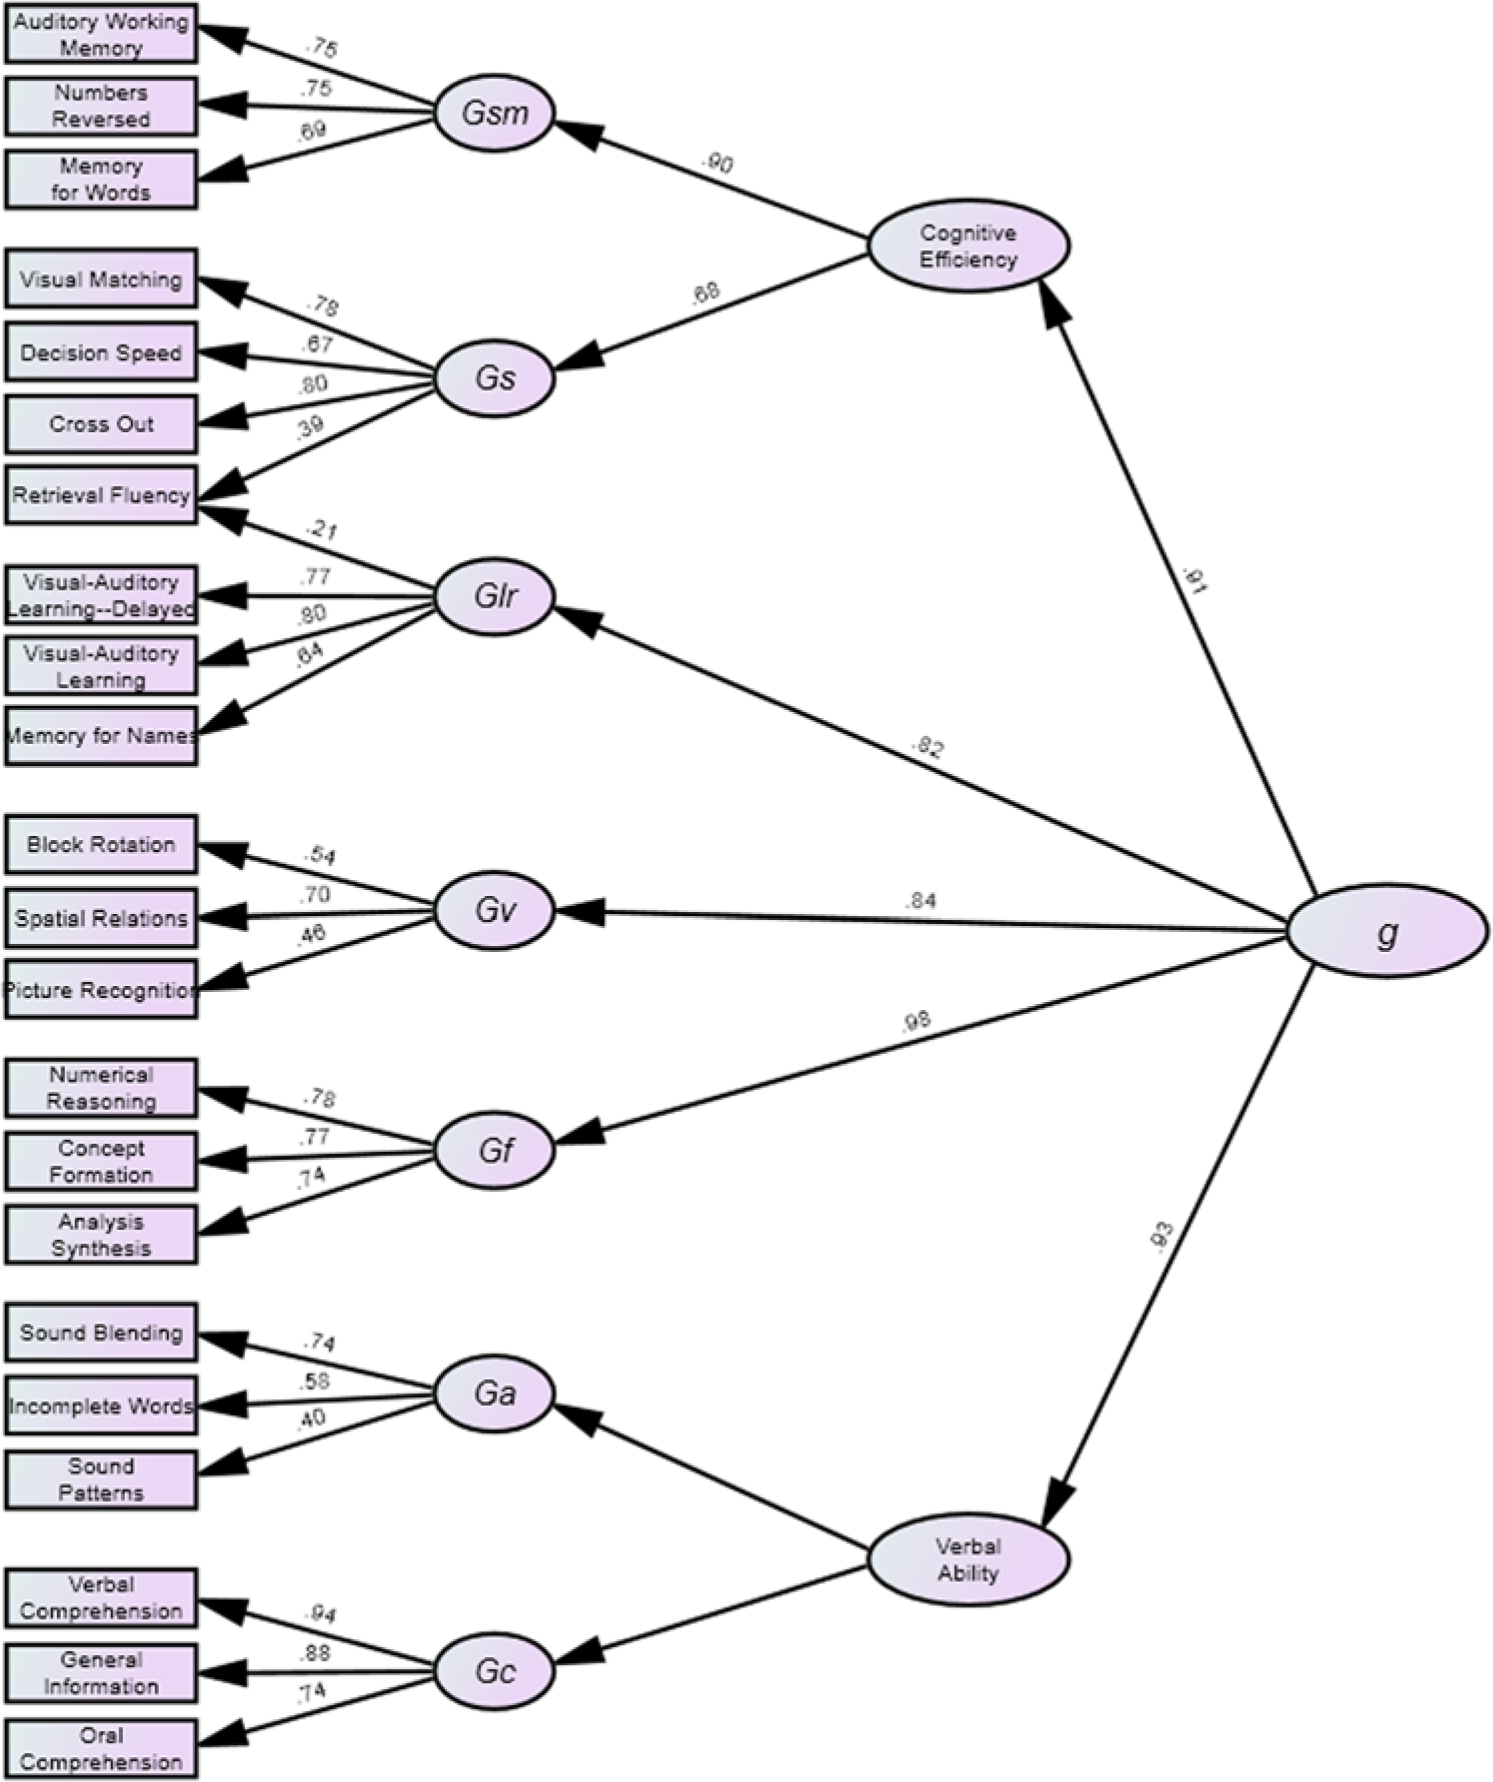
The factor structure and standardized path loadings of the cross-validated parsimonious research-based three-factor Cognitive Performance Model.
To further test the efficacy of Model 6 as the best-fitting model and most parsimonious model, another set of analyses tested the fit of scores from the validation sample to Model 3 with the Ga tests cross-loaded with the second-order Gc factor. The purpose of this analysis was to determine if the cross-loadings of the Ga tests observed in Model 6 were due to test specificity (i.e., improvement in model fit was due to one of the three tests) or if the results would generalize to most Ga tests. The results of this analysis found that all three tests individually provided an improvement in model fit; however, the Δχ2 was statistically significant for only two of the three Ga tests (i.e., Sound Blending (p < .001) and Incomplete Words (p < .001). The Sound Pattern test did provide a statistically significant improvement in fit over the Sound Blending test alone (p = .04), but not in combination with the Incomplete Words test (p > .05). When the three Ga tests together were cross-loaded with Gc, there was a statistically significant improvement in model fit (p < .001). The results from this analysis indicate that the Ga and Gc tests are almost always intertwined which provided further support for the intermediate Verbal factor in Model 6.
Discussion
The WJ III COG provides an operational measurement model of human cognitive abilities based on the CHC Theory of Cognitive Abilities. The WJ III authors present empirical evidence for the CHC structural validity of the WJ III COG battery across five broad age groups. Yet, little empirical information was provided to assist practitioners in understanding or interpreting scores based on the instrument’s proposed supplemental CPM framework. Keith (1997; 2005) conducted analyses to investigate the CPM as intermediate factors lying between the second and third strata of a three-stratum model (i.e., CHC theory and Carroll’s three-stratum theory). Although the authors of the WJ III COG provide scores for a theoretical three-factor CPM, Keith’s research found that a CPM consisting of just one factor (Model 3) provided the best fit.
The current investigation focused on two important aspects of the WJ III COG’s CPM. First, the current investigation replicated Keith’s findings supporting Carroll’s hypothesis of intermediate (CPM) factors lying between the second and third strata of a three-stratum theory of intelligence. Second, the present investigation specified and evaluated a new research-based theoretical CPM in an independent data set.
The results from this study replicated and supported Keith’s (2005; 1997) research, wherein the existence of intermediate factors within a three-stratum theory of intelligence was first identified. The replication and finding of empirical support for the existence of intermediate factors within the CHC theoretical model suggests that researchers may need to account for the existence of intermediate factors within the CHC theoretical framework.
It is worth noting, that all models provided an improved fit over Model 1, the traditional CHC-based theoretical measurement model. This indicates that the inclusion of intermediate factors within a traditional CHC theoretical model provides an improvement in overall model fit.
The results also provided support for a new two-factor research-based CPM (Model 6) as the best-fitting model. In addition, a priori analyses testing the fit scores from tests contributing to a second-order Ga factor cross-loaded with Gc further supported the existence of an intermediate Verbal factor. The finding of empirical support for Auditory Processing abilities fitting within an intermediate verbal/language-based ability factor is consistent with Carroll’s (1993) analyses linking verbal- and auditory-processing abilities. Recent non-CHC-based research also linked auditory processing with several verbal/language-based outcomes including: language development/impairment and dyslexia (Conway, Pisoni, & Kronenberger, 2009), and the processing of speech (Jerger & Musiek, 2002).
Limitations of the Present Study
The present findings are limited by the measures used in this research, which came from a single battery of tests. Further research in this area should determine if similar findings are identified using other measures of cognitive ability. Another limitation was the data used, which represents two age groups.
These limitations are tempered by several strengths of the study. A recent review of cognitive/intellectual tests published within the past 10 years indicates the structure of abilities measured by these instruments is consistent with the CHC theoretical model (Keith & Reynolds, 2010); this is the model used to test the CPM. The instrument used to test the CPM is a well-validated instrument that was standardized on a large nationally represented sample. The study also tested competing models using a calibration–validation methodology. The best-fitting model from the calibration phase of the study was then validated in an independent sample. In addition, the use of the WJ III permitted the inclusion of a minimum of three manifest indicators per factor; the standard factor analytic rule-of-thumb required to properly identify a factor model (Floyd & Widaman, 1995).
Implication for Practitioners
In contrast to the three-factor CPM presented in the WJ COG Technical Manual (McGrew & Woodcock, 2001), the best-fitting CPM identified in the present study is a two-factor CPM. The implications of the current study’s results for practitioners are threefold. First, support for intermediate CPM factors within a CHC theoretical model suggests that an examinee’s scores on the broad CHC factors may be examined in an effort to assist in problem identification or intervention development. For example, the broad CHC factor score loading on the Cognitive Efficiency factor may be evaluated to provide information regarding an individual’s executive functions in the areas of processing speed and short-term memory individually (i.e., Gs and Gsm) as well as in combination through the CPM factor scores on Cognitive Efficiency. Second, the results indicate the broad CHC factors long-term retrieval (Glr), visual-spatial thinking (Gv), and fluid reasoning (Gf) are best interpreted individually, in contrast to combining scores as was posited in the WJ III’s Technical Manual. In contrast to Keith’s (2005; 2007) findings and the WJ III’s Technical Manual, the broad CHC factor scores on Ga and Gc may be examined individually as well as in combination within the context of the CPM’s Verbal Ability factor. This suggests that Ga is not best understood as a member of the CPM Thinking Ability family, rather that Ga may be best understood at the intermediate CHC factor level in combination with Gc. Finally, practitioners are encouraged to avoid using scores derived from the WJ COG’s software on the CPM Thinking Ability to understand an individual’s performance on Glr, Gv, and Gf. Rather, the results from the present study suggest these CHC broad factor scores are best understood independently and within the context of g. In addition, the CPM Verbal Ability factor scores generated from the instrument’s software do not include measures of Ga; therefore, it is recommended practitioners use caution when interpreting an individual’s CPM factor scores on Thinking Ability and Verbal Ability when using the WJ III COG’s current scoring software.
Footnotes
Acknowledgements
We thank Woodcock–Muñoz Foundation for making data from the WJ III standardization sample available for this research.
Declaration of Conflicting Interests
The author(s) declared the following potential conflicts of interest with respect to the research, authorship, and/or publication of this article: Kevin S. McGrew has a financial (royalty) interest in the WJ III Battery as a WJ III coauthor.
Funding
The author(s) received no financial support for the research, authorship, and/or publication of this article.