
Abstract
The Psychological Sense of School Membership (PSSM) scale has been used widely to measure adolescent perceptions of sense of school belonging in research investigating associations between the relational quality of educational contexts and motivational and achievement outcomes. Previous research examining the factor structure of the PSSM scale consistently identifies a factor named perception of rejection that consists of only negatively worded items. This study extends previous research by considering potential method effects associated with negatively worded items. Exploratory and confirmatory factor analyses of a diverse U.S. high school sample (N = 890) identified three substantive factors—identification and participation in school, perception of fitting in among peers, and generalized connection to teachers. Our investigation determined the presence of method effects in this scale, and such method effects are best represented with a common negative wording factor.
Keywords
Theories of school engagement (for reviews see Fredricks, Blumenfield, & Paris, 2004; Martin & Dowson, 2009) suggest that the formation and maintenance of positive, school-based social bonds function as protective factors. A central concept in these relational models of engagement is sense of school belonging defined as the extent to which students feel accepted, respected, included, and supported across school settings (Goodenow & Grady, 1993). Sense of school belonging is conceptualized as a need or a motive that prompts behavioral change, or as the resulting outcome of a social situation (Juvonen, 2006).
In the study of educational outcomes, recent research suggests the importance of accounting for adolescent perceptions of sense of school belonging. For example, perceptions of school belonging have been demonstrated to act as a proximal mediator of the links between parent involvement and Latino students’ academic functioning (Kuperminc, Darnell, & Alvarez-Jimenez, 2005) and perceived positive teacher–student relationships and White, working-class, middle-school students’ school engagement (Roeser, Midgley, & Urdan, 1996). Several studies have also established that sense of belonging positively predicts academic-related outcomes (see, for example, Anderman, 2002; Irvin, Meece, Byun, Farmer, & Hutchins, 2011).
In the above-cited studies and other empirical investigations focused on psychological variables that influence educational outcomes, the Psychological Sense of School Membership (PSSM) scale or items nearly identical to PSSM items have been widely used. For example, an item from the school belonging subscale of the Patterns of Adaptive Learning Survey (Midgley et al., 2000) includes, “You feel like you are part of your school.” Likewise, an item from the National Longitudinal Study of Adolescent Health that is used to create a sense of school belonging subscale reads, “I feel like I am part of this school.” The PSSM includes the exact same item, “I feel like I am part of this school.” Due to compelling evidence that students’ sense of belonging influences engagement and learning outcomes and can be enhanced through intervention, establishing the psychometric properties of sense of belonging scales, like PSSM, is of practical importance. For example, the PSSM could be used as a screening or diagnostic tool in efforts to enhance the psychological space for learning.
The original PSSM as developed by Goodenow (1993) included 18 items measured on a 5-point Likert-type response scale (1 = not at all true and 5 = completely true). In this original publication, Goodenow did not confirm the scale’s dimensionality. In subsequent uses of the measure, researchers typically operationalized the PSSM scale into a sense-of-school-belonging variable by calculating the total PSSM score as the average item response across all 18 items with five negatively worded items reverse-coded, as Goodenow suggested. This total score has been shown to have good internal consistency, with Cronbach’s alpha values ranging between .78 and .95 depending on the specific study (see You, Ritchey, Furlong, Shochet, & Boman, 2011, for a review of 42 studies that used the PSSM scale). Yet, there has been no study demonstrating that the PSSM scale is unidimensional. Thus, the use of one total score may not be justified.
To our knowledge, only five published studies have tested the construct validity of the PSSM scale. Hagborg (1994) conducted the first factor analysis of the PSSM scale using a response sample of 240 U.S. White middle- and high school students enrolled in Grades 5 to 12. Hagborg named the factors he derived from his principal components analysis belonging, rejection, and acceptance. The belonging factor included nine items. The rejection factor had three negatively worded items. The acceptance factor had four items in total, two of which cross-loaded on the belonging factor and one negatively worded item.
Cheung and Hui (2003) translated the PSSM scale into Chinese and modified the response structure to a six-point option. They conducted a principal component analysis with oblique rotation of the PSSM scale using a response sample of 547 Chinese students from Primary 4 (n = 130; average age in years = 10.09), Primary 5 (n = 163; average age in years = 11.17), and Primary 6 (n = 254; average age in years = 12.33). Cheung and Hui’s analysis revealed two factors underlying the 18 items without cross-loadings. The first factor, consisting of 13 positively worded items, was named school belonging and the second factor, consisting of five negatively worded items, was named feelings of rejection. Cheung (2004) extended the study to another sample and used two principal component analyses on items of each factor, and demonstrated that the two factors are unidimensional respectively.
O’Farrell and Morrison (2003) adopted a maximum-likelihood extraction with oblique rotation to examine the divergent validity of the PSSM scale using a response sample of 543 U.S. students in Grades 4 to 6. In this study, the measures included five other scales of students’ social connections with school. O’Farrell and Morrison found that the 18 PSSM items, along with the items from the other scales, loaded on three factors that all related to various aspects of students’ sense of belonging. It is noted that in their resulting model all negatively worded items, including three PSSM items and additional items from the other scales, loaded onto a single factor.
Most recently, You et al. (2011) examined the factor structure of the PSSM using a sample of 504 Australian high school students. To our knowledge, this is the only PSSM study that used exploratory (EFA) and confirmatory factor analyses (CFA) on split-half samples and weighted least-squares estimation to consider the categorical response structure of the 5-point option. After deleting several cross-loaded items, You et al. named three factors—caring relationships with teachers, with three positively worded items and one negatively worded item; acceptance, with five positively worded items; and rejection, with three negatively worded items. These results are consistent with those of the Hagborg’s (1994) identification of three factors; the specific items comprising each factor, however, only partially overlap with Hagborg’s. The factor of belonging identified by Hagborg contains items in the two factors of caring relationships with teachers and acceptance identified by You et al. The factor of rejection in the two studies shared two items. However, none of the items overlapped in the factor of acceptance in the two studies.
The inconsistent results in the five studies we reviewed above suggest that further examination of the factor structure of the PSSM scale is warranted. Moreover, the fact that all previous studies identified the consistent presence of and included the naming of one negative factor, conceptualized as rejection or perception of rejection, adds further justification for additional study of measures of sense of school belonging. Importantly, these “rejection” factors consist of only negatively worded items. The cross-loading of some negatively worded items (see Hagborg, 1994) raises further concern about whether the hypothesized rejection factor identified across studies is an artifact resulting from method effects related to negatively worded items or is a substantive sense of school belonging factor.
The specific aims of the research addressed in this article, therefore, are to (a) examine the factor structure of the PSSM scale and (b) consider the method effects associated with negatively worded items. First, we review the current evidence base regarding negatively worded items. Then, using EFA and CFA, we examine a factor structure derived from a diverse U.S. high school response sample (N = 890). We conclude the article with a discussion of our findings and recommendations for future research. We extended the previous research by comparing several alternative models to address the possible method effects related to negatively worded items.
Negatively Worded Items: A Review of the Literature
Many self-report surveys contain negatively worded items. Barnette (2000) defined negatively worded items as those written so that the meaning is in the opposite direction of that of the majority of items. Use of negatively worded items decreases the occurrence of what Cronbach (1946, as cited in Barnette, 2000) termed acquiescence, or the tendency to agree with survey questions. In addition, negatively worded items discourage participants from reacting to each question based on how they feel generally about the overall situation (otherwise known as the presence of response sets); instead, these items are thought to encourage specific responses to the content of a particular item as written (Barnette, 2000). Such advantages have attracted researchers to use positively and negatively worded items in survey instruments.
Such a wording strategy may present challenges to internal consistency and factor structures. For example, in the earlier studies of the factor structure of global self-esteem measured by the Rosenberg’s Self-Esteem Scale (Carmines & Zeller, 1979; Marsh, 1996), which contains four positively worded and three negatively worded items, EFA consistently revealed a two-factor structure: one factor was associated with positively worded items and the other with negatively worded items. Researchers have studied extensively whether the two-factor solution reveals two substantive components of self-esteem, or one substantive factor with a systematic method effect (Marsh, 1996; Marsh & Grayson, 1995; Tomás & Oliver, 1999).
Method effects associated with negatively worded item have been found in different survey instruments such as the Social Physique Anxiety Scale (SPAS; Motl & Conroy, 2000), the General Health Questionnaire (GHQ; Ye, 2009), and the Positive and Negative Affect Scale (PANAS; Bagozzi, 1993). The prevalence of method effects in survey instruments attracted researchers to examine whether they are measurement artifacts and substantively irrelevant, or they represent a response style that has a substantive interpretation (Alessandri, Vecchione, Tisak, & Barbaranelli, 2011; Horan, DiStefano, & Motl, 2003). Motl and colleagues (DiStefano & Motl, 2006; Horan et al., 2003; Motl & DiStefano, 2002) demonstrated that the method-effect factors have psychometric properties similar to the substantive factors, such as convergent validity across instruments and long-term stability, which supports the interpretation of method effects as personality traits that can be estimated and evaluated. However, Alessandri et al. (2011) argued that temporal stability is not definitive proof of substantive nature of method effects.
The analysis strategies adopted in the studies of method effects mainly fall within the framework of structural equation modeling. Depending on whether the method effects are considered as measurement artifact or a separate factor representing response style, researchers can choose from a correlated trait, correlated uniqueness (CTCU) framework (Horan et al., 2003; Marsh & Grayson, 1995; Tomás & Oliver, 1999) and a correlated trait, correlated method (CTCM) framework (Horan et al., 2003; Tomás & Oliver, 1999). In other words, the CTCU model treats the wording effect as a methodological artifact and does not allow the wording effect to be examined as a distinct factor. Instead, it allows the unique factors (i.e., error term) related to the negatively worded items to be correlated. The CTCM model allows the wording effect as a distinct factor and its possible relationship with other factors in a substantive way, such as personality measures as suggested in the response-style literature (Bollen & Paxton, 1998). There has been debate over using CTCM or CTCU models to address the wording effect. Tomás, Hontangas, and Oliver (2000) showed that there is no satisfactory methodological criterion for choosing between CTCU and CTCM models. Horan et al. (2003) argued for the preference of CTCM because the method effect is examined as a distinct entity that “may have substantively relevant empirical relations with other factors or variables” (Horan et al., 2003, p. 451). For example, DiStefano and Motl (2006) adopted multitrait–multimethod methodology by using CTCM model to investigate the possible causes of response styles when one is using negatively worded items and to further determine whether responses to negatively worded items are related to behavior or personality traits. They found that the presence of method effects was less likely for subjects who were apprehensive of negative evaluations by others or had higher levels of self-consciousness.
Methods
Participants
Study participants attended a Pennsylvania high school and voluntarily completed the survey during social studies classes. As a school-administered questionnaire, enrollment in the high school and attendance on the day of the survey were the only eligibility requirements. All questionnaires were anonymous, and the school did not collect any identifiable data. Researchers obtained the data as a de-identified secondary data set with an exempt institutional review board approval. Out of the 902 survey responses, we deleted 12 students’ responses because of suspicious answering patterns, such as the same response to all items. There were 131 students with responses missing to one or more items. We retained the students with missing responses in the data analysis by using direct maximum likelihood estimation with missing data in Mplus 6.1 (L. K. Muthén & Muthén, 2010), and thus the final analysis sample contains 890 subjects.
On the day of data collection, the participants ranged in age from 13 years to 19 years (M = 16.57, SD = 1.23), and membership among 9th, 10th, 11th, and 12th grade levels equally divided the sample. Participants self-reported among four categories of gender, with 42.9% (N = 382) identifying as male, 48% (N = 427) identifying as female, 1.2% (N = 11) as transgender, and 1.5% (N = 13) as nongendered (the remaining 2.2% [N = 20] refused and 4.2% [N = 37] did not provide a response). The self-reported racial composition of the sample was 37.2% (N = 331) Black/African American, 35.1% (N = 312) White/European American, 2.1% (N = 19) Asian American, 0.7% (N = 6) Pacific Islander, 2.4% (N = 21) American Indian, and 14.9% (N = 113) multiracial (the remaining 7.6% [N = 68] did not provide a response).
Instruments
Participants responded to the 18 items using a 5-point Likert-type scale (1 = not at all true and 5 = completely true) of the PSSM (Goodenow, 1993). The items are presented in Table 1. For the five negatively worded items, we adopted reverse coding so that higher scores illustrate stronger sense of school membership.
Item Descriptive Statistics.
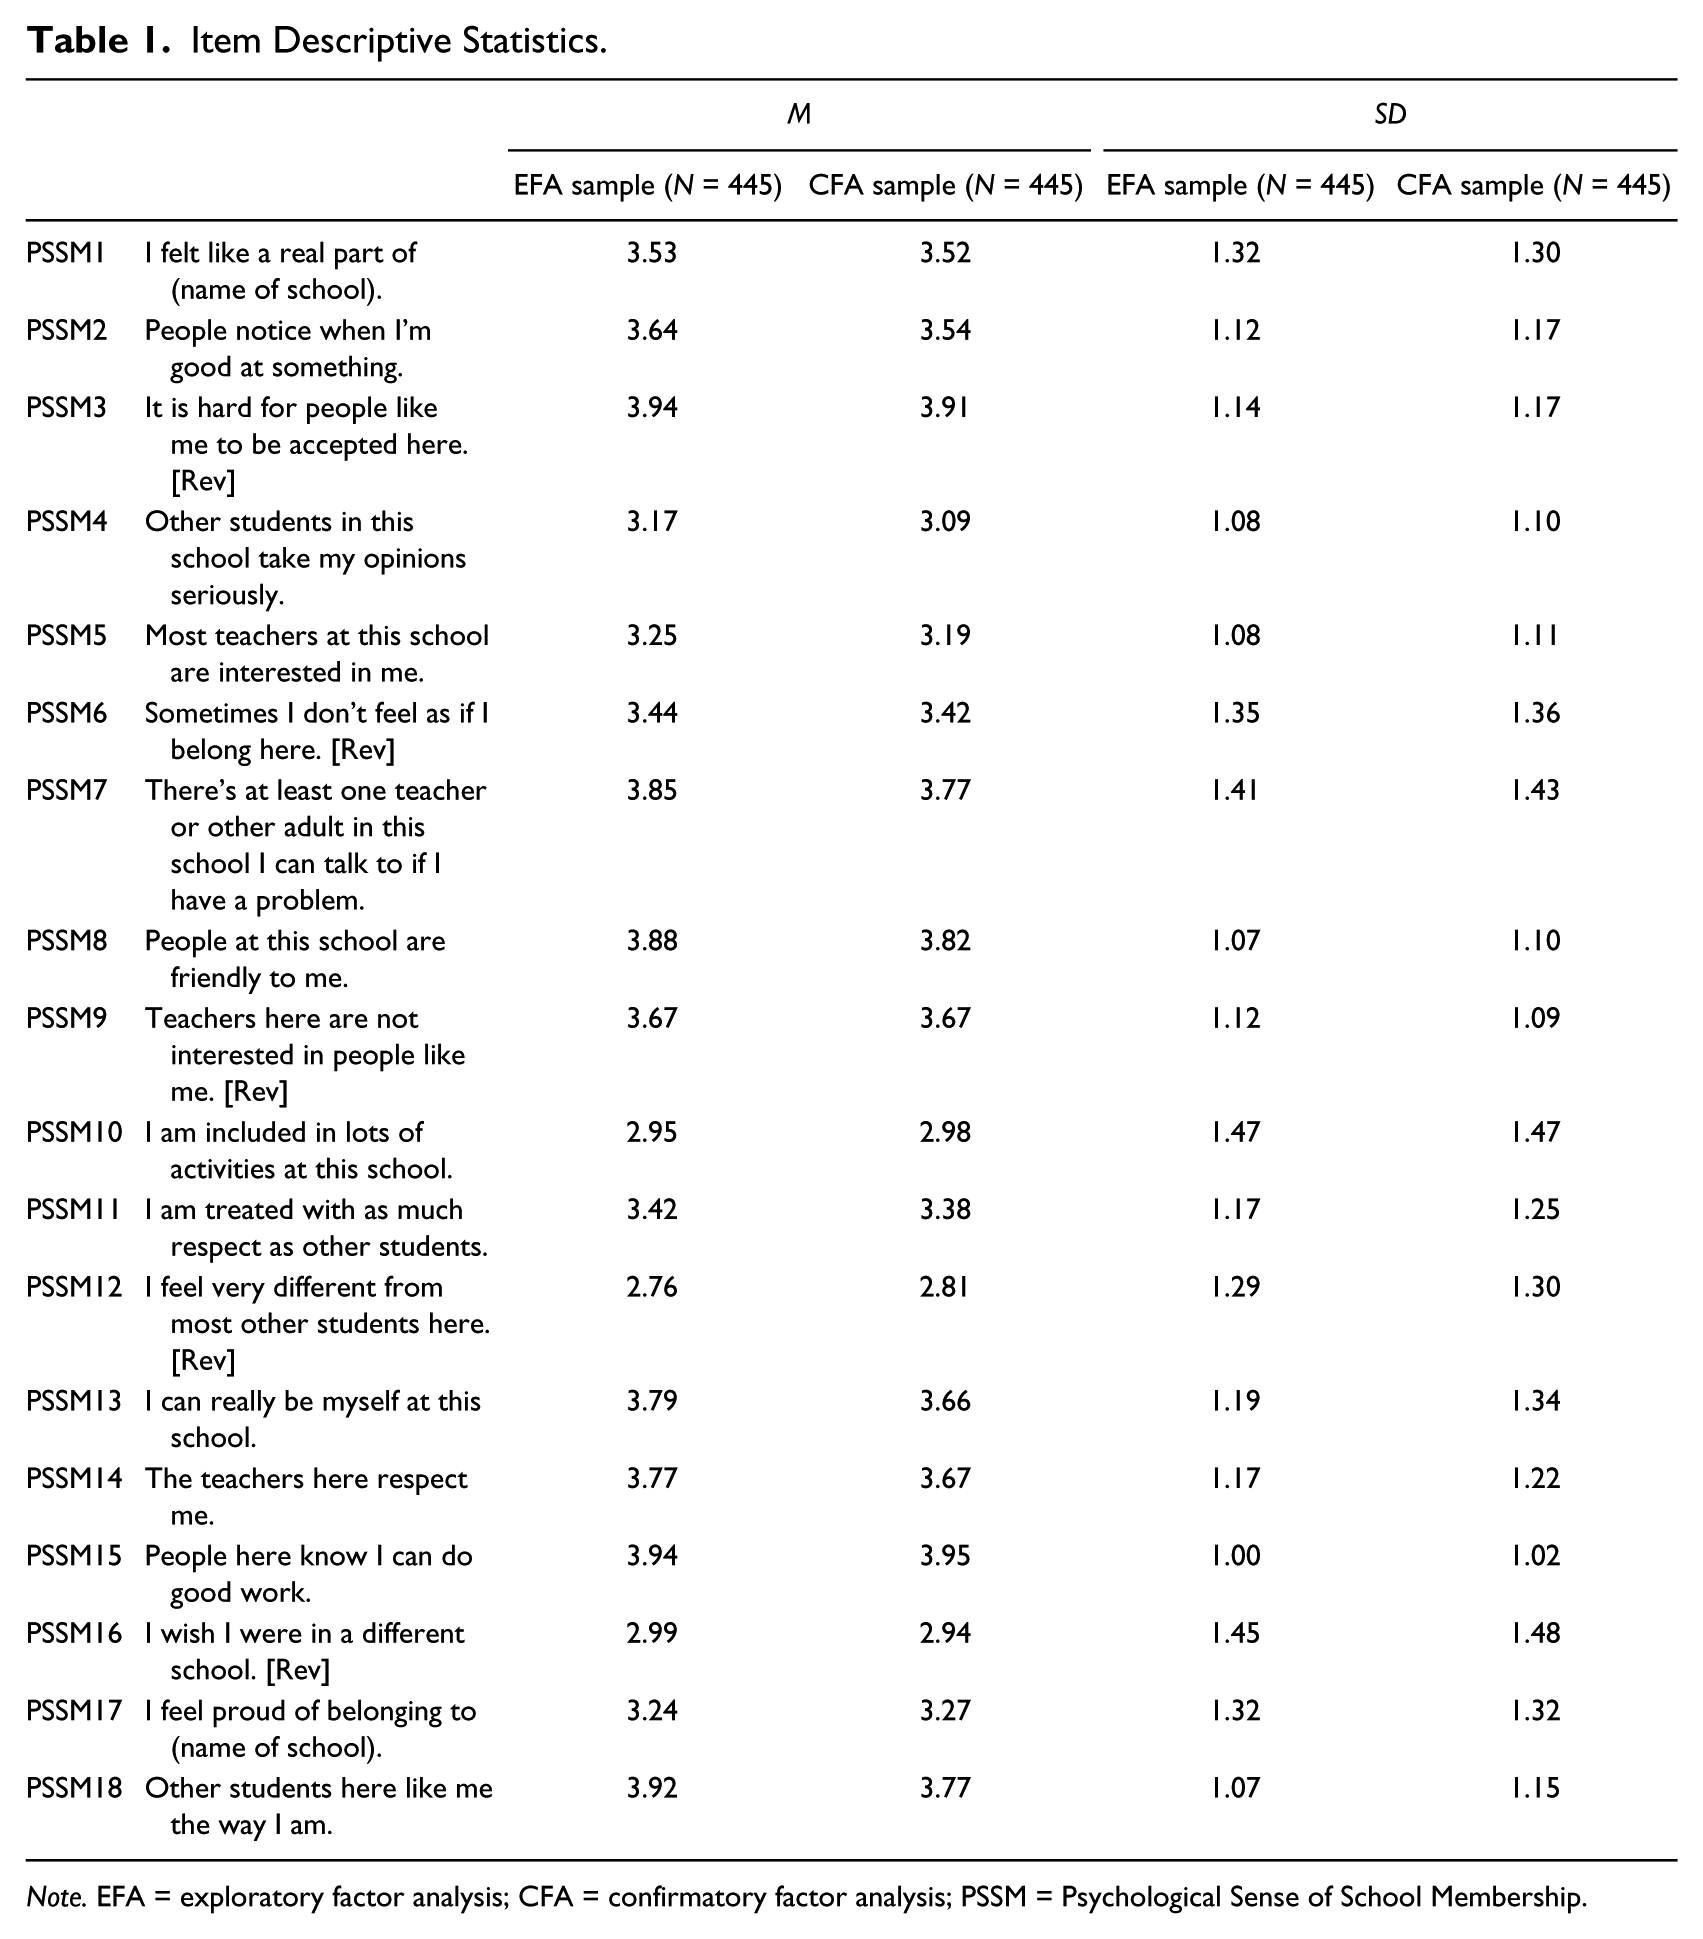
Note. EFA = exploratory factor analysis; CFA = confirmatory factor analysis; PSSM = Psychological Sense of School Membership.
Data Analytic Strategy
We randomly split our sample to conduct EFA with a training sample and CFA with a validation sample. Descriptive statistics (means and standard deviations) are displayed in Table 1 for the EFA and CFA samples, respectively.
The 18 items are all ordinal on a 5-point Likert-type scale. We examined the normality of these items using the Shapiro–Wilk test, and none of the items is normally distributed (ps < .001). Thus, we chose the modified weighted least-squares estimation method for ordinal variables (WLSMV in Mplus; B. Muthén, du Toit, & Spisic, 1997) for EFA and CFA because maximum likelihood estimation of ordinal variables is known to produce misleading results, and WLSMV has been shown to provide accurate test statistics, parameter estimates, and standard errors (Flora & Curran, 2004).
Models were evaluated using a set of five fit indexes that focus on different aspects of model fit: chi-square statistic, Comparative Fit Index (CFI), Tucker Lewis coefficient (TLI), root mean square error of approximation (RMSEA), and the standardized root mean squared residual (SRMR). Models considered good fit have CFI and a TLI with values of .95 or above, RMSEA .06 or less, and SRMR .05 or less (Hu & Bentler, 1999).
Results
EFA
An examination of item correlations to check for possible multicollinearity problems indicated that none of the correlation coefficients exceeded .7. We retained all 18 items for analysis. The EFA was performed using the WLSMV method to extract the factors followed by a Geomin (oblique) rotation (B. Muthén & Asparouhov, 2009).
We adopted statistical and theoretical criteria to determine the number of factors. Four eigenvalues of sample correlation matrix were greater than 1, with values (and percentage of variance explained) of 6.30 (35%), 1.77 (9.8%), 1.35 (7.5%), and 1.19 (6.6%). A parallel analysis offered support for a four-factor structure, with the fifth-factor eigenvalue of the randomly generated data being greater than the fifth-factor eigenvalue of the original data. With the four-factor structure supported, we also obtained three-factor and five-factor solutions to examine the possibility of overfactorization or underfactorization of the four-factor solution. Model fit indexes for the three-, four-, and five-factor solutions appear in Table 2. The five-factor solution provided the best fit, but one factor has only two items with factor loading greater than .30, which implies an overfactorization effect, so we continued with the four-factor solution.
Fit Statistics for Exploratory Factor Analyses Models.
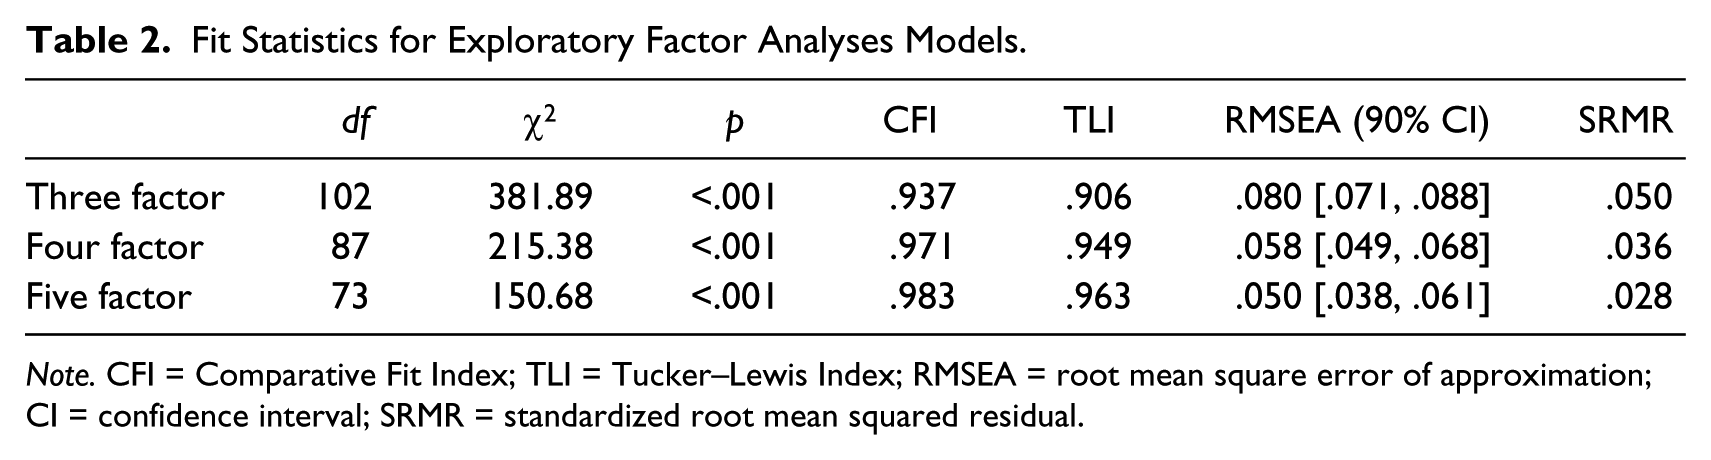
Note. CFI = Comparative Fit Index; TLI = Tucker–Lewis Index; RMSEA = root mean square error of approximation; CI = confidence interval; SRMR = standardized root mean squared residual.
To decide on the appropriateness of the four-factor model, we examined the factor loadings/pattern coefficients presented in Table 3. Most items loaded onto one of the four factors with a value greater than .30. Based on the examination of the items and the prior theoretical evidence, we identified four distinct school-experience factors that include identification and participation in school (Factor 1), perception of fitting in among peers (Factor 2), generalized connection to teachers (Factor 3), and negative perception (Factor 4). Table 4 presents the correlation among these four factors from the EFA.
Factor Loadings of the Four-Factor Measurement Model in EFA and CFA.
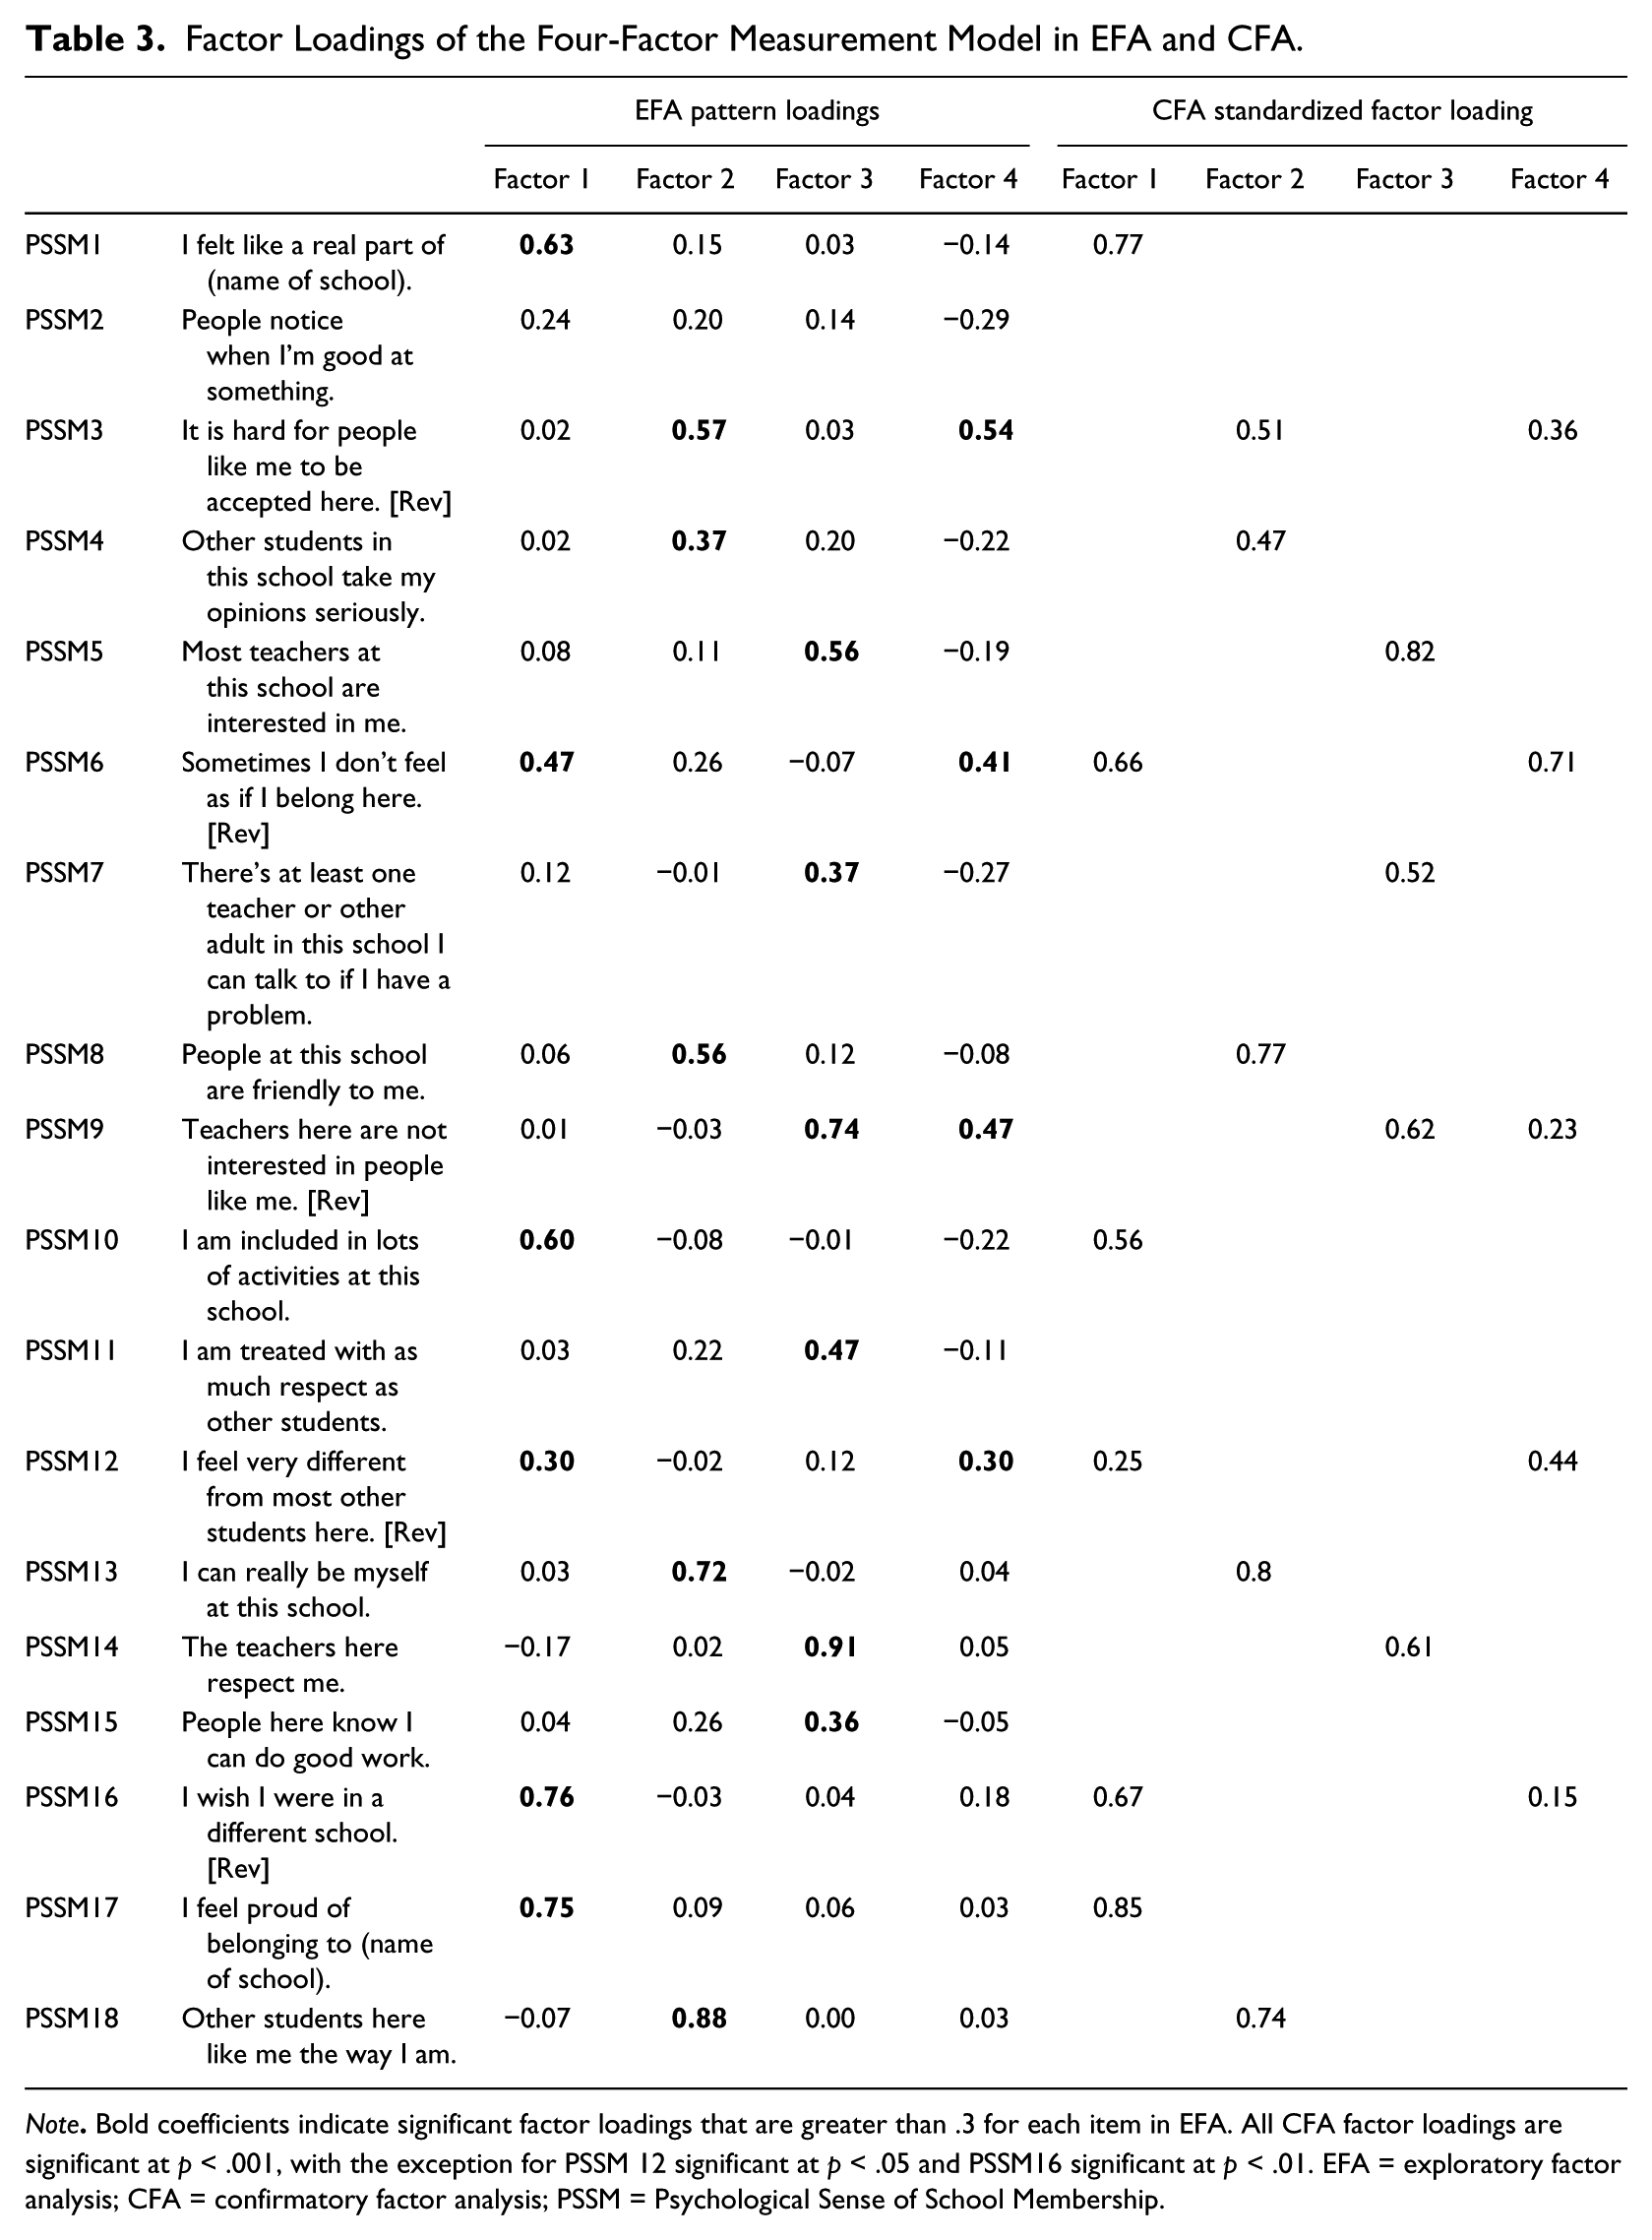
Note. Bold coefficients indicate significant factor loadings that are greater than .3 for each item in EFA. All CFA factor loadings are significant at p < .001, with the exception for PSSM 12 significant at p < .05 and PSSM16 significant at p < .01. EFA = exploratory factor analysis; CFA = confirmatory factor analysis; PSSM = Psychological Sense of School Membership.
Correlations Among Latent Factors in EFA and CFA.

Note. Correlations from the EFA are below the diagonal and correlations from the CFA are above the diagonal. EFA = exploratory factor analysis; CFA = confirmatory factor analysis.
p < .05. ** p < .01. ***p < .001.
Note that all the four items with significant loadings on Factor 4 (PSSM3, PSSM6, PSSM9, and PSSM12) were negatively worded and cross-loaded on another factor. In addition, this factor had insignificant correlation with the other three factors. These suggest a possible method effect resulting from the wording of these items.
CFA
We used CFA to apply the four-factor solution extracted from the EFA to the validation sample. We first adopted a CTCM model, with negatively worded items allowed to cross-load on the method-effect factor and one of the three other factors, according to the results from the EFA results. For the other items, we specified item loadings based on each item that had the highest loading factor in the EFA analyses. The item PSSM2 (“People notice when I’m good at something”) did not have significant loading on any factor and was deleted. This model provides acceptable but not good fit, with
We examined modification indexes to improve model fit. We found that the following items have significant cross-loadings on more than one factor: Items PSSM11 (“I am treated with as much respect as other students”) and item PSSM15 (“People here know I can do good work”) loaded on Factor 2 and Factor 3. These two items might be creating confusion to respondents in that PSSM11 does not specify who is treating the student with respect. Likewise, PSSM15 does not specify whom the “people” are that the respondent should be considering when choosing a response. We deleted these two items. The resulting model (Model 1a in Figure 1) with 15 items provided a good fit, with

Alternative models for the Psychological Sense of School Membership (PSSM) scale with wording effect.
The above CTCM model with negative wording factor demonstrates the method effect with negatively worded items. Alternative models need to be compared to evaluate whether the substantive factors and wording effects are separable in other ways (Horan et al., 2003). Figure 1 presents four models. Models 1a and 1b consisted of CTCM models. Model 1a has a common negative wording factor, and Model 1b has a common positive wording factor. Models 1c and 1d consisted of CTCU models. Model 1c has correlation among errors of negatively worded items, and Model 1d has correlation among errors of positively worded items. Table 5 presents fit indexes of the four models. Model 1a has the lowest RMSEA, and highest CFI and TLI values. Model 1d has the smallest WRMR, but TLI less than .90 and RMSEA greater than .08 indicating unacceptable fit. In summary, the method effect associated with negatively worded items is best represented with a common negative wording factor. We also fit a three-factor model to the 15 items excluding the method factor, which provides a poor fit,
Fit Indexes for Alternative CFA Models.
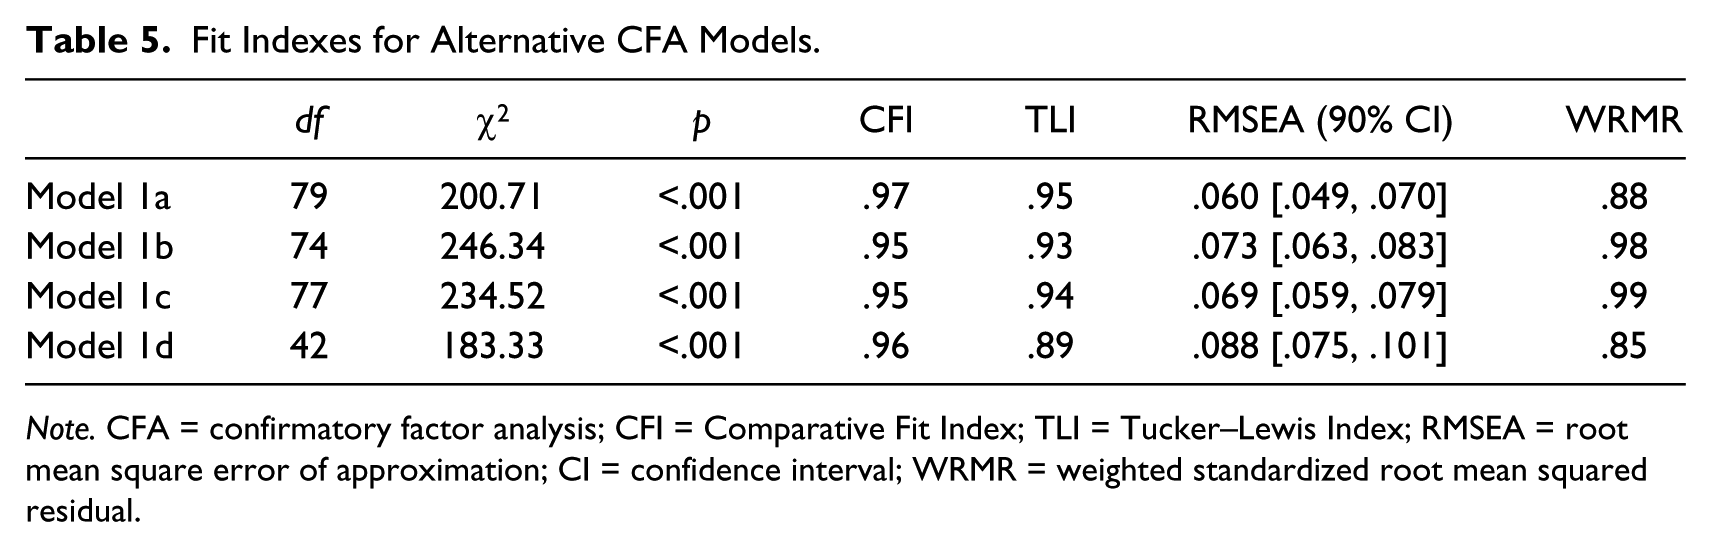
Note. CFA = confirmatory factor analysis; CFI = Comparative Fit Index; TLI = Tucker–Lewis Index; RMSEA = root mean square error of approximation; CI = confidence interval; WRMR = weighted standardized root mean squared residual.
Discussion
Results from our analyses support the previous literature in that the PSSM scale measures more than one correlated latent trait (see, for example, Cheung & Hui, 2003; Hagborg, 1994; You et al., 2011). This implies that using the total score of the 18 items of the PSSM as one psychological variable seems inappropriate.
Our results of the factorial structure were partially consistent with previous studies. Here, we mainly compare our results with You et al. (2011) because of their adoption of the similar methods (independent samples for EFA and CFA, WLSMV estimation). The generalized connection to teachers factor in the current study has exactly the same four items as the caring relationship factor in You et al.’s results. The perception of fitting in among peers factor in our study shares three overlapping items with the acceptance factor in You et al.’s work; these three items in the current study are PSSM4 (“Other students in this school take my opinions seriously”), PSSM13 (“I can really be myself at this school”), and PSSM18 (“Other students here like me the way I am”). You et al.’s acceptance factor had two additional items: PSSM2 (“People notice when I’m good at something”) and PSSM10 (“I am included in lots of activities at this school”). We excluded PSSM2 from the current study because of cross-loading. We classified PSSM10 as one item for the identification and participation in school factor, which had two overlapping, negatively worded items with the rejection factor in You et al.’s study (PSSM6, “Sometimes I don’t feel as if I belong here”) and PSSM16, (“I wish I were in a different school”). You et al.’s rejection factor has one more negatively worded item, PSSM3 (“It is hard for people like me to be accepted here”), which measures the perception factor of fitting in among peers in the current study. We included three items in the current study that You et al. deleted: PSSM1 (“I felt like a real part of [name of school]”); PSSM17 (“I feel proud of belonging to [name of school”]), which measures identification and participation in school; and PSSM8 (“People at this school are friendly to me”), which measures perception of fitting in among peers. In summary, the comparison of our results with those of You et al. shows consistency in the relationship with teachers component. Their definition of acceptance is a combination of fitting in among peers and participation in school activities, and their definition of rejection is similar to identification in school. We retained a 15-item scale, three more items than the 12-item scale recommended in You et al. Such inconsistency can be attributed to the separation of method effect and substantive factors.
With separation of the method effect, the PSSM scale demonstrates three clean-cut dimensions of school belonging, with the school, peers, and general teachers. Previous studies identified a substantive factor measuring students’ perception of rejection, which we argue here appears to be a method effect attributable to negative wording. Because previous findings consistently indicate that sense of belonging comprises perceptions of belonging across several domains of relationships and contexts, a substantive factor related to the “rejection” aspect of sense of belonging should also differentiate across domains of relationships and contexts. It seems unlikely—given theoretical and empirical understandings of sense of belonging as derived from interactions and experiences with particular people in specific contexts—that there would be one metafactor of rejection irrespective of relationships and contexts.
The comparison of the four CFA models for the method effect indicated that a common negative wording factor accounts best for the wording effect and is better than the model with correlated error terms of the negatively worded items. Our results suggest that wording effects associated with negatively worded items in the PSSM scale could be estimated as a distinct latent factor, but we have not attempted to address the substantive content of this hypothesized response style. Furthermore, research is needed and could include additional measures, such as personality factors, to examine whether the difference in response style to negatively worded items is related to different personality traits, such as avoidance motivation and self-consciousness (DiStefano & Motl, 2006).
Another limitation of the current study is that the PSSM scale has only one negatively worded item for two factors. In other words, it does not have multiple items for each factor–method combination, and thus does not allow for different method factors related to different substantive factors. Further research is needed to include more measures that comprise positively and negatively worded items so that researchers can address whether the method effects associated with negatively worded items are prevalent across different scales.
Having a psychometrically sound measure of students’ sense of school belonging permits future intervention-based work in schools. The PSSM has great value as a screening tool to diagnose or identify students at risk of disengagement from school, with potential mental health issues, or on a path to academic failure. The PSSM could easily be integrated into existing tiered intervention programs, like Response to Intervention, to capture social risk factors that likely influence engagement with academic work. The PSSM could also be integrated into teacher evaluation systems to help teachers understand the relational health of their classroom. Paired with individualized professional development around managing the social processes in their classroom, the PSSM could provide critical monitoring data for efforts around improving teacher effectiveness.
Abstract concepts like sense of school belonging are only practical if they can be measured well. The present study contributes to improving the psychometric properties of the PSSM scale in service of improving the potential of schools as contexts for positive youth development.
Footnotes
Declaration of Conflicting Interests
The author(s) declared no potential conflicts of interest with respect to the research, authorship, and/or publication of this article.
Funding
The author(s) received no financial support for the research, authorship, and/or publication of this article.