
Abstract
To determine whether children and adolescents (7-17 years old) who had experienced physical, sexual, or both types of abuse reflected distinct profiles of personal resiliency, we administered the Resiliency Scales for Children and Adolescents (RSCA) to 250 youth. We performed cluster analyses with T scores for the RSCA Self-Mastery, Relatedness, and Emotional Reactivity scales, and four profiles of resiliency representing high (20%), average (28%), and slightly below-average (30%) resiliency, and high vulnerability (22%) were identified. The youth with the high vulnerability profile described themselves as more depressed and were rated by their parents as having more internalizing and externalizing problems than the youth with high resiliency. We propose different treatment approaches that might be used with youth representing each of the four different profiles.
Personal resiliency is an important construct for understanding why some youth develop psychological and behavioral problems after experiencing traumatic events (Luthar, Cicchetti, & Becker, 2000). For example, less resilient youth are more likely to develop symptoms of anxiety and depression than more resilient youth (Hoge, Austin, & Pollack, 2007). The development of personal resiliency has been attributed to a number of psychosocial factors; a variety of different treatment approaches for increasing resilient behaviors and attitudes have also been proposed for youth; and valid and reliable instruments for assessing resiliency are now available. (See Prince-Embury and Saklofske, 2013, for detailed descriptions and reviews of the various treatment approaches and instruments.)
Profiles of the Sense of Mastery (MAS), Relatedness (REL), and Emotional Reactivity (REA) scales from the Resiliency Scales for Children and Adolescents (RSCA; Prince-Embury, 2007) have been used to assess resiliency in youth and suggest optimal treatment approaches for them. For example, Kumar, Steer, and Gulab (2010) performed a cluster analysis with the MAS, REL, and REA T scores of 100 youth who had been admitted to an inpatient psychiatric unit and identified four profiles of personal resiliency that could be rank-ordered in terms of ascending levels of vulnerability. Prince-Embury and Steer (2010) also cluster-analyzed the MAS, REL, and REA T scores of the 641 and 285 youth, respectively, in the RSCA standardization and clinical youth samples. In the standardization sample, there were three profiles indicating high resiliency (Profile A, 31%), average resiliency (Profile B, 44%), and low resource vulnerability (Profile C, 25%). In the predominately outpatient clinical sample, there were four profiles representing resiliency (Profile A, 23%), low resource vulnerability (Profile B, 26%), high vulnerability (Profile C, 31%), and very high vulnerability (Profile C, 20%). These four profiles matched those reported by Kumar et al. for psychiatric inpatients.
Given the emphasis in the posttraumatic abuse literature upon resiliency as a construct for helping understand how youth might react to traumatic events (Philippe, Laventure, Beaulieu-Pelletier, Lecours, & Lekes, 2011), we believe that it is important to ascertain whether any of the RSCA profiles that have been previously found for youth with and without psychiatric problems are similar to the RSCA profiles of youth who have experienced physical or sexual abuse. The purposes of the present study were to determine (a) what the profiles of personal resiliency were for youth who have experienced physical, sexual, or both types of abuse according to the MAS, REL, and REA scales and (b) whether any of the resultant profiles match those previously reported for normal youth and youth being treated for mental health problems.
Method
Sample
The sample represented 250 youth (7-17 years old) who were consecutively evaluated for having experienced physical, sexual, or both types of abuse at a medical school-based clinic specializing in the assessment and treatment of child abuse. The clinic is located in a middle-class community but also serves youth living in rural and inner city areas. This convenience sample was composed of 183 (73%) girls and 67 (27%) boys whose mean age was 11.33 (SD = 3.10) years old. There were 97 (39%) European Americans, 59 (23%) African Americans, 47 (19%) Hispanic Americans, and 47 (19%) Americans preferring other ethnic descriptions, such as biracial (n = 29, 12%). There were 11 (4%) siblings included in the sample. Educationally, 26 (10%) of the youth were enrolled in special education schools, and 22 (9%) were taking special education classes in their regular schools. There were 214 youth (86%) being evaluated for sexual abuse, and 36 (14%) were being assessed for physical abuse. However, 29 (14%) of the 214 sexually abused youth had also been reported to the New Jersey Department of Youth and Family Services as having been physically abused. With respect to sexual abuse, 65 (30%) had been abused by an adult caretaker; 74 (35%) had been abused by some other adult; 73 (34%) were children or adolescents themselves; and 2 (1%) had been abused by multiple perpetrators. Using the Schedule for Affective Disorders and Schizophrenia for School-Age Children–Present and Lifetime Version (K-SADS; Kaufman, Birmaher, Brent, Ryan, & Rao, 1997), we found that 121 (49%) youth met Diagnostic and Statistical Manual of Mental Disorders (4th ed., text rev; DSM-IV-TR; American Psychiatric Association [APA], 2000) symptom criteria for a posttraumatic stress disorder (PTSD).
Of the 239 caregivers (parents) accompanying the youth, the modal parent was the child’s biological mother (n = 163, 68%), and none of the parents of the youth who had experienced sexual abuse was the abusing parent. However, 14 (39%) of the 36 parents accompanying the physically abused youth were the offending parents. The mean age of the parents was 39.38 (SD = 9.52) years old.
Instruments
The following instruments were chosen to address the criterion-group discriminant validity of the profiles of resiliency that might be found:
The Child Behavior Checklist (CBCL; Achenbach, 1991) is a 120-item parental rating scale that was scored for its Externalizing and Internalizing subscales. These two subscales have repeatedly been found to display good convergent and discriminant validities (Seligman, Ollendick, Langley, & Baldacci, 2004), and the summed raw scores for both scales were converted into T scores based on normative values for the various sex and age groups that are described by Achenbach (1991).
The Beck Depression Inventory–II (BDI-II; A. T. Beck, Steer, & Brown, 1996) is a 21-item self-report instrument that is used to measure the severity of depression in adolescents and adults and has generally been found to have high internal consistency (coefficient αs > .90) and moderate to high convergent validities (rs > .50) with other self-report and clinical rating scales of depression (Steer & Beck, 2000). The BDI-II was administered to adolescents (>12 years old).
The Children’s Depression Inventory (CDI; Kovacs, 1992) is a well validated and reliable 27-item self-report instrument that measures the severity of depression in children (Seligman et al., 2004). The CDI was administered to children (<13 years old), and the total scores were converted into T scores based on the normative values for the various sex and age groups that are presented by Kovacs (1992).
The RSCA (Prince-Embury, 2007) is a self-report instrument that measures different aspects of personal resiliency. It is composed of a 20-item MAS scale, a 24-item REL scale, and a 20-item REA scale. These three global scales may, in turn, be scored for subscales assessing constructs, such as Optimism, Trust, and Sensitivity. The items are rated on a 5-point Likert-type scale ranging from 0 (never) to 4 (almost always) and are written at a third-grade reading level. The MAS, REL, and REA T scores can also be used to derive an overall Vulnerability Index (VI).
Detailed information about the reliabilities and validities of the RSCA scales is provided by Prince-Embury (2007). For example, in the standardization sample, the coefficient αs for the MAS, REL, REA, and VI total scores were all ≥ .85. The test–retest reliabilities for these scales were ≥ .70, and criterion validity of these scales was supported by differentiating normal and clinical youth with the mean differences representing large (>.80) effect sizes. With respect to the construct validities of the MAS, REL, and REA, Prince-Embury (2007) reported that the REA was positively correlated (rs > .40) with the Depression, Anxiety, Anger, and Disruptive Behavior scales of the Beck Youth Inventories (J. S. Beck, Beck, Jolly, & Steer, 2005) in her standardization sample, and the MAS was negatively correlated (rs > −.31) with the Depression, Anger, and Disruptive Behavior scales, but positively correlated with the Self-Concept scale (r = .74).
The K-SADS (Kaufman et al., 1997) is a semi-structured interview and was administered to the youth and the caregiver by an evaluating clinician to assess the presence of DSM-IV-TR PTSD symptoms. The clinicians had been extensively trained in its administration. The youth and his or her parent were independently administered the K-SADS, and the clinician used the data gathered from both perspectives to judge whether a symptom was present. There are five-item Reexperiencing, seven-item Avoidance, and five-item Hyperarousal scales that are calculated by summing the number of symptoms rated in each scale. The symptoms correspond to the 17 DSM-IV-TR criteria for PTSD. If the clinician judged that the youth had one or more Reexperiencing, three or more Avoidance, and two or more Hyperarousal symptoms, then the clinician described the youth as having met DSM-IV-TR symptom criteria for PTSD. Runyon, Deblinger, and Steer (2010) reported that the intraclass correlations (ICCs) between raters for the Reexperiencing, Avoidant, and Hyperarousal scores were, respectively, .92, .85, and .84, and there was 100% agreement with respect to whether a child met DSM-IV-TR criteria for PTSD. The reliability and validity of the K-SADS have also been supported across a variety of different clinical populations (Ambrosini, 2000).
Procedures
After the caregiver (parent) accompanying the child or adolescent for the evaluation gave written consent and the child or adolescent had also consented or assented to the evaluation, the parent and youth were administered the instruments described above as part of a standard assessment battery, which took approximately 3 hr. They also consented to having their de-identified information stored in a computer database for research purposes. The clinician was available to answer any questions that might arise while the youth was completing the self-report instruments and read aloud the questions to the youth if the information gathered during the interview suggested that the youth’s reading level might be too low to complete a self-report instrument. This project was conducted with the approval of the medical school’s Institutional Review Board.
Cluster Analysis
A two-stage approach was used to determine whether distinct profiles of resiliency could be identified according to the MAS, REL, and REA T scores and was identical to that used by Kumar et al. (2010) and Prince-Embury and Steer (2010). We first employed Ward’s (1963) agglomerative-hierarchical cluster analysis with the SAS 9.32 CLUSTER procedure to estimate the number of prototypal profiles of mean MAS, REL, and REA T scores that should be extracted. Because youth (outliers) with scores having low estimated probability densities for matching potential clusters might distort the identification of reliable clusters, 10% of the outliers were excluded to make the solutions more stable. Sarle’s (1983) cubic clustering criteria (CCCs) along with the pseudo-F statistics that are calculated by CLUSTER were employed to determine the number of target profiles to retain. We plotted the CCCs for 1 to 10 possible clusters and observed that the CCCs leveled off at either four or five clusters. However, the respective pseudo-F statistics for seven-, six-, five-, and four-cluster solutions were 142, 148, 150, and 162. We considered the 12-point increase from 150 for five clusters to 162 for four clusters to indicate that a four-cluster solution might be most appropriate.
In the second stage, we used a k-means iterative-partitioning cluster analysis with the SAS FASTCLUS procedure to assign all of the 250 youth to one of the mean standard-score target profiles that had been found with Ward’s technique for either four or five clusters. The five-cluster solution yielded one profile which had only 12 youth. Because the generalizability of a cluster profile based on only 12 youth would be questionable, we decided to use the four-cluster solution.
Chi-square tests for independence and one-way ANOVAs were used to compare 12 selected background and clinical characteristics of the youth by the resultant profiles. A Bonferroni adjustment of alpha / 12 was used to control for the familywise error rate. Hochberg’s GT2 test was used for making post hoc mean comparisons with the variables that had been found to be significantly differentiated by the profiles because the profiles contained unequal numbers of youth (Toothaker, 1991); the Bonferroni adjustment for the post hoc comparisons was at the .05 level, two-tailed test, divided by the number of profiles that were found. To estimate whether a profile matched any of those previously found by Prince-Embury and Steer (2010), the ICC between profiles was calculated (McCrae, 2008).
Results
Table 1 and Figure 1 present the means and standard deviations of the MAS, REL, and REA T scores for the four profiles. The profiles are labeled A, B, C, and D and listed in ascending order of overall vulnerability according to the magnitudes of the mean VI T scores; this rank-order labeling system follows that used by Kumar et al. (2010) and Prince-Embury and Steer (2010). There were 52 (20%) youth in Profile A, 69 (28%) youth in Profile B, 75 (30%) youth in Profile C, and 54 (22%) youth in Profile D. The mean MAS and REL T scores of Profile A were higher than the mean MAS and REL T scores of Profile B, which were, in turn, higher than the mean MAS and REL T scores of Profile C. The mean MAS and REL T scores of Profile C were higher than the mean MAS and REL T scores of Profile D. As Table 1 and Figure 1 also show, the mean REA T score of Profile D was higher than the mean REA T score of Profile B which was, in turn, higher than the mean REA T score of Profile C which was also higher than the mean REA T score of Profile A. Furthermore, the mean MAS and REL T scores of Profile B were, each, approximately one standard deviation (SD = 10) above the mean MAS and REL T scores in Profile C. The mean VI T scores displayed in Table 1 were significantly differentiated by the four profiles, F(3, 246) = 364.36, partial η2 = .82, p < .001. Post hoc contrasts at the .0125 level, two-tailed test, found that the mean VI T score of Profile D was significantly higher than the mean VI T score of Profile C, which was, in turn, higher than the mean VI T score of Profile B. The mean VI T score of Profile B was higher than the mean VI T score of Profile A. Therefore, we considered Profile A to represent abused youth with high resiliency, whereas Profile D was indicative of youth with high vulnerability. Profiles B and C represented, respectively, average and slightly below-average resiliency.
Means and Standard Deviations of the RSCA Sense of Mastery, Sense of Relatedness, Emotional Reactivity, and Vulnerability Scales by Profiles of Personal Resiliency for Abused Youth.
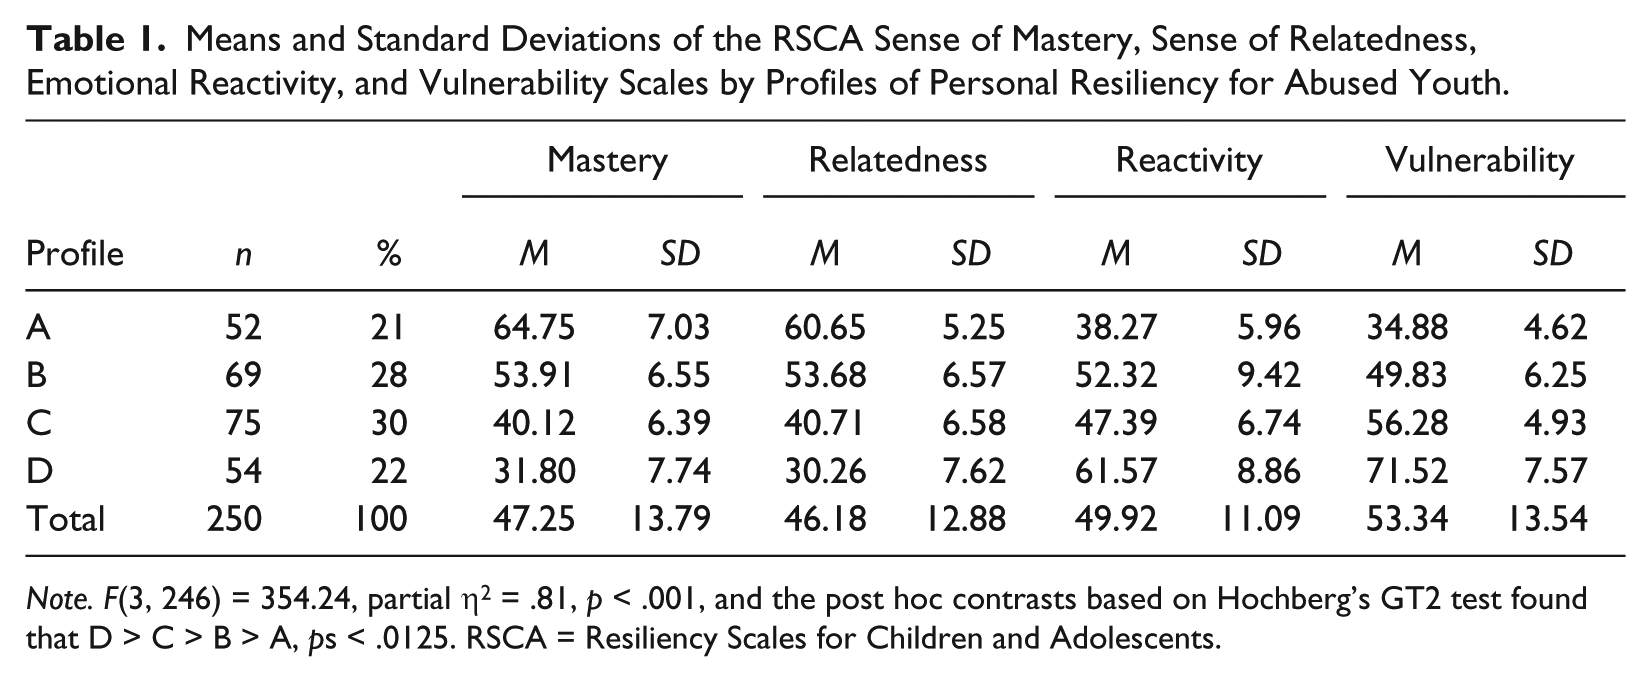
Note. F(3, 246) = 354.24, partial η2 = .81, p < .001, and the post hoc contrasts based on Hochberg’s GT2 test found that D > C > B > A, ps < .0125. RSCA = Resiliency Scales for Children and Adolescents.
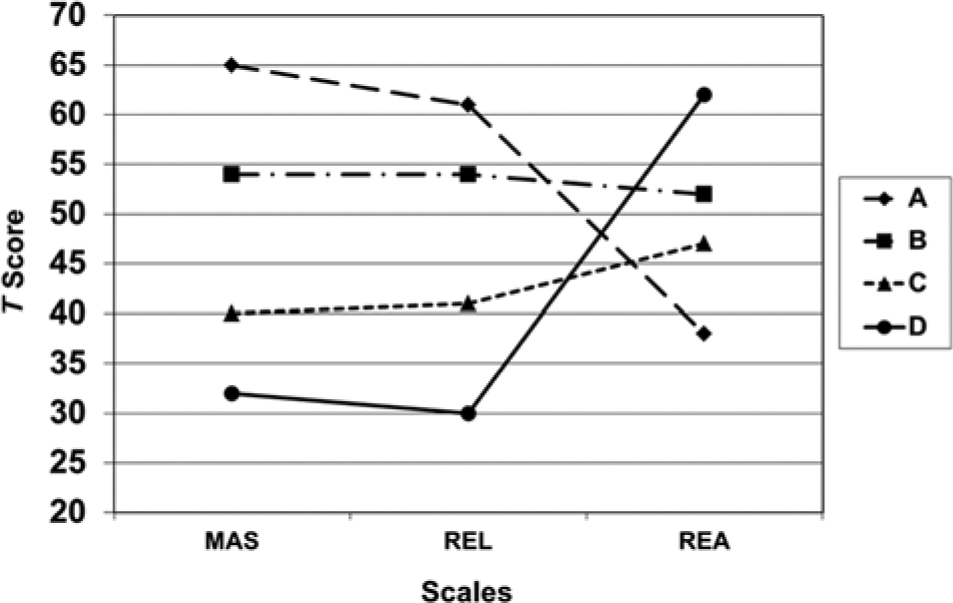
Profiles of Personal Resiliency.
The mean VI T scores of the 250 abused youth were next compared with the mean VI T scores that were obtained from Prince-Embury and Steer (2010) for 641 normal youth and 285 youth being treated primarily in outpatient settings. The mean VI T scores differed significantly, F(2, 1173) = 110.46, partial η2 = .16, p < .001. Post hoc mean comparisons found that the mean VI T score of the outpatients (M = 60.80, SD = 9.45) was higher than the mean VI T score of the abused youth (M = 53.34, SD = 13.54), whereas the mean VI T scores of the abused and outpatient youth were both higher than the mean VI T score of the normal youth (M = 49.66, SD = 9.60), ps < .05.
Prince-Embury and Steer (2010) also found a high resiliency profile in their standardization sample. The ICC between the abused (high resiliency) and normal (resiliency) youths’ Profiles A is .96, and the ICC between the abused (high vulnerability) and outpatient (very high vulnerability) youths’ Profiles D is .98. The ICCs for the abused youths’ (slightly below-average resiliency) Profile C with the outpatient sample’s (low resource vulnerability) Profiles B and (high vulnerability) C profiles are, respectively, .88 and .69, indicating that the abused youth’s slightly below-average resiliency profile is more similar to the outpatients’ low resource vulnerability profile than it is to the outpatients’ high vulnerability profile. However, the ICC between the abused youths’ (average resiliency) Profile B and the outpatient youths’ (high vulnerability) Profile C is .83; the abused youths’ average resiliency profile is more similar to the outpatient youths’ high vulnerability profile than it is to the abused youths’ (slightly below-average resiliency) Profile C. The four profiles found in the present study thus correspond to similar profiles previously identified by Prince-Embury and Steer in either the standardization or outpatient samples.
Table 2 displays the cross-tabulations, chi-square tests for independence, and Cramer’s Vs for the four profiles by sex (0 = girls, 1 = boys), being Caucasian (0 = no, 1 = yes), and type of abuse (0 = physical, 1 = sexual), and enrollment in a special education school or special education classes (0 = no, 1 = yes) along with one-way ANOVAs for age (years), the CBCL Internalizing T scores, the CBCL Externalizing T scores, the BDI-II total scores for the adolescents, the CDI T scores for the children, and the three K-SADS scores. As Table 2 indicates, the four profiles were not discriminated with respect to sex, being Caucasian, type of abuse, or receiving special education. The one-way ANOVAs in Table 2 also show that the mean ages along with the mean K-SADS Reexperiencing, Avoidance, and Hyperarousal scores were also comparable across the four profiles. However, the mean CBCL Internalizing T, CBCL Externalizing T, BDI-II, and CDI T scores of the youth differed with respect to the four profiles.
Characteristics of Abused Youth by Profiles of Personal Resiliency.

Note. BDI-II = Beck Depression Inventory–II; CBCL = Child Behavior Checklist; CDI = Children’s Depression Inventory; K-SADS = Schedule for Affective Disorders and Schizophrenia for School-Age Children; RSCA = Resiliency Scales for Children and Adolescents.
p < .001, Bonferroni adjusted, ps < .0125 for post hoc contrasts.
The Hochberg’s GT2 post hoc mean contrasts (ps < .0125) listed in Table 2 for the mean Internalizing T scores indicate that the mean Internalizing T score for the youth representing Profile D was higher than the mean Internalizing T score for the youth representing Profile A. The mean Internalizing T scores for Profiles A and B were comparable, and the mean Internalizing T scores for Profiles D and C were also comparable. The mean Externalizing T score of the youth in Profile D was higher than the mean Externalizing T scores for the youth in Profiles A, B, and C; the mean Externalizing T scores for the youth in the latter three profiles were comparable. The mean BDI-II score for the adolescents in Profile D indicated that these adolescents described themselves as being more depressed than the adolescents in Profiles A and B. The adolescents in Profiles D and C had described comparable levels of depression, whereas the adolescents in Profile C described more depression than those in Profile A. Finally, the mean CDI T scores displayed in Table 2 indicate that the children in Profile D described themselves as more depressed than the children in the other three profiles, but the children in Profiles B and C described themselves as more depressed than those in Profile A.
Discussion
Although reliability of clinical subgroups identified by cluster analyses need to be confirmed with additional research, we found four RSCA profiles for youth with a history of sexual, physical, or both types of abuse that correspond to similar profiles previously reported by Prince-Embury and Steer (2010) for either normal or outpatient samples. The mean level of overall vulnerability for the abused youth on the RSCA was also higher than those for normal youth, but below that previously reported for outpatient youth being treated for mental health disorders (Prince-Embury & Steer, 2010). This finding might be expected given that the present youth were referred for treatment as a result of sexual or physical abuse as opposed to mental health difficulties.
We believe that youth representing each of four profiles of personal resiliency may benefit from different treatment approaches. A broad spectrum of clinical approaches has already been described by Prince-Embury (2007) to help youth develop more resiliency. Interestingly, 20% of the abused youth were assigned to the (high resiliency) Profile A with mean MAS and REL T scores above 60 and a mean REA T score below 40. These youth may be at a lower risk for developing comorbid mental health difficulties, such as depression and behavior problems. Another 28% of the youth were assigned to (average resiliency) Profile B with mean MAS, REL, and REA T scores between 50 and 55. Youth assigned to Profiles A and B may require shorter and less intensive courses of therapy as compared with less resilient youth.
In contrast to the highly and average resilient youth, 30% of the youth were assigned to (slightly below-average) Profile C with mean MAS and REA T scores below 45 and a mean REA T score below 50, and 21% of the youth were assigned to (high vulnerability) Profile D with mean MAS and REA T scores below 35 with a mean REA T score above 60. In treating Profile C youth, a clinician might focus on skill building techniques to increase feelings of mastery and the use of group therapy to increase interpersonal skills. Profile D matched the same-named profile by Prince-Embury and Steer (2010) for youth being treated primarily in outpatient settings. Although youth assigned to Profiles C and D had more internalizing symptoms and self-reported depressive symptoms as compared with those assigned to Profiles A and B, the youth assigned to Profile D were rated by their parents as displaying more externalizing behaviors than the youth assigned to other three profiles. Youth matching Profile D would probably require longer treatments. Given their lower scores with respect to relatedness (REL), they may also benefit from parent–child, family, or group interventions to enhance their relationships with others (Deblinger, Stauffer, & Steer, 2001; Runyon et al., 2010). In addition, to improve their mastery skills (MAS) and reduce their emotional reactivity (REA), Profile D youth may also benefit from intensive skill building, exposure, and processing interventions that would enhance their coping and personal feelings of mastery in facing traumatic reminders and other stressors. Research has found that parenting training is a critical component of trauma-focused treatments for children, such as those assigned to Profile D, who display externalizing problems with behavior problems (Deblinger, Mannarino, Cohen, Runyon, & Steer, 2011; Runyon et al., 2010).
Future research about the reliability and validity of the RSCA for identifying types of self-reported resiliency in youth should determine whether the profiles of personal resiliency that were found in the present youth are generalizable to youth who have experienced other types of traumatic events, such as earthquakes, floods, and community violence. In addition, we recommend that future research should examine whether changes in mastery, relatedness, or emotional reactivity moderate treatment outcomes. Finally, longitudinal research should be conducted to discover whether enhancing a youth’s resiliency to handle possible adverse events might decrease the development of posttraumatic stress reactions in the future.
Footnotes
Declaration of Conflicting Interests
The author(s) declared no potential conflicts of interest with respect to the research, authorship, and/or publication of this article.
Funding
The author(s) received no financial support for the research, authorship, and/or publication of this article.