
Abstract
The Student Engagement Instrument (SEI) is a self-report measure of cognitive and affective engagement with school. Prior SEI validation studies have focused primarily on construct validity through analyses of internal consistency, factor analysis, and measurement invariance. Results are presented here from a two-pronged study of the criterion validity of SEI scores. Using a middle school sample (N = 35,900), concurrent validity was assessed through analyses of group differences in SEI scores across student subgroups expected to differ in cognitive and affective engagement levels: behaviorally disengaged versus non-disengaged, high-risk versus low-risk disability status, and high versus low academic achievement. Next, through multiple logistic regression analyses, the 4-year predictive validity of SEI scores for on-time graduation and dropout was assessed in a cohort of first-time ninth graders (N = 11,588). Nearly all SEI factors demonstrated directionally consistent associations with each criterion, including considerable long-term predictive associations with both dropout and on-time graduation.
Twenty-first century American youth belong to an age in which graduating from high school with college-ready skills carries a substantial social and economic significance (Kirsch, Braun, Yamamoto, & Sum, 2007; Rumberger, 2011). Although high school graduation rates overall appear to be on the rise in the United States, they remain low for some demographic groups, such as children from low-income families, students with learning disabilities, and foreign-born Latin American students (U.S. Department of Education, 2009). Dropout theory and empirical studies indicate a critical role for student engagement and disengagement, respectively, in school completion and dropout (Reschly & Christenson, 2012). In recent years, dropout prevention research has included engagement indicators in the development of early warning systems (EWS) that identify middle and high school students who are at-risk for dropout (Allensworth & Easton, 2007; Balfanz, Herzog, & Mac Iver, 2007; Henry, Knight, & Thornberry, 2012), with findings showing that students’ attendance, discipline records, and course grades are powerful indicators of whether a student is falling off the graduation path.
In the last decade, student engagement has increasingly been viewed as a construct relevant for all students (Christenson, Reschly, & Wylie, 2012) and as an organizing heuristic for school reform efforts and the Response-to-Intervention framework (Christenson et al., 2008). Although there are some conceptual variations across models of student engagement, there is consensus that it is multidimensional—involving aspects of behavior, cognition, and emotion (Fredricks, Blumenfeld, & Paris, 2004). Behavioral engagement includes indicators such as rule-following and low levels of disruptive behaviors (e.g., infrequent absences, office referrals), as well as involvement in academic tasks (e.g., persistence, class participation) and participation in extracurricular activities (e.g., school athletics, school government). Affective engagement, representing an internal aspect of student engagement, refers to students’ emotional experiences with school (e.g., interest, happiness, belonging). The third category, cognitive engagement, also internal, refers to psychological investment in learning (e.g., preference to be challenged and exceed basic academic requirements) and self-regulation (e.g., use of metacognitive strategies, managing distractions).
Student Engagement Instrument (SEI)
Many studies have investigated student engagement using behavioral indicators; few have distinctly included indicators of the cognitive and affective subtypes (Appleton, Christenson, Kim, & Reschly, 2006; Fredricks et al., 2004). The SEI, developed by Appleton et al. (2006), is a survey designed to measure self-perceptions of cognitive and affective engagement. SEI data are intended to complement behavioral and academic engagement data readily available in school records, and the SEI is available to schools free of charge. (See Appleton et al., 2006, for the complete set of SEI items.) The SEI was developed in alignment with school completion research (e.g., Finn, 1989) and the Check & Connect intervention model (see Christenson et al., 2008). In the SEI’s conceptual framework (Appleton, Christenson, & Furlong, 2008; Appleton et al., 2006), the behavioral dimension described above is further divided into behavioral and academic engagement subtypes, the former indicated by variables such as attendance rate and extracurricular activity, the latter indicated by variables such as time-on-task and homework completion. The SEI’s framework stresses the dynamic relationships between context, engagement, and outcomes (Appleton et al., 2006, 2008) and holds that engagement is both an outcome and a process that relates to other outcomes (Reschly & Christenson, 2012).
Although indicators of behavioral and academic engagement are commonly available in student records, data on cognitive and affective engagement typically are not. The SEI measures the other two broad subtypes of engagement through a five-factor measurement model (Betts, Appleton, Reschly, Christenson, & Huebner, 2010). Three of these factors tap into affective engagement: Teacher–Student Relationships (TSR), Family Support for Learning (FSL), and Peer Support for Learning (PSL). Illustrative example items for each of these include At my school, teachers care about students (TSR); When I have problems at school, my family/guardian(s) are willing to help me (FSL); and Other students at school care about me (PSL). The other two factors on the SEI—Future Goals and Aspirations (FGA) and Control and Relevance of School Work (CRSW)—relate to cognitive engagement. Representative example items for these include School is important for achieving my future goals (FGA) and The tests in my classes do a good job of measuring what I’m able to do (CRSW).
Promising evidence of the validity of SEI scores has been demonstrated in prior studies. In the pilot study of the SEI, Appleton et al. (2006) reported findings on the latent factor structure, internal consistency, and concurrent validity of the SEI, using the responses of 1,931 ninth graders. Internal consistency estimates for the SEI ranged from α = .72 to .88, and small correlations (range r = |.00| to |.25|, mean r = |.12|) were found, generally in expected directions, with several concurrent indicators associated with school completion (i.e., grade point average [GPA], standardized achievement scores, and suspensions). Following the pilot study, the SEI has been included in studies of school functioning involving students in Grades 7 through 10 (Lewis, Huebner, Reschly, & Valois, 2009; Reschly, Huebner, Appleton, & Antaramian, 2008), and in a follow-up validation study conducted by Betts et al. (2010), who found good internal consistency (α = .70-.80) and evidence of factorial invariance of the SEI’s factor structure among students in Grades 6 to 12. Although Appleton et al. (2006) found a six-factor structure to yield the best fit and interpretability in their pilot study, Betts et al. indicated that a five-factor model was more parsimonious.
Purpose and Scope of Present Study
In the pilot study, as noted above, correlations between SEI scores and concurrent indicators of student performance (e.g., GPA, suspension) were generally in expected directions but small in magnitude, raising questions regarding the practical value of the instrument. No additional studies have examined the criterion validity of SEI scores. Furthermore, no studies have examined their long-term predictive validity. With this in mind, we developed two research questions regarding the criterion validity of SEI scores:
To address these research questions, we designed a two-pronged study that extends knowledge of the SEI in several ways. Addressing the issues raised by the original validation study, our study includes a larger and more diverse sample, allowing us to analyze differences among students belonging to groups at opposing extremes of engagement. Results from these analyses provide additional evidence regarding the degree, direction, and consistency of the SEI’s relationship with educational indicators (Study 1). In addition, our 4-year study of a cohort of first-time ninth graders provides the first look at the long-term predictive validity of SEI scores (Study 2). We view this study as one piece in a body of research on the validity of SEI scores and as an indication of what can be expected when the SEI is used in an applied setting. The practical nature of the questions addressed here should be valuable to researchers and stakeholders interested in evidence relevant to screening for risk of school failure.
Criterion Variables and Hypotheses
In engagement research, dropout is not viewed as an isolated event, but as the culmination of a long-term process of disengagement from school, which typically begins much earlier than the high school years (Alexander, Entwisle, & Horsey, 1997; Appleton et al., 2008; Balfanz et al., 2007). With this in mind, we were interested in the concurrent associations of SEI scores with early indicators of dropout risk, as well as the predictive association of SEI scores with distant high school outcomes.
Concurrent Criterion Variables: Early Indicators of Risk
In choosing concurrent criteria, our focus was on variables available in school records for nearly all students that would indicate early risk for school failure. This led us to include data on attendance, office discipline referrals (ODRs), special education status, and achievement. Poor attendance and disciplinary problems are considered indicators of behavioral disengagement from school (Fredricks et al., 2004) and are highly predictive of high school dropout, even as early as sixth grade (Balfanz et al., 2007). Because the SEI was developed to complement behavioral engagement data, we hypothesized that SEI scores would be considerably different between typical students and those demonstrating extreme levels of behavioral disengagement, as measured by attendance and ODR data.
Students in special education are a heterogeneous group; correspondingly, graduation and dropout rates among disability categories vary considerably (Schifter, 2011). We were interested in comparing the SEI scores of a disability category associated with high risk of dropout with a category with lower risk. According to national data provided by the U.S. Department of Education (2010), among students in special education, students identified with an emotional/behavioral disorder (EBD) had the lowest graduation rate (50.0%) and highest dropout rate (38.8%), whereas students with a speech/language impairment (SLI) had the highest graduation and lowest dropout rates (70.5% and 6.7%, respectively). We expected to find meaningful differences in SEI scores between these groups, with higher scores expected for students in the lower risk group.
Finally, evidence from a variety of studies shows that higher levels of engagement—including indicators of cognitive and affective engagement—associate with higher achievement (Fredricks et al., 2004). Based on findings by Appleton et al. (2006), we suspected that mid-range levels of engagement may not differentiate between students much in terms of achievement, but that students at opposing ends of academic achievement should differ considerably in engagement levels, with well above average achievement levels having considerably higher SEI scores than students with well below average achievement.
Predictive Criterion Variables: Distant High School Outcomes
Evidence from longitudinal studies involving behavioral, cognitive, and affective engagement indicators have shown that higher engagement is associated with a reduced likelihood of dropping out (Balfanz et al., 2007; Janosz, Archambault, Morizot, & Pagani, 2008; Wylie & Hodgen, 2012). Accordingly, we hypothesized that higher SEI factor scores in ninth grade would associate with a greater probability of graduating on-time 4 years later and with a lower probability of dropout.
General Methods
In the two studies that follow, we used the five-factor SEI model (Betts et al., 2010), measuring three facets of affective engagement—TSR, PSL, and FSL—and two facets of cognitive engagement—CRSW and FGA. Students responded to SEI items using a 4-point Likert-style response format (1 = strongly disagree, 2 = disagree, 3 = agree, 4 = strongly agree), where higher scores signify higher levels of engagement. Factor scores were computed as the mean response value across factor items. Administration of the SEI involved standardized procedures, including oral administration to control for reading level. These studies were conducted with the approval of the district and university institutional review boards.
Missing Data
Across studies, SEI items and achievement scores (in Study 1 only) were the only variables with missing data. In the SEI data, each item had at least one missing value across cases. However, no items were missing more than 1% of values, and less than 1% of all possible SEI values were missing overall. Furthermore, less than 10% of students were missing one response or more, and 96% of these students were missing only one to three items. Missingness of data was low, sample size was large, and assumptions of data being missing at random were reasonable, given the nature of the measure and the extensiveness of the data available. In each sample, SEI factor scores were generated using the mean across items if 75% or more of items loading onto the factor were complete. When SEI factor scores from the spring administration were missing, a seasonally adjusted fall score was utilized if available (equal to the fall score minus the mean difference between fall and spring, by factor and grade level). This resulted in complete SEI data for more than 93% of the sample. The remaining 6.2% to 6.3% of missing SEI factor scores across all cases and the 4.6% of missing math and reading z scores (in Study 1) were handled using multiple imputation (Little & Rubin, 2002). Five imputations were generated using all available data and through chained equations with predictive mean matching (Little, 1988). All results involving SEI or achievement data represent pooled estimates across imputations. Imputations and all analyses were performed using Stata Version 13 software (StataCorp, 2013).
Study 1: Concurrent Validity
Sample
Cross-section of middle school students
The middle school sample (N = 35,900) consisted of students in Grades 6 (33.6%), 7 (34.6%), and 8 (31.8%), who were enrolled ≥ 50% of the 2007-2008 school year in a southeastern U.S. district. All data were from existing school records, including SEI data, which were collected in fall 2007 and spring 2008 as part of a district-wide student advisement program. Sample size was comparable with state estimates for the district’s fall 2007 enrollment in Grades 6 to 8 (36,166). The sample was 48.5% female. Ethnicity was 35.1% White, 27.4% Black, 22.8% Hispanic, 10.3% Asian, 4.1% Multiracial, and less than 1% Native American. English was the primary language for 68.5% of the sample, with 18.8% speaking Spanish as a primary language, 2.5% Korean, and 1.7% Vietnamese. The remaining 8.5% comprised students speaking one of a variety of other languages (e.g., Hindi, Mandarin). Students receiving special education services constituted 13.6% of the sample, and 43.6% of the sample was eligible for free or reduced-price lunch.
Operational Definitions
Behavioral disengagement
Students were classified as behaviorally disengaged if, during the 2007-2008 school year, they were absent 10% or more of enrolled days and cited for more than one disciplinary infraction that resulted in detention or suspension. These markers were chosen based on disengagement and dropout prediction research with middle school student data conducted by Balfanz et al. (2007) and on the types of student data available for this study.
Disability risk status
Our operational definitions of disability risk status were informed by national dropout data for students with disabilities (U.S. Department of Education, 2010) and by the constraints of our data (i.e., we excluded low-incidence categories due to small sample sizes, as well as high-incidence categories with less than a 50% SEI response rate). Students identified with EBD as their primary area of exceptionality were categorized as having a higher risk disability. Students with SLI listed as their primary area of exceptionality were assigned to the lower risk disability category.
Academic achievement
Achievement was measured using student scores on state-wide standardized end-of-year math and reading tests for Grades 6 through 8. Well above average achievement was defined as scoring 1 SD or more above the district mean on each of these assessments. Well below average achievement was defined as scoring 1 SD or more below the state mean on each assessment.
Analyses
Associations with early indicators of risk
Comparing SEI factor score means across groups, Cohen’s d and effect size (ES) interpretative guidelines for educational research were used to evaluate whether a mean difference was educationally significant (d ≥ .25) or clinically significant (d ≥ .50; Wolf, 1986). For parsimony, rather than conducting t tests or other similar traditional significance tests, we assessed both statistical and practical significance based on Cohen’s d estimates and their 95% confidence intervals (CIs; Nakagawa & Cuthill, 2007).
Study 2: Predictive Validity
Sample
Cohort of first-time ninth graders
The sample for predictive validity analyses (N = 11,588) consisted of all students in the district who were enrolled ≥ 50% of the 2007-2008 school year and were entering ninth grade for the first time. This sample was 49.8% female. Ethnicity was 37.4% White, 26.5% Black, 20.4% Hispanic, 10.5% Asian, 4.6% Multiracial, and <1% Native American. English was the primary language for 72.3% of students, with 15.5% speaking Spanish and 12.2% speaking one of a variety of other languages. Students with disabilities constituted 10.9% of the sample, and 43.9% of the sample were eligible for free or reduced-price lunch.
Operational Definitions
No Child Left Behind (2002) signified a policy shift toward high school completion by requiring states to track graduation rates, defining graduation as “the percentage of students who graduate . . . with a regular diploma in the standard number of years” [see 20 U.S.C. § 6311(b)(2)(C)(vi)]. We operationalized on-time graduation and dropout in accordance with this definition. Specifically, students who dropped out were identified in school records as leaving within the time frame of the study (2007-2011) for any of the following reasons: enrollment in adult education, expelled/suspended, financial hardship, incarcerated, low grades, marriage/parenting, removed for non-attendance, or transferred to juvenile justice. Although research suggests that a large portion of students who leave a district later fail to graduate (Rumberger, 2004), in an effort to keep our outcome variables as reliable as possible, our definition of dropout does not include students who transferred to a private school or another district, left to attend home school, or left for unknown reasons. These relatively stringent criteria resulted in a dropout definition that does not represent many true but unknown non-graduates, thus likely underestimating the true cohort dropout rate. Likewise, the true cohort on-time graduation rates are likely somewhat higher than reported as non-graduates include any students in the cohort who were not identified as graduating.
Analyses
Predictive associations with graduation and dropout
Using the ninth-grade cohort, we first evaluated whether SEI scores in ninth grade affected the likelihood of on-time graduation, defined as graduating with a full diploma by the end of the summer following the cohort’s expected senior year. Next, we assessed whether scores affected the likelihood of dropout within that same time frame. A series of multiple logistic regressions were used to estimate the statistical significance and ES of the association between each SEI factor and each of these binary outcomes. Each regression included one continuous SEI factor as the independent variable and gender, ethnicity, and economic disadvantage as covariates. Coefficients of the effect of each SEI factor score on the outcome are expressed in odds ratios (ORs), where an OR = 1.0 indicates no association, an OR > 1.0 indicates an increase in the likelihood of the outcome as the factor score increases, and an OR < 1.0 indicates a decrease in the likelihood of the outcome as the factor score increases (Agresti, 2007).
Results
Study 1: SEI Associations With Early Risk Indicators
Group means and 95% CIs for SEI factor scores are presented in Table 1. Cohen’s d ESs for group differences are reported and represented graphically with 95% CIs in Figure 1. Each group mean comparison of SEI factor scores was statistically significant (p < .05 level), and all effects but one (CRSW by achievement level) were in the expected direction.
SEI Factor Score Means and 95% CIs by Group.
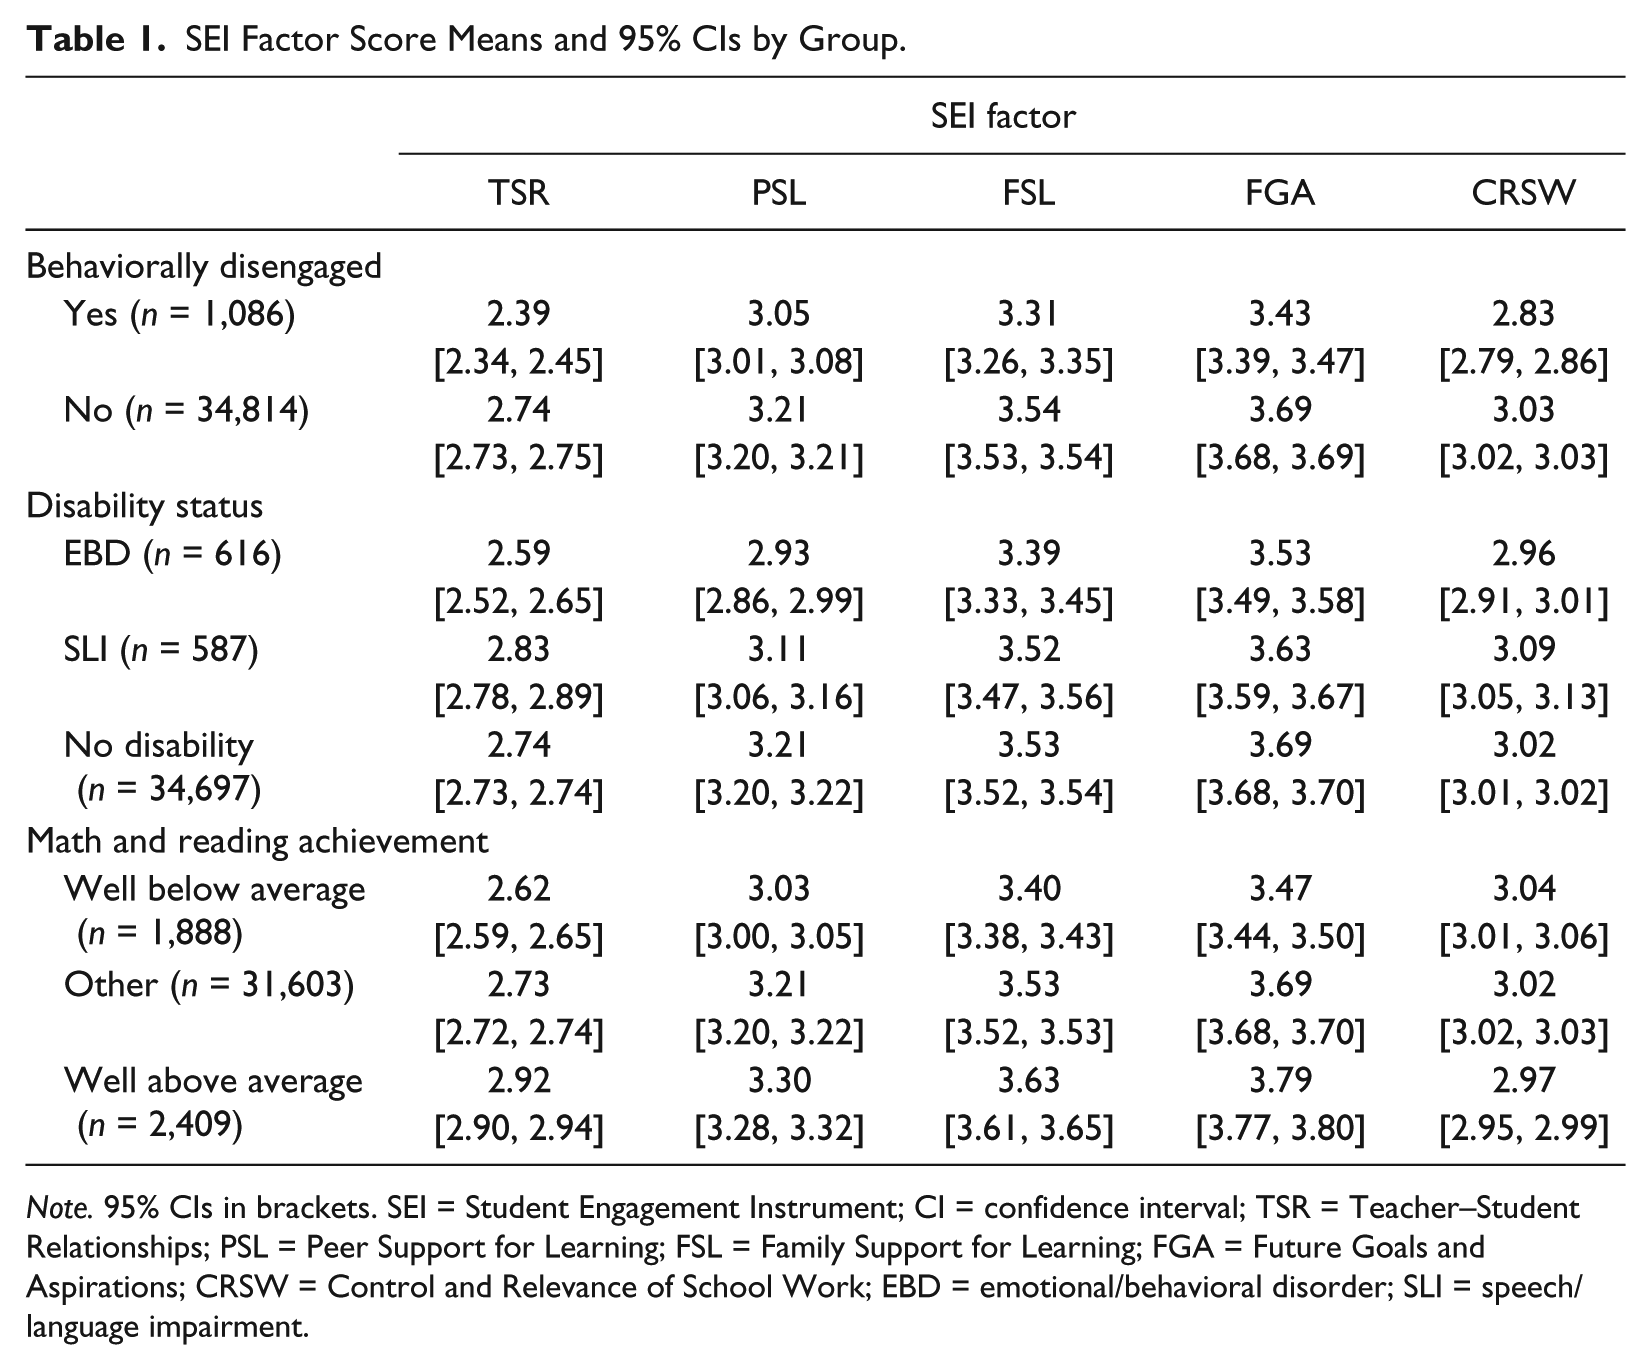
Note. 95% CIs in brackets. SEI = Student Engagement Instrument; CI = confidence interval; TSR = Teacher–Student Relationships; PSL = Peer Support for Learning; FSL = Family Support for Learning; FGA = Future Goals and Aspirations; CRSW = Control and Relevance of School Work; EBD = emotional/behavioral disorder; SLI = speech/language impairment.
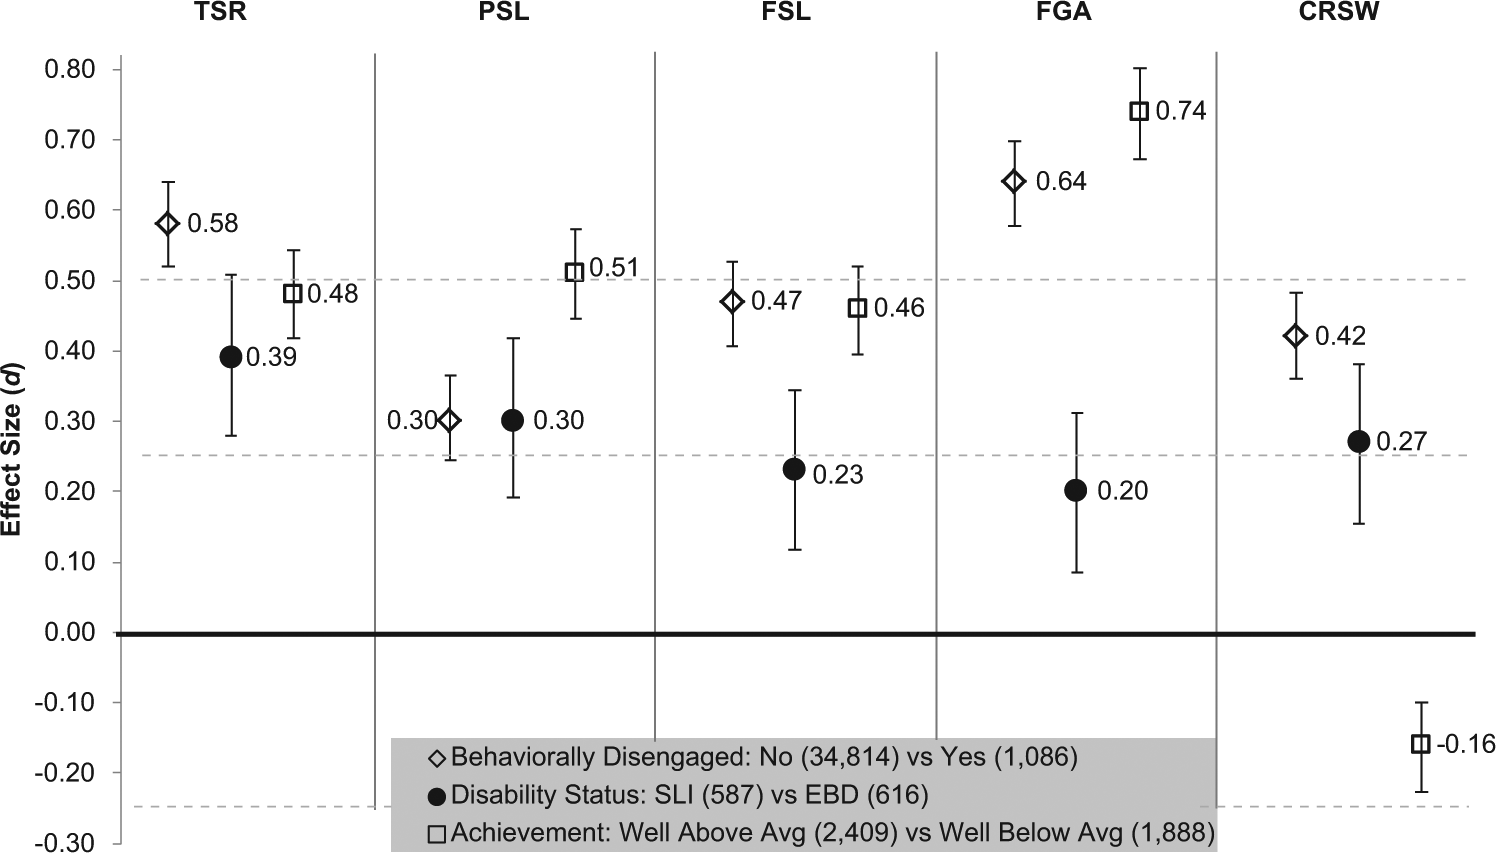
Effect sizes (ESs; Cohen’s d) for group mean differences on SEI factor scores.
Behavioral disengagement
Compared with students without the combination of frequent absences and multiple detentions/suspensions, d values indicated that behaviorally disengaged students reported lower TSR and FGA at a level of clinical significance. Furthermore, all three other factor comparison differences were educationally significant. All associations were in the expected direction.
Disability status
Compared with peers identified with a lower risk disability (SLI), students with a higher risk disability (EBD) reported lower TSR, PSL, and CRSW to a degree that was educationally significant. Although differences were in the expected direction and statistically significant for the FGA and FSL factors, ESs for these mean differences did not meet criteria for educational significance.
Math and reading achievement
Overall, the strongest student engagement association was found with comparisons between high versus low achievement. At a level of clinical significance, students who scored well above the district mean in math and reading reported higher PSL and FGA than students who scored well below the state mean. Differences in SEI factor scores on TSR and FSL approached clinical significance. Contrary to our hypothesis, CRSW was rated higher in the low achievement group. This relationship was statistically significant, but did not reach a threshold of educational significance.
Study 2: Predictive Associations With Graduation and Dropout
As of August 2011, 65.5% of the 2007-2008 ninth-grade cohort were on-time graduates (n = 7,594), 2.5% had earned a certificate of completion (n = 291), 5.8% were re-enrolled for year 5 (n = 666), 10.8% had transferred out of the district (n = 1,253), 10.4% had left for unknown reasons (n = 1,204), and 4.9% were identified officially as dropouts (n = 566). Results of multiple logistic regression analyses are presented in Table 2. In regressions with on-time graduation as the dependent variable (1 = yes, 0 = no), the OR for the effect of every SEI factor was statistically significant at the p < .001 level. The same was found for regressions with dropout as the dependent variable. FGA demonstrated the strongest association for each outcome. Specifically, holding gender, ethnicity, and economic disadvantage constant, a one-unit increase in FGA score was associated with at least a twofold increase in the odds of earning a diploma in 4 years, as well as a twofold decrease in the odds of dropping out. Similar to findings from concurrent validity analyses with the middle school cohort, CRSW exhibited the weakest associations overall with educational outcomes.
Multiple Logistic Regressions of Each SEI Factor on Graduation and Dropout.
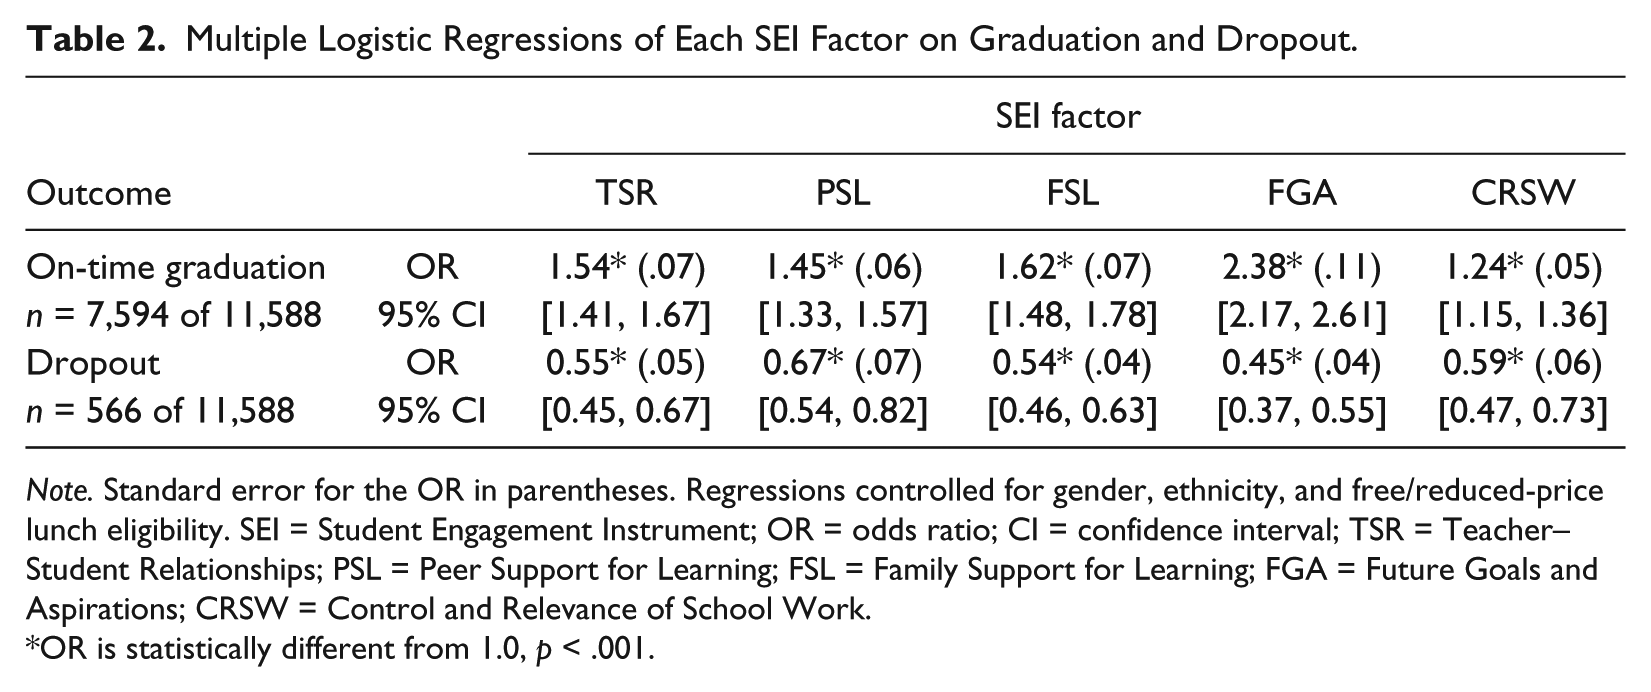
Note. Standard error for the OR in parentheses. Regressions controlled for gender, ethnicity, and free/reduced-price lunch eligibility. SEI = Student Engagement Instrument; OR = odds ratio; CI = confidence interval; TSR = Teacher–Student Relationships; PSL = Peer Support for Learning; FSL = Family Support for Learning; FGA = Future Goals and Aspirations; CRSW = Control and Relevance of School Work.
OR is statistically different from 1.0, p < .001.
Discussion
Our analyses of group differences in SEI factor scores showed statistically significant associations in all investigated group comparisons, with all but one association in the hypothesized direction. Although the ESs for most of these differences reached basic thresholds for practical significance, most did not reach levels of clinical significance. This pattern is consistent with the small correlations reported by Appleton et al. (2006) for SEI factor associations with disciplinary problems and academic achievement. Unlike Appleton et al.’s findings, however, some group differences were moderate in ES. Namely, self-ratings on TSR and FGA were substantially lower among students exhibiting high absence rates and signs of behavior problems. And scores on PSL and FGA were substantially higher for high-achieving than for low-achieving students. It is important to note that, in some cases, these stronger ESs are an artifact of asking the association question differently. For instance, investigating whether high achievers’ SEI scores are higher than those of low achievers ignores students who fall somewhere in between. In other words, although group differences were moderate in ES between high and low achievers, comparisons between the high or low group and the average would be smaller.
Another result consistent with previous research was the counterintuitive negative association between CRSW and academic achievement. Although the ES for this relationship was not of practical significance, it was statistically significant and is consistent with findings by Appleton et al. (2006) of small negative correlations with standardized reading and math scores (r = −.29 and −.26, respectively). To the best of our knowledge, this is the only other study of the SEI examining this association, and it is presently unclear why students who excel academically on standardized tests would be more likely to rate themselves lower on CRSW. One possibility is the influence of context. For example, in an environment that is not challenging enough, high-achieving students may be less likely to perceive that tests do a good job of measuring their competence. Another possible explanation may be psychometric. Specifically, Betts et al. (2010) found generally lower item factor loadings on CRSW than on other factors, as well as one cross-loading of a CRSW item, which may suggest construct validity issues that need to be addressed. Taken together, these results highlight a need for further examination of CRSW items and their relationship with achievement.
Our study of predictive validity demonstrated that—even when controlling for important demographic characteristics—SEI self-ratings in ninth grade predicted dropout and on-time graduation 4 years later with considerable consistency. Coefficients for the effect of SEI factor scores on each outcome were statistically significant in all comparisons, and many ORs indicated small to moderate ESs on the change in the likelihood of the outcome as SEI factor scores increased. These findings suggested clear, meaningful, and predictable associations between varying engagement levels and highly relevant educational outcomes—further support of the criterion validity of SEI scores. FGA stood out as the factor with the strongest associations to both dropout and graduation. This may not be surprising, as items on FGA relate specifically to plans to continue education following high school. Nonetheless, it is promising that student self-ratings in ninth grade on items about future educational goals provide predictive information that may help educators identify and intervene earlier with students whose expectations of post-secondary enrollment are fading.
Limitations, Implications, and Future Directions
The retrospective nature of the methods employed in this study precludes statements of causal relationships. Furthermore, the base rate in the population for some indicators (e.g., dropout) was somewhat low. To address these limitations, we encourage replication in other districts, particularly in settings with substantially higher risk for school failure.
Overall, the findings of this study suggest that greater confidence may be placed in the interpretation of SEI scores for students in the process of disengaging from school. Although many previously reported correlations between SEI scores and indicators of behavioral engagement/disengagement and achievement were small to non-significant, the results of this study show that—when following students over several years and when investigating groups representing extremes of the engagement continuum—there are consistent and educationally meaningful associations between SEI scores and relevant outcomes.
Most researchers and educational stakeholders agree that early screening for risk is a necessary component of systematic, evidence-based prevention programs (Christenson & Thurlow, 2004). Student engagement has been consistently identified as an important variable in school completion research (Reschly & Christenson, 2012), and although engagement is regarded as a multifaceted construct (Fredricks et al., 2004), researchers and practitioners tend to rely primarily on behavioral indicators. Cognitive and affective engagement data require additional effort to collect, but our findings suggest that it may be quite valuable. This research adds to a growing body of evidence that the SEI yields useful data regarding cognitive and affective engagement. Future research should explore how the SEI can be used in conjunction with other indicators in multifactor risk identification efforts.
Footnotes
Declaration of Conflicting Interests
The author(s) declared no potential conflicts of interest with respect to the research, authorship, and/or publication of this article.
Funding
The author(s) received no financial support for the research, authorship, and/or publication of this article.