
Abstract
The development and validation of the Brazilian Temperament Scale for Students (BTSS) are examined through the use of data from 1,258 children and adolescents, ages 10 through 21 (M = 15.0, SD = 2.1, 56% females). Three psychometric properties of BTSS are reported: its internal structure (e.g., validity), its reliability, and cut points to best distinguish between the bipolar styles for each of the scale’s four constructs (extroversion–introversion, practical–imaginative, thinking–feeling, and organized–flexible styles). Rasch analyses were used to estimate item intensity and students latent score parameters. The use of construct maps to help establish norms is described. The results of exploratory factor analysis using varimax rotation confirm the four scales’ intended bipolar factors are composed of items that theoretically represent the desired constructs. The confirmatory factor analysis for a four-factor structure generally displays good fit indexes. Infit and outfit values reach acceptable ranges (i.e., from 0.68 to 1.32). Results are interpreted using cut points.
Interest in temperament may be as old as recorded history. The scholarly foundation for temperament began as early as 350 B.C. when Hippocrates (1939), in his On the Nature of Man, described four humors or temperaments associated with body fluids thought to control or at least influence behavior. Later, Galen (1916; Kagan, 1994) extended Hippocrates’ work by describing four pathological temperaments (i.e., choleric, melancholic, phlegmatic, and sanguine) derived from four bodily fluids. Thus, temperament’s biological basis found its origin in these early Greek writings. The importance of temperament also is underscored in the writings of various philosophers, including Plato (Kagan, 1994), Aristotle (Kagan, 1994; Strelau, 1998), Hume (Kagan, 1994), Locke (Kagan, 1989, 1994), and Kant (Kagan, 1994; Strelau, 1998).
Contemporary interest in temperament emerged during the 19th and 20th centuries, coinciding with social and political changes in the United States and Western Europe that underscored the importance of the environment and personal choice in addition to biological links as determinants of behavior. Theories by Freud and his disciples (e.g., Adler, Sullivan, Horney, Erikson, and Jung) found favor, in part, by emphasizing the importance of environmental qualities, personal understanding, and decision making as central and strong forces affecting temperament and personality and, thus, behavior.
Jung’s Pioneering Theory
Among these theorists, Jung (1921/1971) advanced an enduring temperament theory, one that helped launch considerable research and test development (Bassett & Oakland, 2009). Jung attributed individual differences to inborn, possibly genetic or physiological personal qualities mediated by one’s environment. He emphasized the importance of two attitudes (i.e., extraversion–introversion) together with four mental functions (i.e., thinking–feeling and sensation–intuition) that affect the apprehension of stimuli. His writings focused heavily on extraversion–introversion, given his belief that they helped define important individual differences. However, for Jung, temperament is understood best by examining interactions between extroversion–introversion and the four mental functions (i.e., thinking–feeling and sensation–intuition), not by focusing on each dyadic pair separately.
Current Theory Foundational for Measurement of Temperament
Myers and Briggs extended Jung’s theory by adding a fourth bipolar quality, judging and perceiving (also described as organized and flexible), and developing a measure based on this theory: the Myers–Briggs Type Indicator (MBTI; Myers & McCaulley, 1985). Thus, the MBTI assesses the following four bipolar styles: extroversion–introversion, practical–imaginative, thinking–feeling, and organized–flexible 1 styles. This model of temperament has been used to examine temperament qualities in both adults (Hammer, 1996; Hammer & Mitchell, 1996) and children (Oakland, Glutting, & Horton, 1996).
Temperament refers to stylistic and relatively stable traits that subsume intrinsic tendencies to act and react in somewhat predictable ways to people, events, and other stimuli (Teglasi, 1998). Temperament traits are thought to be preferences, predispositions to display behaviors, a blueprint for them, with no assurance that people, events, and stimuli always elicit the same responses.
Scholarship on Children’s Temperament
Temperament can substantially affect children’s behaviors, including their personal motivation, learning styles, peer and family relationships, and values (Bates & Wachs, 1994; Joyce, 2010; Keogh, 2003; Oakland et al., 1996). Temperament influences vocational interests in children as young as age 8 (Oakland, Stafford, Horton, & Glutting, 2001) and may help distinguish children who display internalizing behavior difficulties (Harder, 1994), conduct and oppositional defiant disorders (Joyce & Oakland, 2005), suicidal ideation (Cross, Cassady, & Miller, 2006), and autism spectrum disorders (Darby, 2009). Thus, knowledge of children’s temperament shows promise for use in understanding its impact on children’s behaviors and helping guide their development.
Temperament as a Trait
Temperament scale items are often intended to assess a trait. Items utilize bipolar choices that reflect extremes on that trait. An example of an item assessing extroversion–introversion is as follows: After school, I most prefer to (a) spend time with others or (b) spend time alone. Persons must select either of the two options despite the fact they may prefer a little of both. In addition, on a 14-item measure of temperament type, the selection of 8 or more items constitutes a cutoff (midpoint cutoff) that determines a person’s preference for that trait (e.g., in the above example, either extroversion or introversion).
Psychometric Issues
The assessment of traits raises some psychometric issues. For example, items may represent different levels of attractiveness of the measured trait, thus leading to some likely imbalance in the selection of the two options. For example, on a scale assessing extroversion–introversion, its extroversion items may be more inherently appealing, resulting in a higher proportion of extroversion items being selected. In addition, reliance on normative interpretations of temperament data should consider that children and youth between ages 8 and 17 in 20 countries generally express a more frequent preference for extroverted (60%) than introverted (40%), practical (57%) than imaginative (43%), and organized (78%) than flexible (22%) styles. Males generally display a more frequent preference for thinking and females for feeling styles (Benson, Oakland, & Shermis, 2009; Callueng & Oakland, in press; Joyce, 2010). One fundamental assumption when doing these normative comparisons across cultures is that the same item, albeit in different languages, would have equivalent level of attractiveness. If not, this may introduce bias in normative references.
This study uses construct map methods to further investigate and establish cutoff scores. The use of construct maps, also called item referenced meaning (Embretson, 2006, Embretson & Reise, 2000), provides an alternative to the traditional norm referenced interpretation standard for defining parameter interpretations of scales. This method involves the analysis of item contents and their hierarchical organization in terms of attractiveness to provide substantial information in reference to how items represent the latent underlying construct.
Measurement Standards in Brazil
Despite the robust nature of the discipline and profession of psychology in Brazil, measures of children’s temperament do not exist there. However, Brazilian psychologists see value in using such measures to promote student understanding and development. The Federal Council of Psychology, Brazil’s national psychological association, together with the Brazilian Institute of Psychological Assessment, established standards for test quality. These standards have had a decisive influence on test quality in Brazil (Primi & Nunes, 2010). All tests used in Brazil are required to be reviewed by a national commission and found to provide empirical evidence of their validity, reliability, and norms relevant to Brazil. Thus, Brazilian psychologists interested in using a measure of temperament must rely on those that are approved by the Federal Council of Psychology. The contents of this article are consistent with and help address this national standard.
Purpose of This Study
This article discusses efforts to validate the Brazilian Temperament Scale for Students (BTSS), a Portuguese-language adaptation of Student Styles Questionnaire (SSQ; Oakland et al., 1996). The main focus of the article is to illustrate the use of construct maps to produce norms, in contrast to the more traditionally used method that focuses on midpoint cutoffs. Construct maps were used to define cut points to best distinguish each of the four bipolar styles (i.e., the constructs of extroverted or introverted, practical or imaginative, thinking or feeling, and organized or flexible styles). In addition, a series of analysis examined the scale’s internal structure (e.g., validity) and internal consistency (reliability). The data were expected to confirm each of the four scales’ intended bipolar factors composed by items that theoretically reflect the desired constructs. The data were also expected to show the factors provide reliable measures of these latent constructs and that the use of Rasch analysis would inform the best selection of cut points to distinguish each of the four bipolar styles. We expect items would be relatively equivalent across cultures. Thus, we anticipate that construct map derived cut points may not differ much from midpoint cutoffs. The use of Rasch methods to validate measures of temperament is growing (e.g., Mpofu, Oakland, & Gwirayi, 2010) yet remains less common than the more classic methods. Thus, this article may add to our literature by describing methods that affect data interpretation and utilization for tests designed to assess temperament in light of a four-construct trait theory.
Method
Participants
The BTSS data were obtained on 1,258 students, 95% of the sample with ages 10 through 18 (M = 15.0, SD = 2.1, 56% females). Brazilian children from middle class homes generally attend private schools, and those from lower class homes generally attend public schools. Fifty percent of the sample attended private or public schools. Thus, the sample is diverse with respect to socioeconomic status. It comes from 10 schools located in one state of Brazil.
The total sample was divided into two smaller samples. Data from Sample 1 (N = 598, M age = 15.8, SD = 1.7; 55% females) were used to select items through the use of exploratory factor analysis. Data from Sample 2 (N = 660, M age = 14.5, SD = 2.3; 57% females) were used to cross-validate item selection through the use of confirmatory factor analysis.
Measures
The BTSS is patterned after the United States–developed SSQ and the MBTI (Myers & McCaulley, 1985). Thus, this article and pencil self-report measure utilize the Jungian constructs (1921/1971) popularized by the MBTI. The BTSS’s initial 100 forced choice items assessed two alternatives, each representing opposite poles, to assess the four bipolar traits: extroversion (E) or introversion (I), practical (P) or imaginative (M), thinking (T) or feeling (F), and organized (O) or flexible (L) style.
Extroversion–Introversion (E-I) styles (31 items) refer to where people prefer to obtain energy. Those who prefer extroverted styles generally rely on others as a primary source of their energy; in contrast, those who prefer introverted styles generally rely on themselves as a primary source. Practical–Imaginative (P-M) styles (26 items) refer to how people prefer to learn and process information. Those who prefer practical styles generally focus on small and important details and often memorize well; in contrast, those who prefer imaginative styles generally focus on broad issues and theories and generalizations.
Thinking–Feeling (T-F) styles (16 items) refer to how people prefer to make decisions. Those who prefer thinking styles generally use objective standards and value truth; in contrast, those who prefer feeling styles generally use subjective standards and value harmony. Organized–Flexible (O-L) styles (27 items) refer to when people prefer to make decisions. Those who prefer organized styles generally make decisions as soon as possible; in contrast, those who prefer flexible styles generally postpone decisions as long as possible (Oakland et al., 1996).
Procedures and Data Analysis
Students completed the BTSS in their classrooms as a part of their regular school activities. Informed consent was obtained from parents and school directors and informed assent from the students.
Three procedures were used to analyze the data. Exploratory full information factor analysis used the TESTFACT program with an oblique rotation (promax; Wilson, Wood, & Gibbons, 1991) on item data from Sample 1 with the goal to select items that best reflect the measure’s hypothesized four-factor model. Item options that assess preferences for introversion, imaginative, feeling, and flexible styles were coded 1, while item options that assess preferences for the alternative four styles (i.e., extroversion, practica, thinking, and organized styles) were coded 0.
Confirmatory factor analysis, using AMOS 16 and data from Sample 2, was used to test the internal structure of the items selected during the analysis of Sample 1 data. The parameters were estimated through maximum likelihood methods (Arbuckle, 2007). Using data from the exploratory factor analysis, four to five items of the same factor were combined to form item parcels. Items with low variance were combined with items of moderate variance. This method creates variables that display greater variance (increasing the variance from 0-1 to 0-4 or 0-5), thus avoiding variance-related problems common with the analysis of dichotomized data. This strategy is consistent with that used during the development and validation of the SSQ (Oakland et al., 1996). Item parcels were considered to reflect their respective constructs. We tested whether a model of four correlated latent factors accounted for the covariance between item parcels. The model fit was tested using four indexes consistent with recommendations from Byrne (2001) and Schweizer (2010).
Finally, a Rasch model was used with each of the four bipolar scales to estimate item intensity and students’ latent score parameters. Data from Samples 1 and 2 were combined for this analysis. The four construct maps that represent items and persons on a same scale were analyzed to define normative reference points using item referenced meaning (Embretson, 2006). Rasch models the probability of a response “1” as
Results
Full Information Exploratory Factor Analysis for Item Selection
As noted previously, the first phase of data analysis utilized data from Sample 1 in an exploratory factor analysis to identify items that best reflect the measure’s hypothesized four-factor model. The tetrachoric correlations averaged 0 with a SD of 0.19. This result was expected because of the expected balance of positive and negative correlations between the items. The first eight eigenvalues extracted from the correlation matrix were 9.6, 8.4, 5.1, 4.6, 3.7, 3.0, 2.95, and 2.7. These values indicate a non-one-dimensional pattern as reflected in the ratio between the first and second eigenvalue of 1.17, a figure well below 5, a criterion usually considered a crude benchmark for unidimensional solutions. Scree plot data provide support for the retention of three or four factors. Consistent with theory, four factors were extracted. Promax and varimax rotations of the factor loadings were analyzed. Promax-derived factor correlations were negligible—all less than .16. Therefore, the matrix of varimax rotated factor loadings was utilized to select items.
Data in this matrix initially indicated the items tended to group coherently according to the four constructs in the following order of extraction: O-L, E-I, P-M, and T-F. Item selection was based on three criteria: theory (i.e., items should reflect behaviors consistent with their theoretical construct), item loadings (i.e., item loading should be at least 0.30 on the expected factor), and variance (i.e., items endorsement rates between 0.25 and 0.75, that is, neither too extreme in either direction). The use of these three criteria leads to the initial selection of 12 items for O-L, 16 for E-I, 14 for P-M, and 9 for T-F—for a total of 51 items.
A second search was conducted by lowering the loading criteria from 0.30 to 0.20 and widening the range of item difficulty from 0.15 to 0.85 in an effort to increase the number of items. This search added 6 items to the O-L Scale, 3 to the E-I Scale, 1 to the P-M Scale, and 4 to the T-F Scale—thus creating a total of 65 items for the final test—item numbers comparable with those in the SSQ.
A final exploratory factor analysis, with varimax rotations, examined data from the 65-item test. Table 1 summarizes statistics on item factor loadings (i.e., M, median, SD, minimum, and maximum). As expected, the factor loadings either are positive or negative depending on which of the two item options (either “a” or “b”) was coded high (i.e., L, I, M, or F) or low (O, E, P, or T). The loadings cluster between 0.30 through 0.50. The internal consistency is higher for O-L and E-I and lower for T-F and P-M.
Summary Statistics of Absolute Values of Item Factor Loadings of the Final 65 Selected Items.
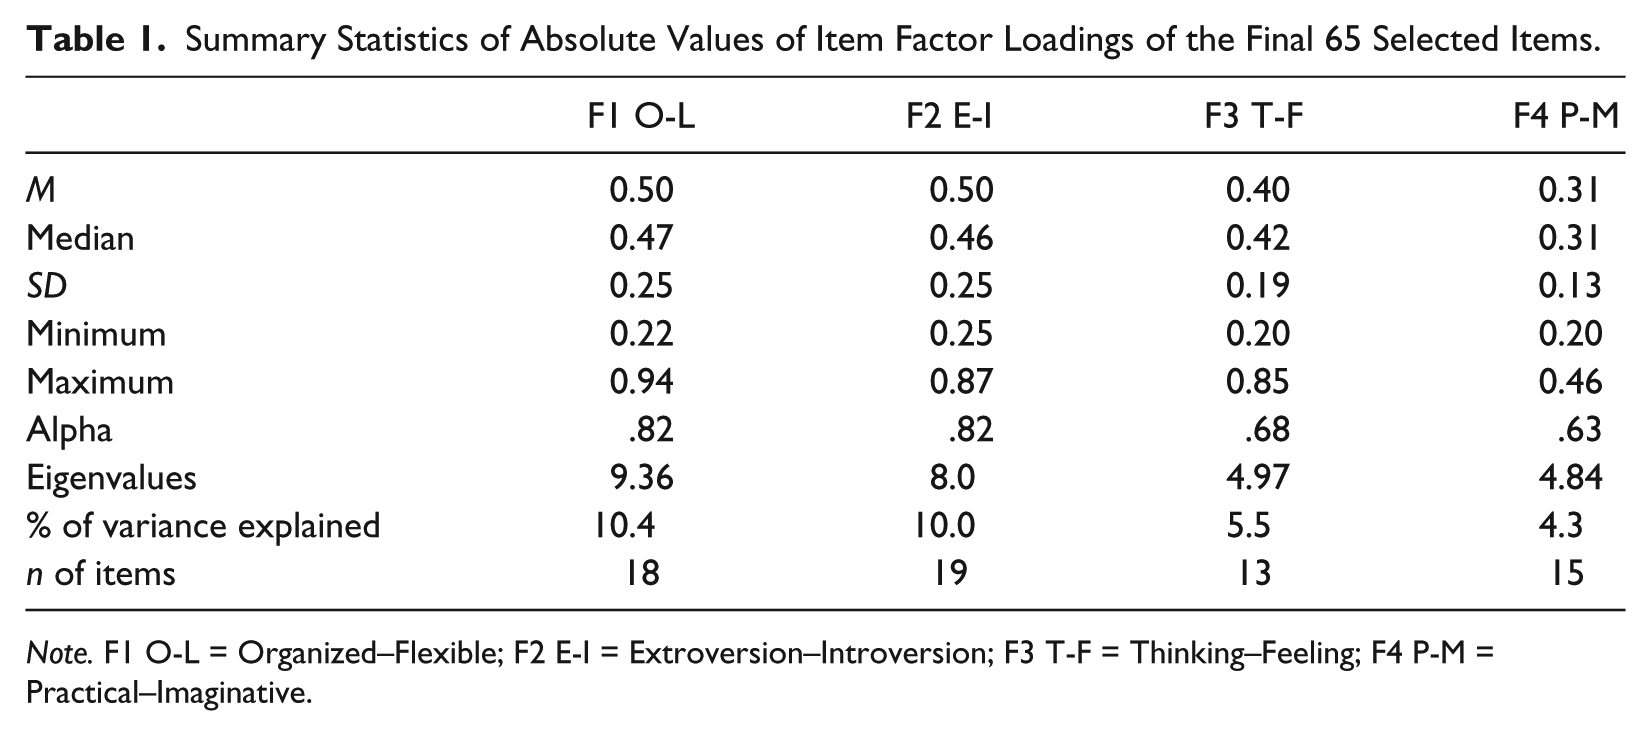
Note. F1 O-L = Organized–Flexible; F2 E-I = Extroversion–Introversion; F3 T-F = Thinking–Feeling; F4 P-M = Practical–Imaginative.
Confirmatory Factor Analysis: Cross Validating the Model
Confirmatory factor analysis then was used to examine data from Sample 2 to cross-validate the internal structure of scales formed by the selected items. During this second analysis, four to five items were bundled to form 14 facet subscales. The goal of item bundling was to achieve balance in the item difficulty within each facet and to create item variance. Descriptive statistics for the 14 facets subscales and their intercorrelations are reported in Table 2. The metric for the facet scores range between 0 and 1. For example, using a four-item facet, a student who selects all four flexible options will receive a score of 1 and those who select all four organized options will receive a score of 0.
Descriptive Statistics and Correlation Coefficients Between Each Facet of Item Parcels.

Note. F1.1, F1.2 F1.3 F1.4 (Item Parcels 1 to 4 for Factor 1). Other item parcels are named in a similar way. r >.30 in bold face
As expected, almost all facets approximate an average item endorsement of 0.50. Its SD of 0.26 indicates the scores range somewhat widely. Skewness and kurtosis coefficients indicate that the distributions are close to normal. This conforms to required multivariate normality that usually is assumed by most confirmatory factor analysis methods. Facet subscales distributions tend to be symmetric and spread more broadly (i.e., to display negative kurtosis). All correlations greater than .30 occur within facets of the same underlying factor.
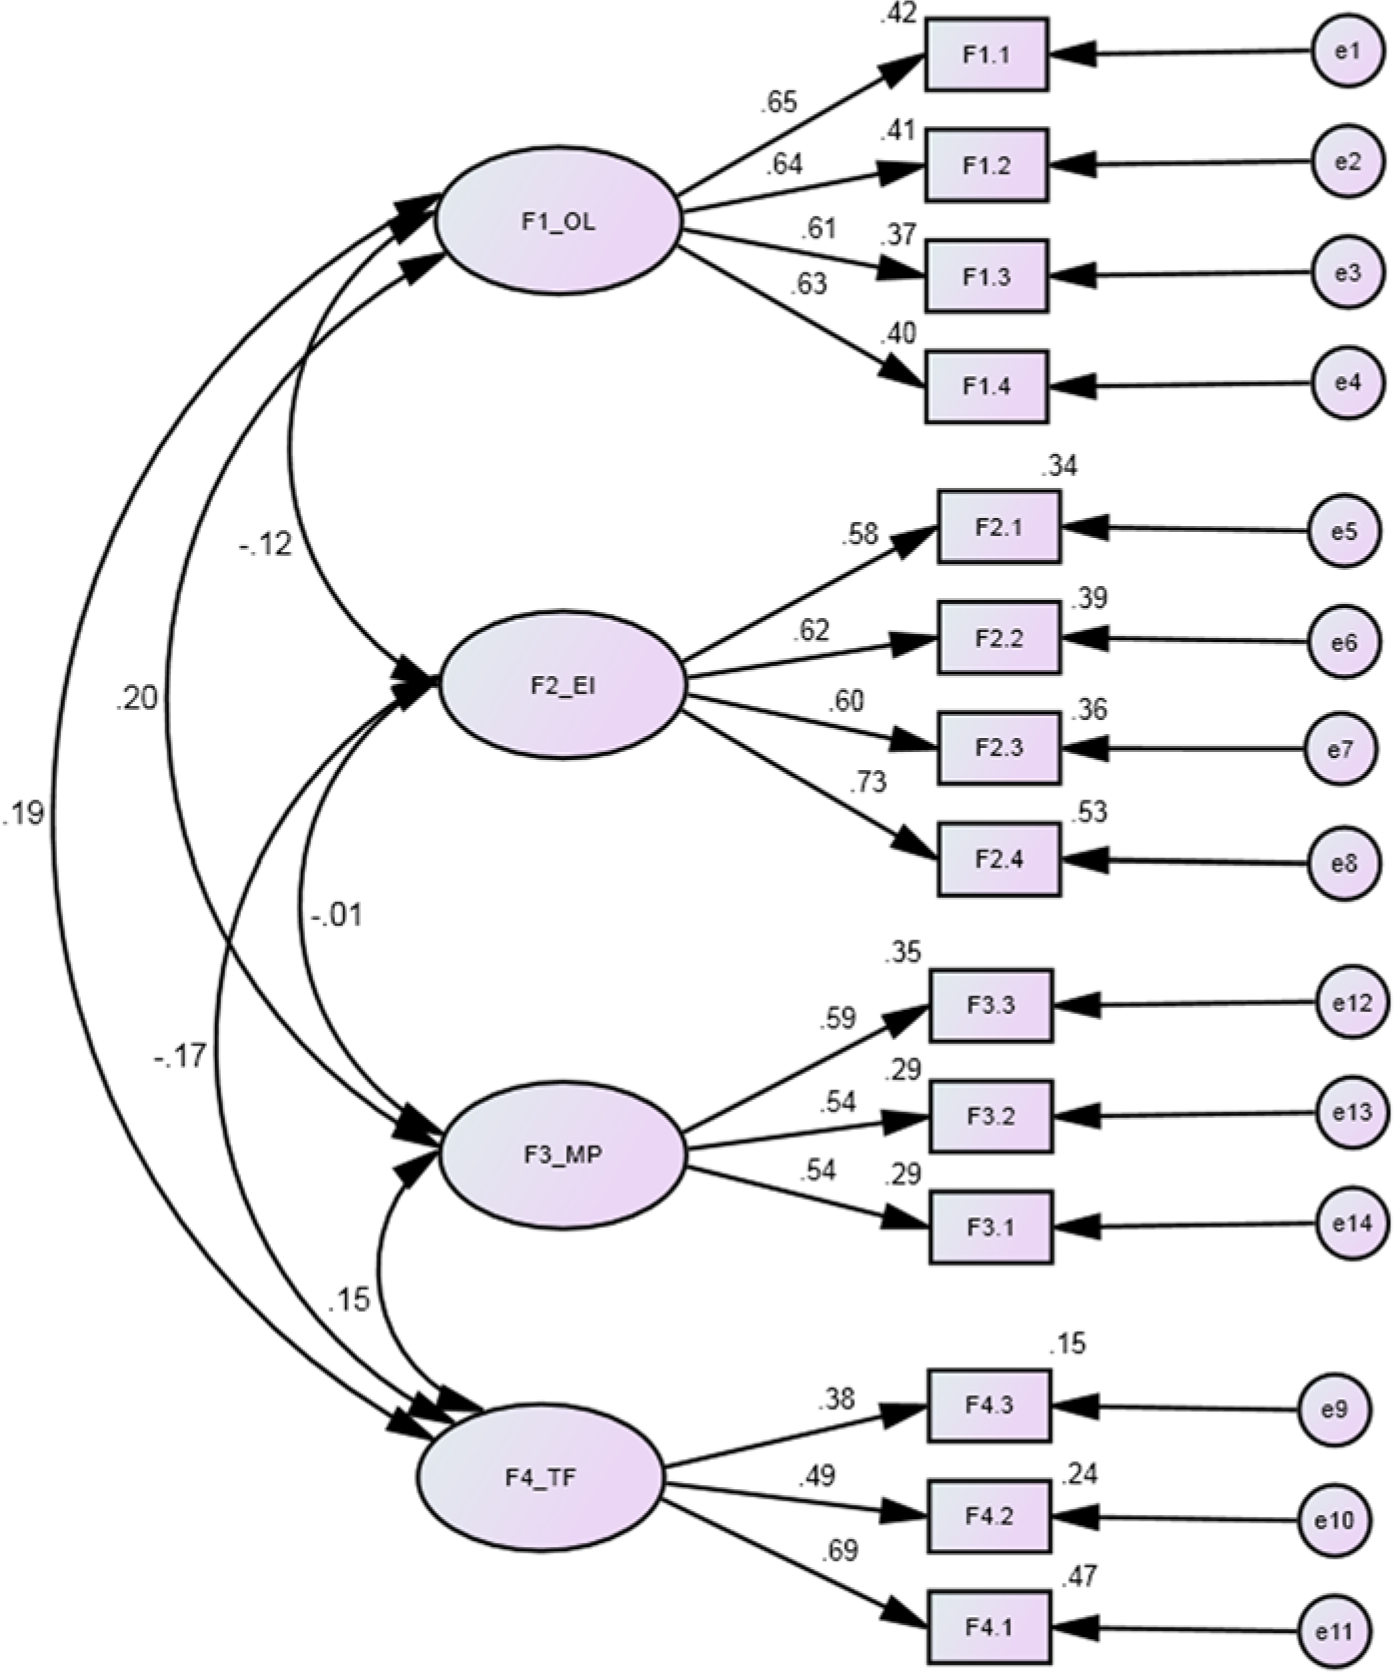
Confirmatory factor analysis tested a four-factor structure. Each facet subscale was considered an indicator of its latent factor. The model was estimated using the maximum likelihood method. Fit indexes are good: χ2 = 162.3, df = 71, χ2/df = 2.3, root mean square error of approximation (RMSEA) = 0.04, comparative fit index (CFI) = 0.93, Standardized Root Mean Square Residual (SRMR) = 0.05.
Figure 1 displays the final model with the standardized factor loadings and the proportion of variance explained for each indicator. All loadings are equal to or above 0.38. A comparison of the unstandardized loadings by its standard errors found all loadings reached statistical significance except for the one between latent factors F3 P-M and F2 E-I. Thus, using this second sample, the subtest intercorrelations generally support the use of the four-factor model.
Final four-factor model with standardized factor loadings and squared multiple correlations.
Scale Interpretation: Item Referenced Meaning
The following illustrates the use of item referenced meaning while examining the BTSS data to help establish cut points to best capture student’s temperament styles. The parameters for each item and student are calibrated on each of the four bipolar scales using Rasch modeling methods (i.e., the use of unconditional maximum likelihood estimation performed by WINSTEPS; Linacre, 2011). This process calibrates item difficulty parameters and person scale latent scores that best approximate the observed data in accord with the constraints of the model. Fit statistics are then calculated to assess model fit.
Infit and outfit values are commonly used. These values are directly proportional to the residuals that reflect difference between the observed and expected responses as hypothesized from knowledge of the model parameters, thus providing evidence of how well the model fits that data. Values more than 1.3 indicate a misfit . Infit and outfit statistics calculated for items from the four bipolar styles together with descriptive statistics of the b parameter (i.e., item difficulty indexes) are summarized in the upper half of Table 3.
Fit Indexes of the Rasch Modeling of the Four Bipolar Factors and Final Summary of Normative Statistics and Prevalence Rates for Each Style for the Entire Sample (N = 1,267).
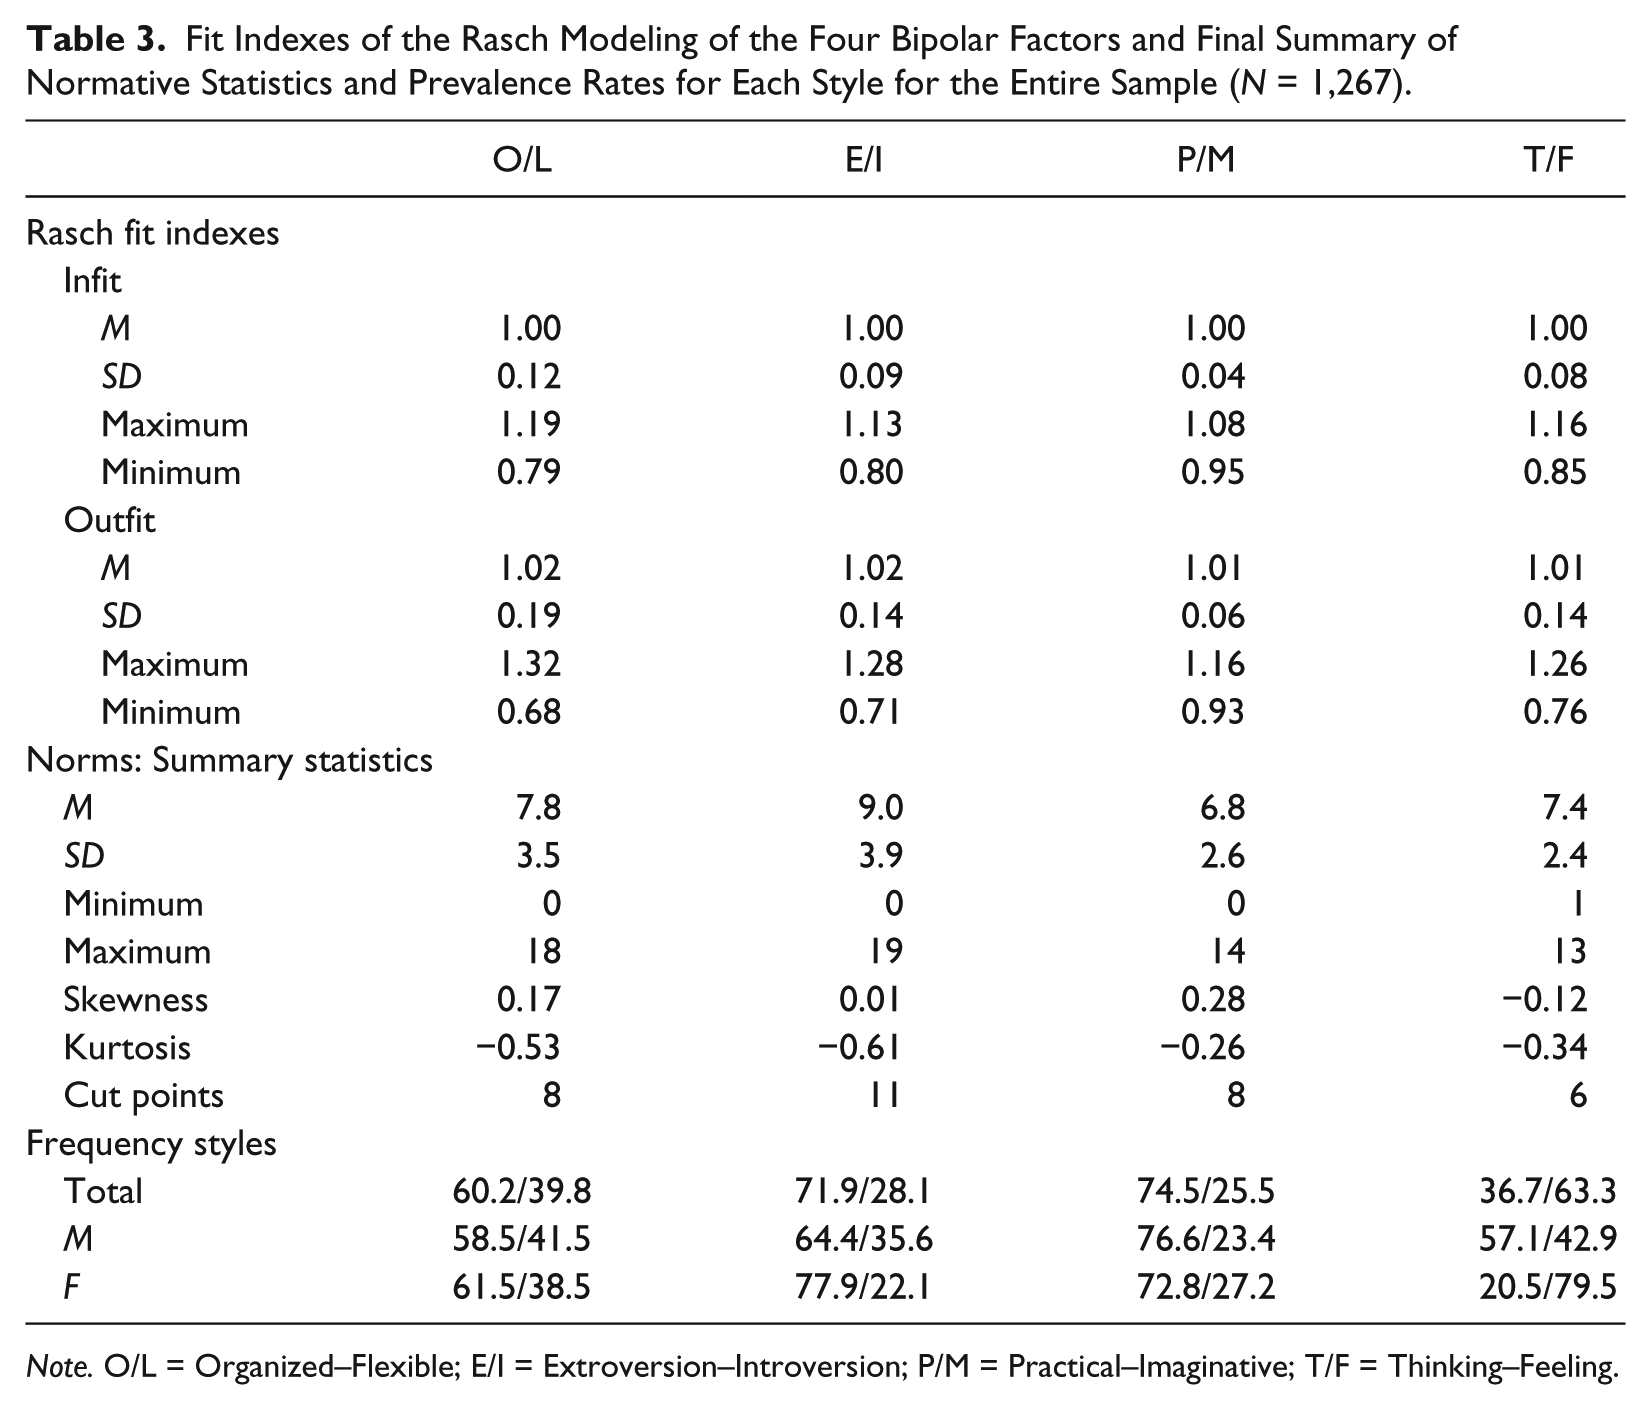
Note. O/L = Organized–Flexible; E/I = Extroversion–Introversion; P/M = Practical–Imaginative; T/F = Thinking–Feeling.
All fit statistics values but one are within acceptable ranges (i.e., from 0.68 to 1.32) along with the expected means of 1. One item from Factor 1 (O-L) has an outfit value greater than 1.3. Nevertheless, this model generally represents the pattern of responses suitably.
Item maps were then considered. These figures plot the item difficulties and expected responses as a function of a student’s test total score. The amount of data produced by this method is too large to discuss fully. Thus, the following discussion of item maps is limited to one bipolar factor, T-F (Figure 2).

Item map for thinking–feeling (not all items were included to save space).
Importantly, the maps provide information on the relationship between scale levels and expected responses. Figure 2 shows a black line on theta = .38, a figure that corresponds to an average student in this sample. The use of this line from low to high enables us to identify the expected response of an average student. For each item, if this line crosses to the right of symbol “:” then, for this level of theta, the feeling response is most likely to be selected (e.g., p > .50, an option for item F4_V24, and so on). Therefore, in summary, this map informs us how students with different levels on the T-F Scale describe themselves in terms of the test items. This information can be used to assign a more substantive meaning to the scale points based on item content.
For example, an average student has a probability greater than 50% to select Feeling options on Items 24, 34, and 11. We can be less certain whether the average student would select Items 79, 67, and 7 because their b’s are close to the average trait level for the students. In contrast, the average student is likely to select Thinking options on Items 72 and 53. The dotted lines on Figure 2 indicate extreme scores, namely, those that provide greater clarity when defining the student’s preferred temperament style. The scores from most students are located somewhere between these lines. As seen in Figure 2, the sample tends to be more inclined to prefer a feeling style than a thinking style. The use of a table that converts theta into observed scores enables us to see that, on average, among the 13 T-F items, the average student selects 8 Feeling options.
The selection of a cut point based on item content requires us to locate an item (or an item set) that clearly marks each style and to use its location (or an average of item locations) as a cut point. The cut point was chosen in the region of Items 34, 11, 79, 67, and 7. The scale is keyed toward the feeling options. The thinking style options have lower endorsement rates whereas the feeling style options have higher endorsement rates even for people who prefer a thinking style. The examination of items by level of difficulty suggests Brazilian students generally prefer feeling to thinking styles.
Data from the other three bipolar scales (i.e., E-I, P-M, and O-FL) were analyzed similarly and their cut points identified. Descriptive statistics for the total score of the four bipolar scales based on the 65-item test are summarized (lower half of Table 3). The cut points (on the raw score scale) and the frequency of each style for the entire sample divided by gender are summarized in the lower section of Table 3. These percentages can be used as prevalence rates for the development of continuous prevalence-based Tscores as was done in the SSQ (Oakland et al., 1996).
Discussion
A four-factor model represents BTSS items consistent with theory and other temperament measures (e.g., SSQ and MBTI). Two scales (i.e., O-F and E-I) display good reliability, while the other two (i.e., T-F and P-M) display lower yet acceptable levels of reliability. Reliability estimates of the latter two bipolar styles are also relatively lower in the SSQ (Oakland et al., 1996).
The use of Rasch item maps as an auxiliary method seemingly has considerable potential to help create scale interpretations of different temperament styles. The BTSS was designed to help identify students’ preferred temperament styles and then to use the combined profile to identify their more complex psychological type. A traditional way to define students’ preferences is to use the midpoint cutoff. However, when items are translated for use in a different culture, their attractiveness could change leading to unbalance level of attractiveness for each pole of the scale. This could occur because the relationship of an indicator with the latent construct (i.e., their loading and difficulty) could change in different cultures.
This study used a global analysis of construct maps to define more substantive cutoff points. Results show that this set of cutoffs does not differ substantively from the mid cutoff points. These results provide additional evidence for the validity of the interpretations intended from the BTSS data. At the same time, this study illustrates the use of item reference meaning (Embretson’s, 2006, name for construct map analysis) as a method to create normative references. This procedure does not demand a representative normative sample and therefore is useful when adapting tests to different cultures when this information is not yet available. Thus, this article illustrates the method of establishing cut points based mainly on the information available on that item set and the theory that justifies it. Item reference meaning permits an analysis of the meaning of cut scores by the implied descriptions based on item content. Item reference meaning also facilitates a comparison of the relative positions of items and how they define the intensity of the dimension. This method could be useful when comparing data from different samples, including those that come from different countries.
One limitation of the present study is that it analyzes only one sample from one culture. Additional research is needed that compares construct maps derived from samples of persons from different cultures through the use of differential item functioning as well as how changes in item hierarchy affect the derivation of cutoff points using the procedures described in this article.
Footnotes
Declaration of Conflicting Interests
The author(s) declared no potential conflicts of interest with respect to the research, authorship, and/or publication of this article.
Funding
The author(s) disclosed receipt of the following financial support for the research, authorship, and/or publication of this article: This research was supported by a grant from National Council of Scientific Research (CNPq).