




Abstract
Two exploratory bifactor methods (e.g., Schmid–Leiman [SL] and exploratory bifactor analysis [EBFA]) were used to investigate the structure of the Woodcock–Johnson III (WJ-III) Cognitive in early school age (age 6-8). The SL procedure is recognized by factor analysts as a preferred method for EBFA. Jennrich and Bentler recently developed an alternative EBFA procedure. They claim that EBFA more readily produces independent cluster structure and overcomes the proportionality constraint experienced by the SL. The results of both analyses support the preeminence of the g factor at age 6 to 8. Examination of omega coefficients, the divergent factor structure, and the small amount of variance accounted for by the lower order factors suggests caution when interpreting beyond the higher order factor. Implications for interpretation of the WJ-III Cognitive at age 6 to 8 are discussed.
Keywords
Since its development, the factor structure of the Woodcock–Johnson III (WJ-III) has been primarily investigated and subsequently validated using confirmatory factor analysis (CFA; see Keith et al., 2010; Taub & McGrew, 2004). This is concerning because the WJ-III was substantially revised and predicated on a new theory of cognitive ability. Generally, when a new instrument is significantly revised and reformulated based on a new theory of cognitive ability, then both exploratory and confirmatory methods are necessary to elucidate structure (Gorsuch, 1983). Exploratory factor analysis (EFA) is also appropriate when initial CFA results are unclear or inadequate (Gorsuch, 1997). In a set of independent analyses on the WJ-III, Dombrowski and colleagues (e.g., Dombrowski, 2013a, 2013b; Dombrowski & Watkins, 2013) subjected the correlations matrices (age 9 to 90 plus) to exploratory bifactor analysis (EBFA) via a Schmid–Leiman (SL) Orthogonalization. Dombrowski et al. found not only possible overfactoring but also a factor structure that diverges from that presented in the Technical Manual. Dombrowski et al. used the same exploratory bifactor procedure (i.e., SL) that was used by Carroll (1993) to create and validate his Three Stratum Theory of Cognitive Abilities. Carroll’s theory was influential in the development of Cattell–Horn–Carroll (CHC) theory and the WJ-III. It is unknown why the authors of the WJ-III chose to rely solely on CFA procedures to validate the WJ-III when the instrument was substantially revised and predicated on a new theory of cognitive ability (e.g., CHC Theory).
The purpose of this article is to investigate the structure of the WJ-III Cognitive in early school age (6-8) using two methods of EBFA (i.e., SL and EBFA). Exploratory bifactor modeling is recommended when seeking to understand new or substantially revised cognitive ability instruments because of the frequency of higher order factors and correlated traits within those domains. The SL procedure is an elegant exploratory bifactor model with a history of use in the cognitive ability literature (see Canivez, 2013; Carroll, 1995). It helps to uncover simple structure by partialing out the influence of higher order factors (Carretta & Ree, 2001; Carroll, 1993, 1995, 2003; Gustafsson & Snow, 1997). Carroll (1995) argued that orthogonal factors are appropriate only when produced in the context of a SL solution: “I insist, however, that the orthogonal factors should be those produced by the Schmid–Leiman (1957) orthogonalization procedure” (p. 437).
Concerns have been raised about a possible limitation of the SL procedure (Brunner, Nagy, & Wilhelm, 2012; Dombrowski, 2013b; Reise, 2012; Reise, Moore, & Haviland, 2010; Yung, Thissen, & McLeod, 1999). Loadings obtained via the SL may contain proportionality constraints (Yung et al., 1999) that could produce a biased estimate of corresponding population values (Reise, 2012). Jennrich and Bentler (2011) recently developed a type of EBFA that they claim overcomes the SL’s proportionality constraint. Jennrich and Bentler (2011) contended that because their analytic bifactor model is more general than the two-stage model on which the SL is based, there may be cases where EBFA produces loadings that approximate bifactor structure more readily than SL. However, an application on real-world data has not been presented in the literature. Reise et al. (2010) predicted that that the impact of proportionality on real-world data will be negligible if a researcher is interested in identifying patterns of salient and nonsalient loadings.
Because the WJ-III has been recently criticized as being overfactored and having a divergent factor structure from that posited in the Technical Manual (e.g., Dombrowski, 2013a, 2013b; Dombrowski & Watkins, 2013) and within CFA studies (Keith et al., 2010; Taub & McGrew, 2004), an analysis using two methods of exploratory bifactor modeling may be worthwhile. A basic premise of factor analysis posits that when multiple methods of factor analysis converge, then confidence in a derived factor structure may be accomplished (Gorsuch, 1983).
Method
Participants
The data for the WJ-III Cognitive norms were collected from a nationally representative sample of 8,818 participants from age 2 through 90 plus. The WJ-III Technical Manual reports that the normative data were matched to the 2000 U.S. Census for geographic region, community size, sex, race, educational level, and occupation. Demographic characteristics are provided in the WJ-III Technical Manual. For this study, the early school aged period (6-8 years) subtest correlation matrices (20 by 20) were obtained from the Technical Manual. The 6 to 8 age range contained an average of 870 participants.
Instrument
The WJ-III Tests of Cognitive Abilities (WJ-III Cognitive; Woodcock, McGrew, & Mather, 2001c) contains 20 cognitive tests that are purported to measure g and seven CHC factors: visual–spatial thinking (Gv), fluid reasoning (Gf), processing speed (Gs), long-term retrieval (Glr), auditory processing (Ga), short-term memory (Gsm), and comprehension–knowledge (Gc). The WJ-III also yields a general intellectual ability score reflective of g.
Procedure
The correlation matrices within this study were analyzed using Bartlett’s (1950, 1954) Test of Sphericity and the Kaiser–Meyer–Olkin (KMO; Kaiser, 1974) statistic to determine appropriateness for factor analysis. Next, minimum average partials (MAP; Velicer, 1976) and parallel analysis (Horn, 1965) were used to determine the number of factors to extract. These procedures were conducted using O’Conner’s (2000) SPSS program. A Horn Parallel Analysis (HPA) scree plot (Cattell, 1966; Horn, 1965) was also inspected (Figure 1) as a supplemental means to determine the number of factors to retain for rotation (Thompson, 2004; Velicer, Eaton, & Fava, 2000; Zwick & Velicer, 1986). The intercorrelation matrix was subject to EBFA (Jennrich & Bentler, 2011) using R code. The SL (1957) procedure was also applied to the oblique first-order factors following a principal axis factoring with promax rotation. The SPSS code developed by Wolff and Preising (2005) was used for this analysis. Both SL and EBFA forced the seven-factor fit, permitting a comparison of exploratory bifactor fit with the structure posited in the Technical Manual. Finally, omega coefficients were determined using a program developed by Watkins (2013).
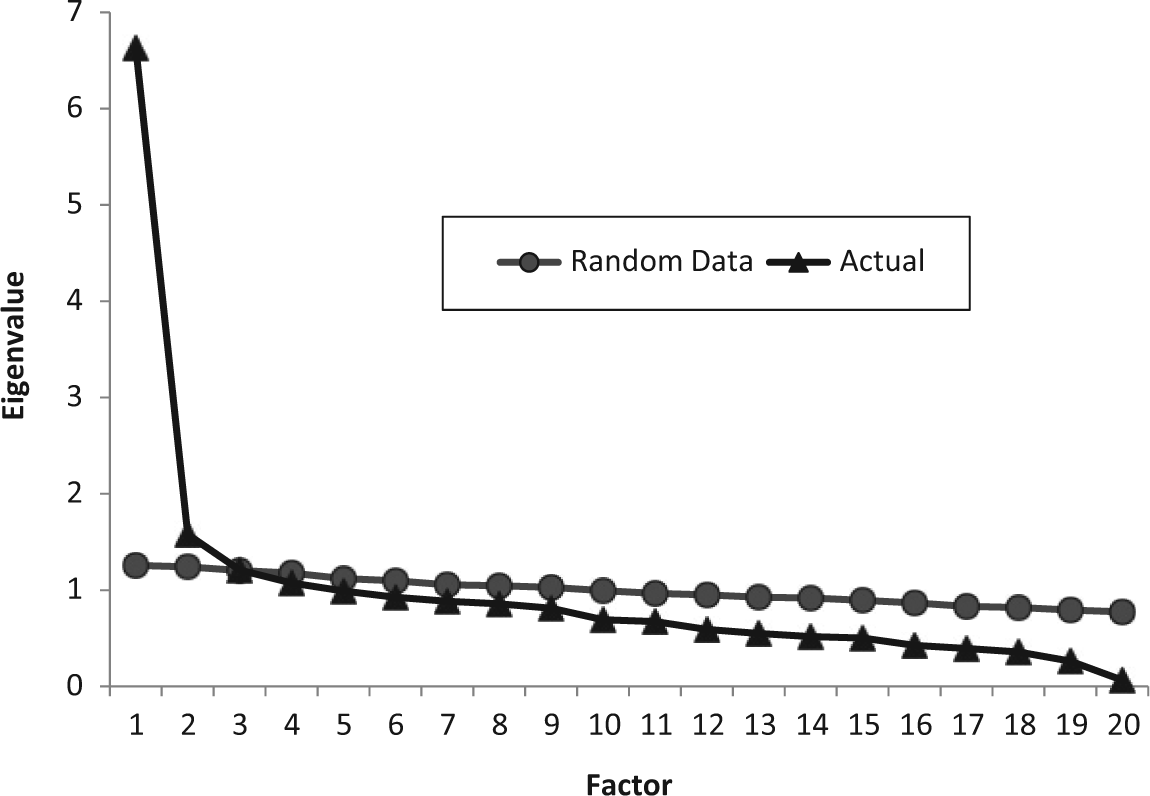
Scree plots for HPA for the WJ-III Cognitive Age 6 to 8.
Results
Exploratory (First Order) Analyses
Results from Bartlett’s (1950) Test of Sphericity indicated that the correlation matrix was not random, χ2 = 6,955.81, df = 190, p < .000. The KMO (Kaiser, 1974) statistic was .875, well above the minimum standard for conducting a factor analysis suggested by Kline (1994). Measures of sampling adequacy for each variable were also within reasonable limits. Thus, the correlation matrices were appropriate for factor analysis.
Factor extraction criteria
Parallel analysis (Horn, 1965) suggested the retention of three factors whereas the MAP (Velicer, 1976) criterion recommended retention of four factors. An HPA scree test (Figure 1) indicated evidence for one strong factor with the possibility of one to two additional factors. Because MAP recommended the retention of four factors and parallel analysis recommended the retention of three factors, both a three- and a four-factor solution were extracted and analyzed. The four-factor solution was neither psychometrically nor theoretically viable as it produced a trivial fourth factor with no salient (≥.30) loadings in the SL analysis and a single subtest loading in the EBFA analysis. Therefore, the three-factor solution was considered to be the most psychometrically plausible. Because the three-factor solution diverged significantly from the seven-factor fit presented in the Technical Manual, seven factors were also extracted.
Hierarchical Factor Analysis (SL Orthogonalization and EBFA)
Forced seven-factor solution
Results from the Schmid and Leiman (1957) procedure and Jennrich & Bentler’s (2011) EBFA procedure on the forced seven-factor solution are found in Tables 1 and 2. With EBFA, the higher order factor accounted for 29.26% of the total variance and 56.27% of the common variance. The SL analysis accounted for 29.65% of the total and 60.92% of the common variance. The general factor accounted for between 7% and 55% (Mdn = 28.5%) of individual subtest variance in the EBFA. The g factor accounted for between 8% and 67% (Mdn = 29.5%) of individual subtest variability in the SL analysis. For EBFA, the seven first-order factors accounted for a small proportion of the total variance (1.857%-5.39%) and common variance (3.55%-10.36%). The first- and second-order factors combined to measure 52.0% of the variance in the WJ-III Cognitive, reflecting 48.0% unique variance. For the SL analysis, the seven, first-order factors accounted for 1.52% to 1.71% of the total variance and 3.13% to 10.01% of the common variance. The first- and second-order factors of the SL analysis combined to measure 49.0% of the variance in the WJ-III, reflecting 51.0% unique variance. The results of both analyses demonstrate a robust manifestation of general intelligence where the combined influence of general intelligence and uniqueness exceeded the contributions made by the first-order factors.
Schmid–Leiman Orthogonalization Procedure.

Note. Loadings ≥.30 are italicized. Note that alignment of subtests with respective seven broad Cattell–Horn–Carroll (CHC) first-order factors posited in the Woodcock–Johnson III (WJ-III) Technical Manual is indicted following each subtest name (Gc, Gs, Ga, Glr, etc.). h2 = Communality coefficient; u2 = Uniqueness; ωh = Omega Hierarchical; ωs = Omega Subscale.
Exploratory Bifactor Analysis (Jennrich & Bentler, 2011).
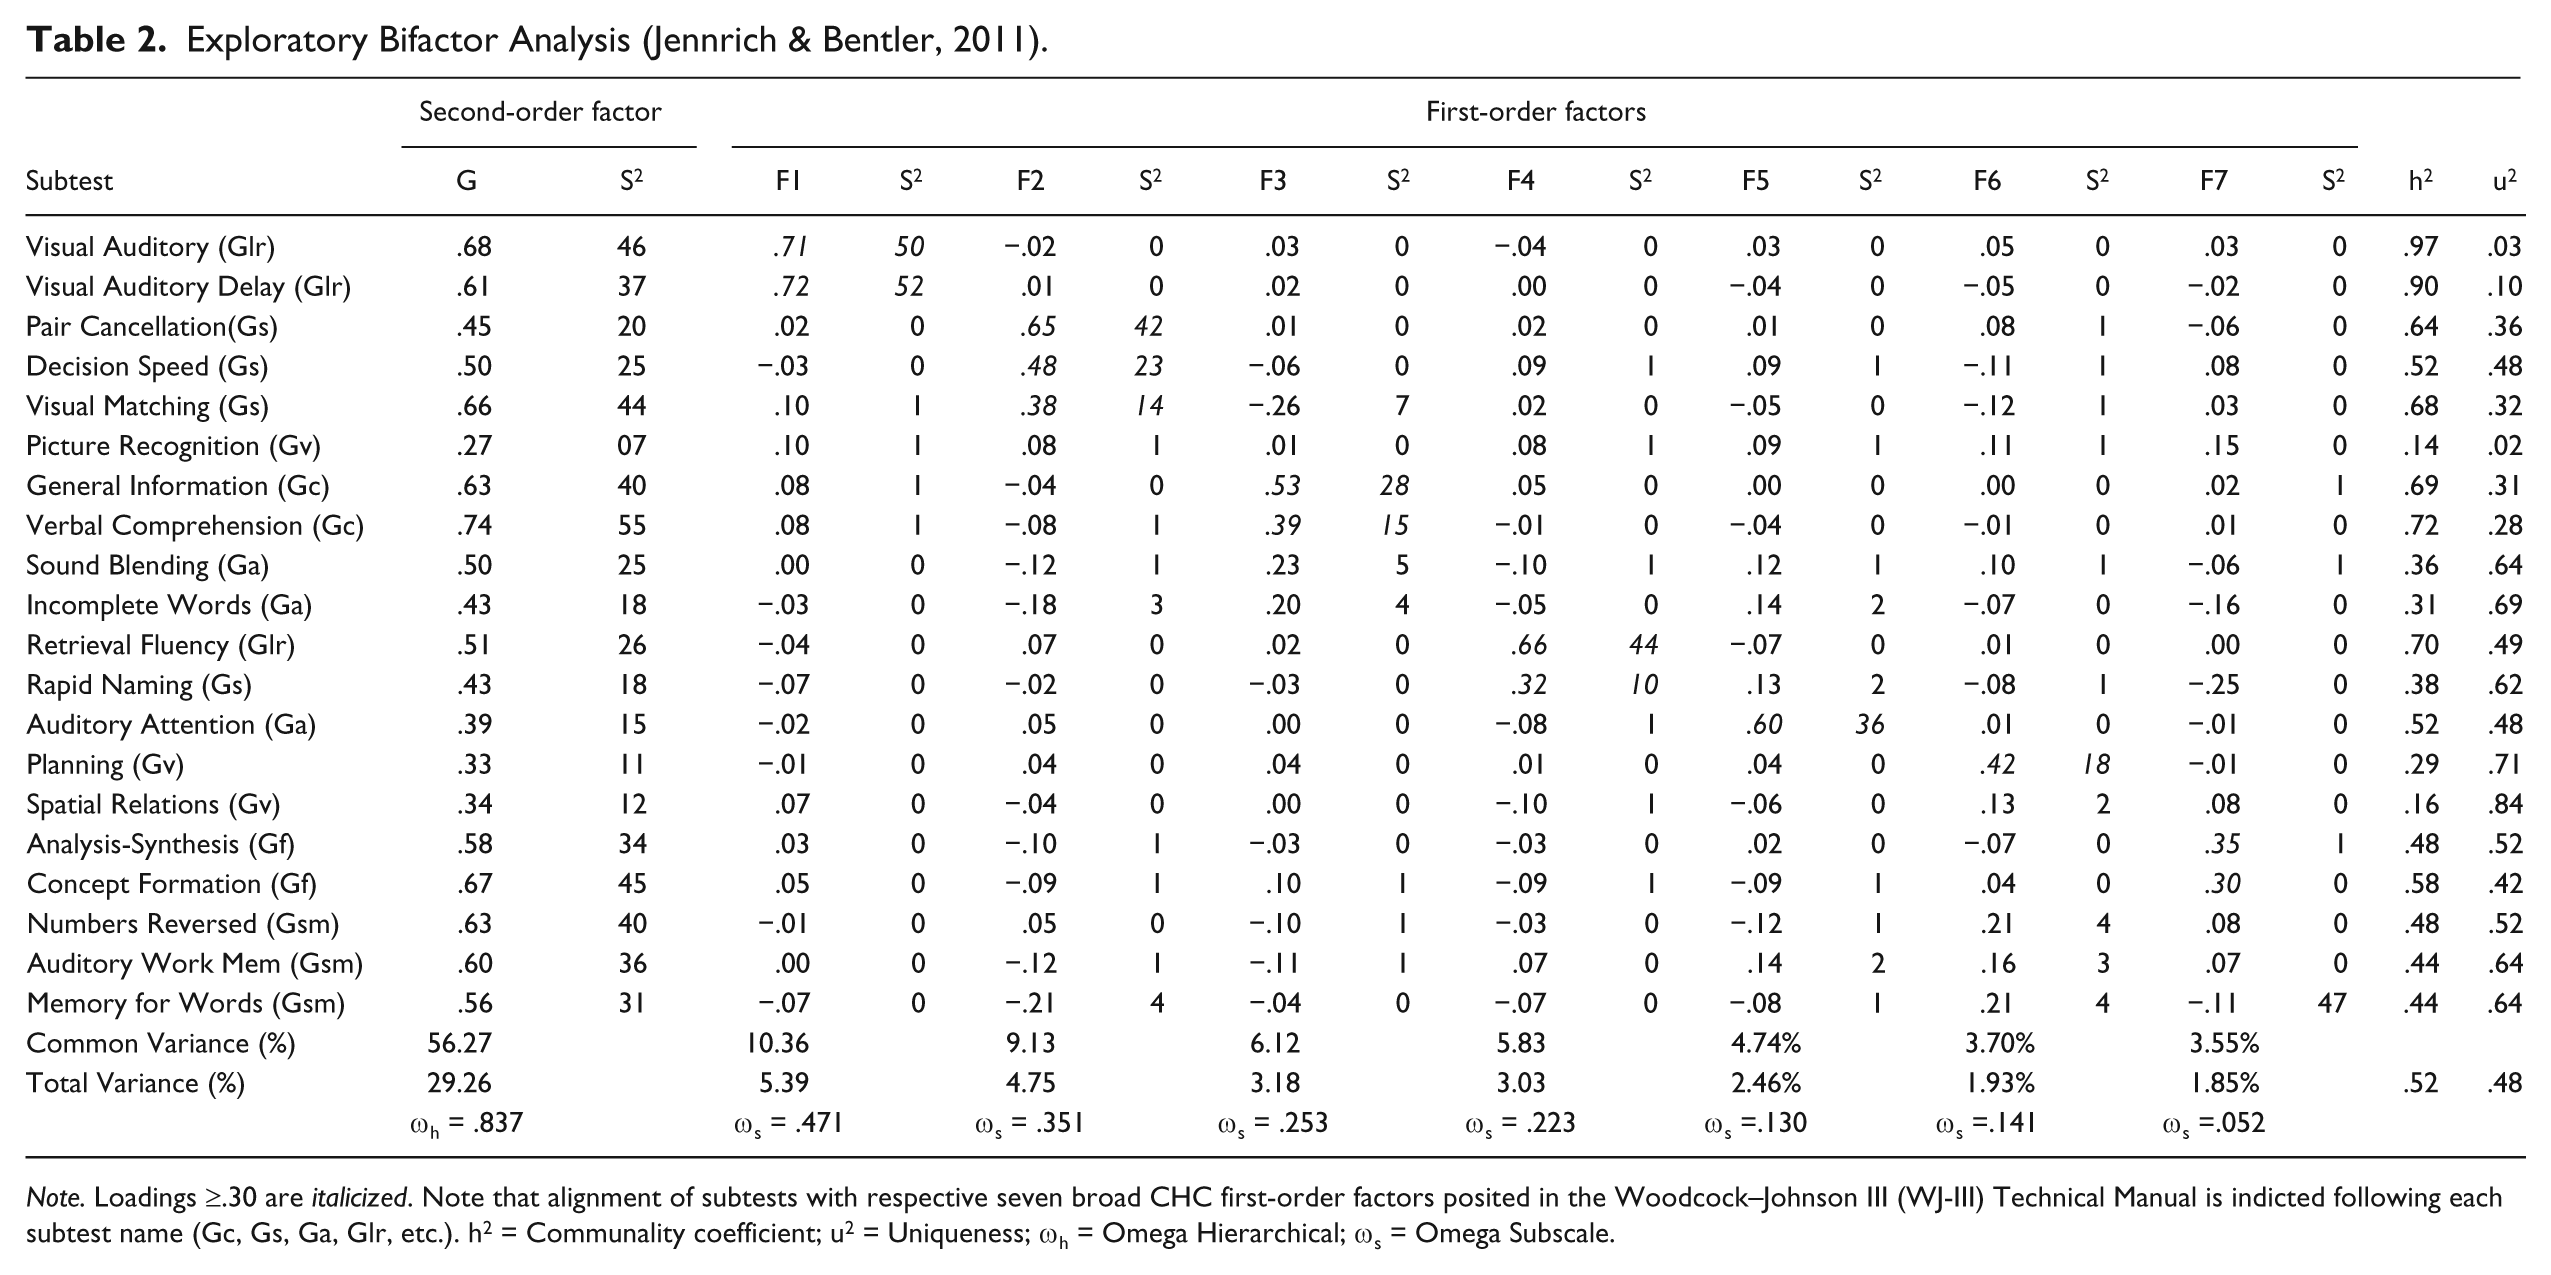
Note. Loadings ≥.30 are italicized. Note that alignment of subtests with respective seven broad CHC first-order factors posited in the Woodcock–Johnson III (WJ-III) Technical Manual is indicted following each subtest name (Gc, Gs, Ga, Glr, etc.). h2 = Communality coefficient; u2 = Uniqueness; ωh = Omega Hierarchical; ωs = Omega Subscale.
The reliability of WJ-III Cognitive was also estimated across both analyses with ωh and ωs. The ωh coefficient for the general factor (.841 for SL, .837 for EBFA) was high and sufficient for interpretation. Omega subscale (ωs) coefficients for the seven lower order factors ranged from .052 to .471 across both analyses. Low ωs coefficients suggest that interpretation of the factor indices beyond the general factor is inappropriate as little variance exists beyond the general factor (Reise, 2012).
Hierarchical factor analysis based on factor extraction rules
Tables 3 and 4 present the results of a higher order factor analysis based on the extraction of three factors. As noted, the results of both analyses suggest the prominence of the general factor and generally struggled to find subtest alignment reminiscent of that posited in the Technical Manual. With the SL analysis, the general factor accounted for 60.6% of the common variance and 24.4% of the total variance, exceeding that accounted for by the lower order factors (12.5%-15.5% common variance; 5.0%-6.2% total variance). The first- and second-order factors within the SL analysis combine to measure 40.2% of the variance in the WJ-III Cognitive, reflecting 59.8% unique variance. With EBFA, the general factor accounted for 69.7% of the common variance and 30.8% of the total variance, dwarfing that apportioned to lower order factors (5.8%-12.7% common variance; 2.6%-5.6% total variance). The first- and second-order factors in the EBFA combine to measure 44.1% of the variance in the WJ-III Cognitive, reflecting 55.9% unique variance. The results of both analyses demonstrate a robust manifestation of general intelligence in the WJ-III where the combined influence of general intelligence and uniqueness exceeded the contributions made by the first-order factors.
WJ-III Sources of Variance According to a Schmid–Leiman Orthogonalization (Three Factor).
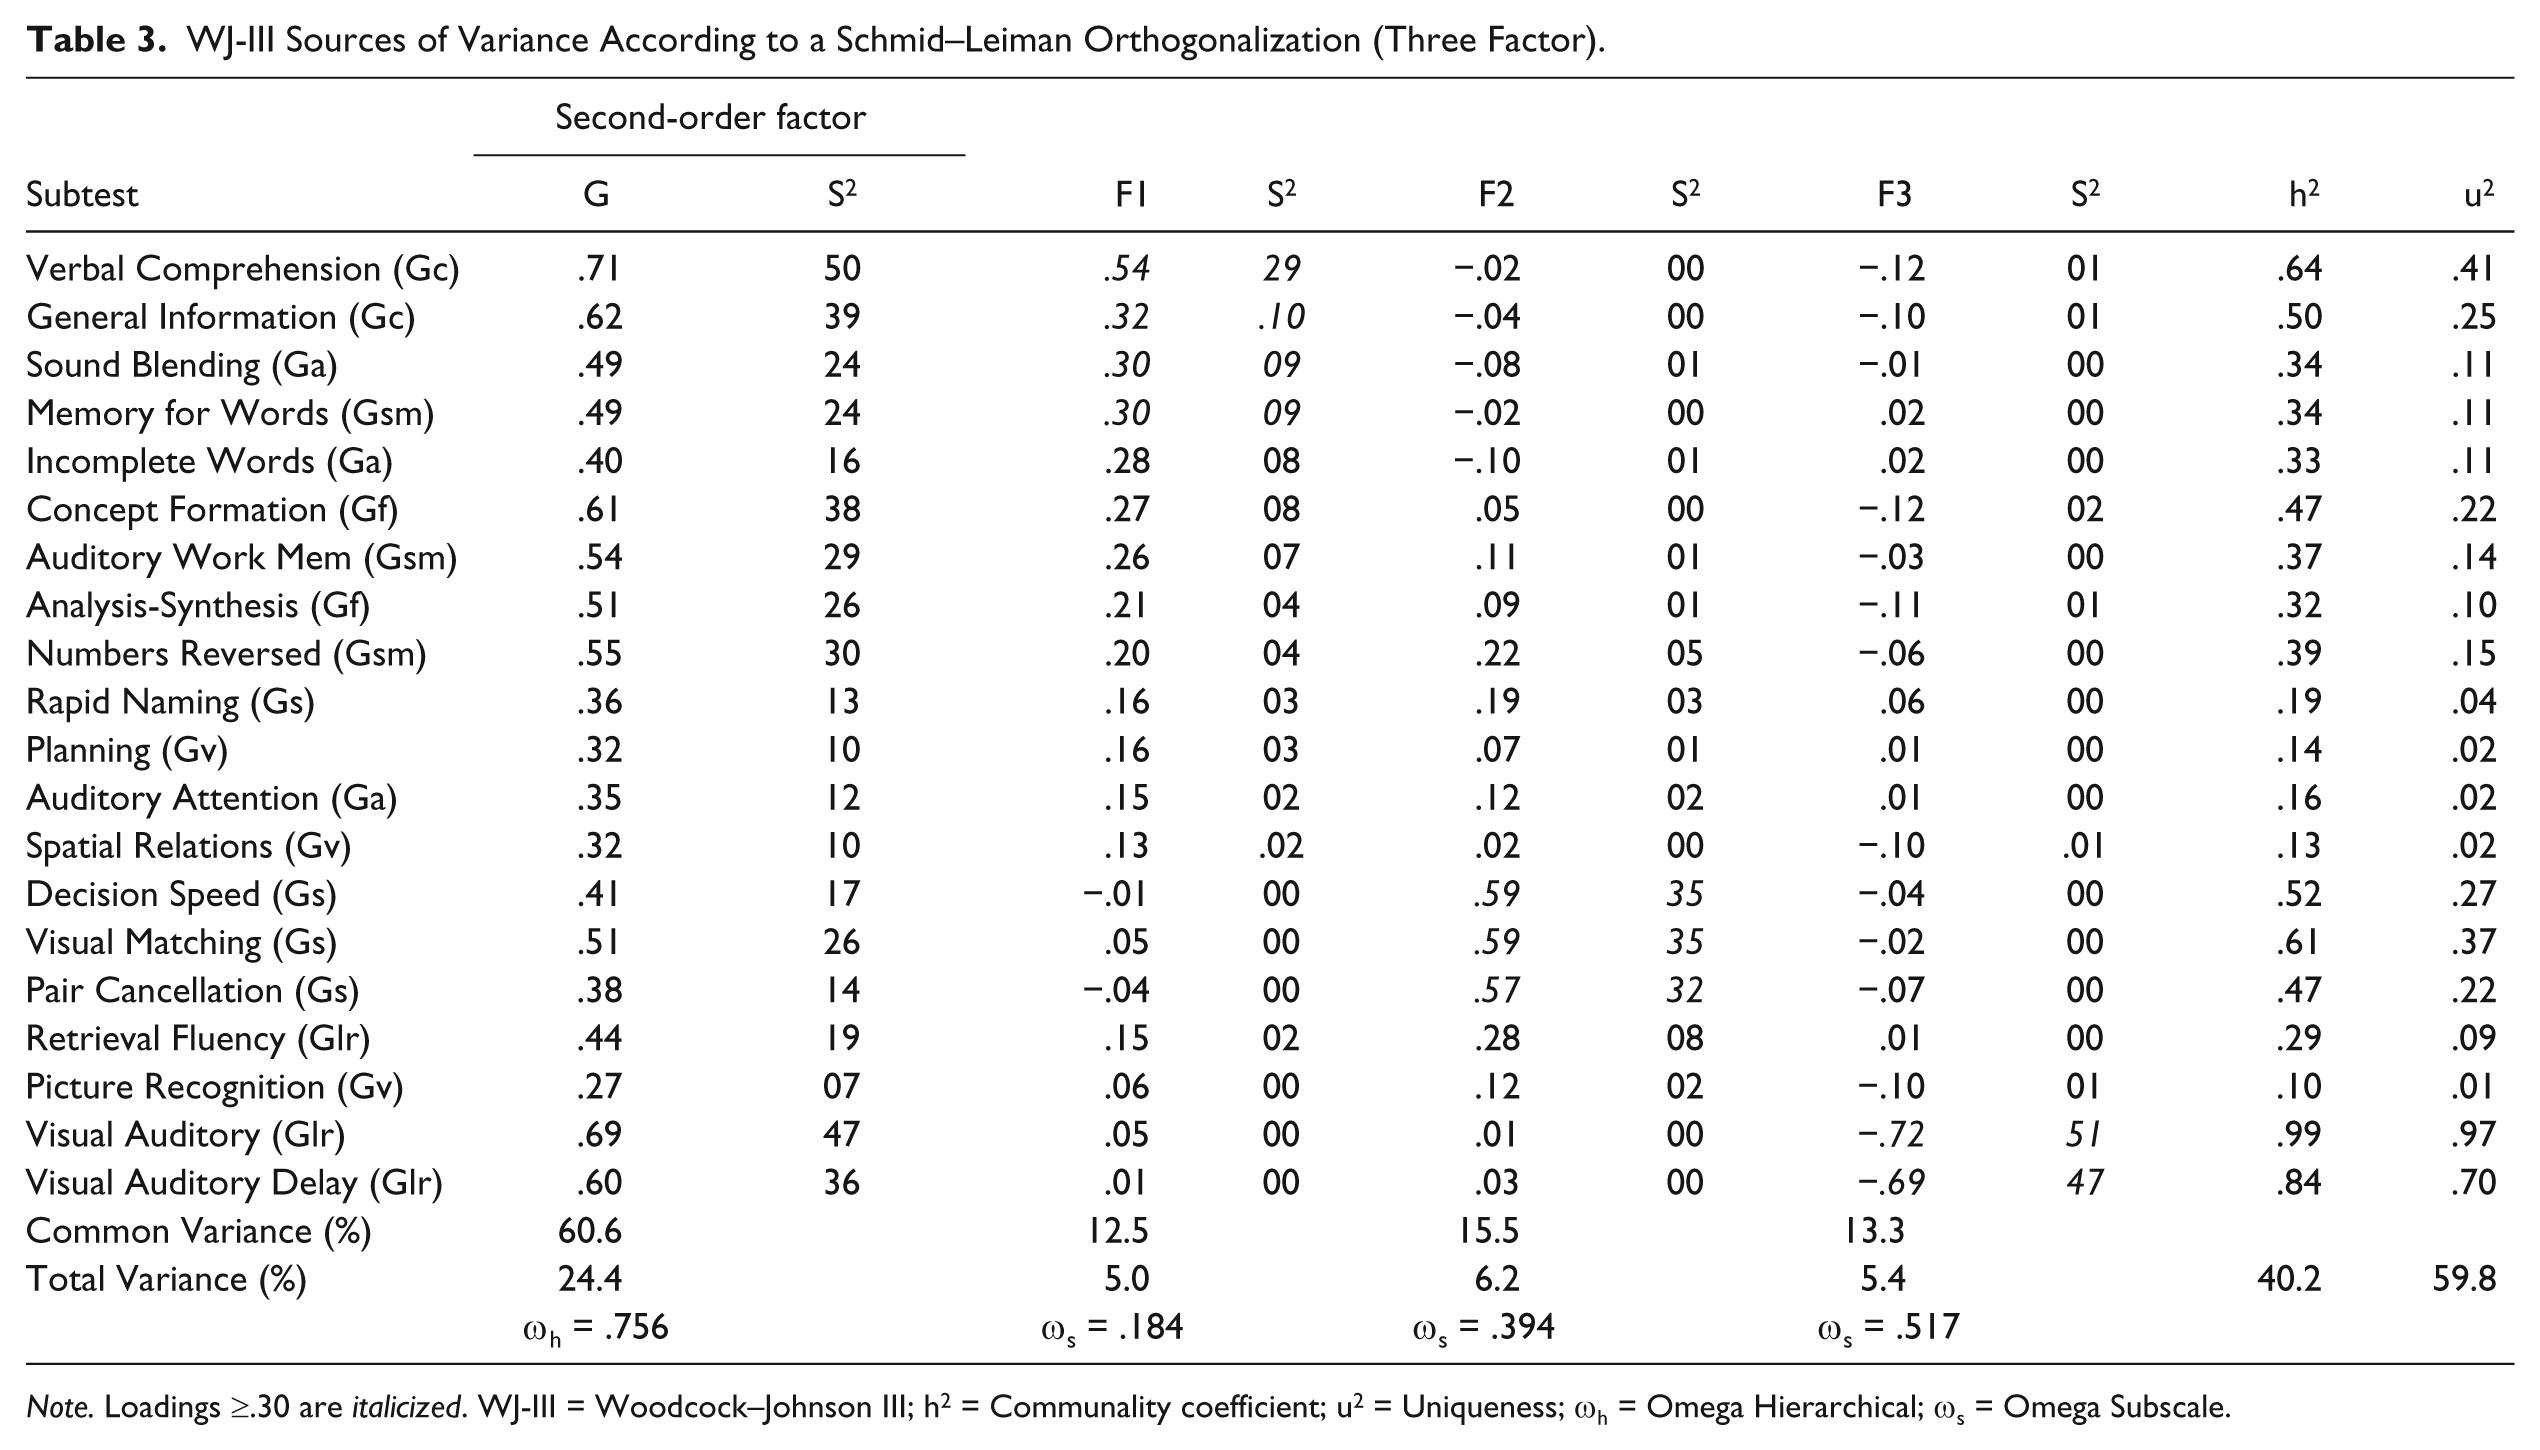
Note. Loadings ≥.30 are italicized. WJ-III = Woodcock–Johnson III; h2 = Communality coefficient; u2 = Uniqueness; ωh = Omega Hierarchical; ωs = Omega Subscale.
WJ-III Sources of Variance via Exploratory Bifactor Analysis (Three Factor).
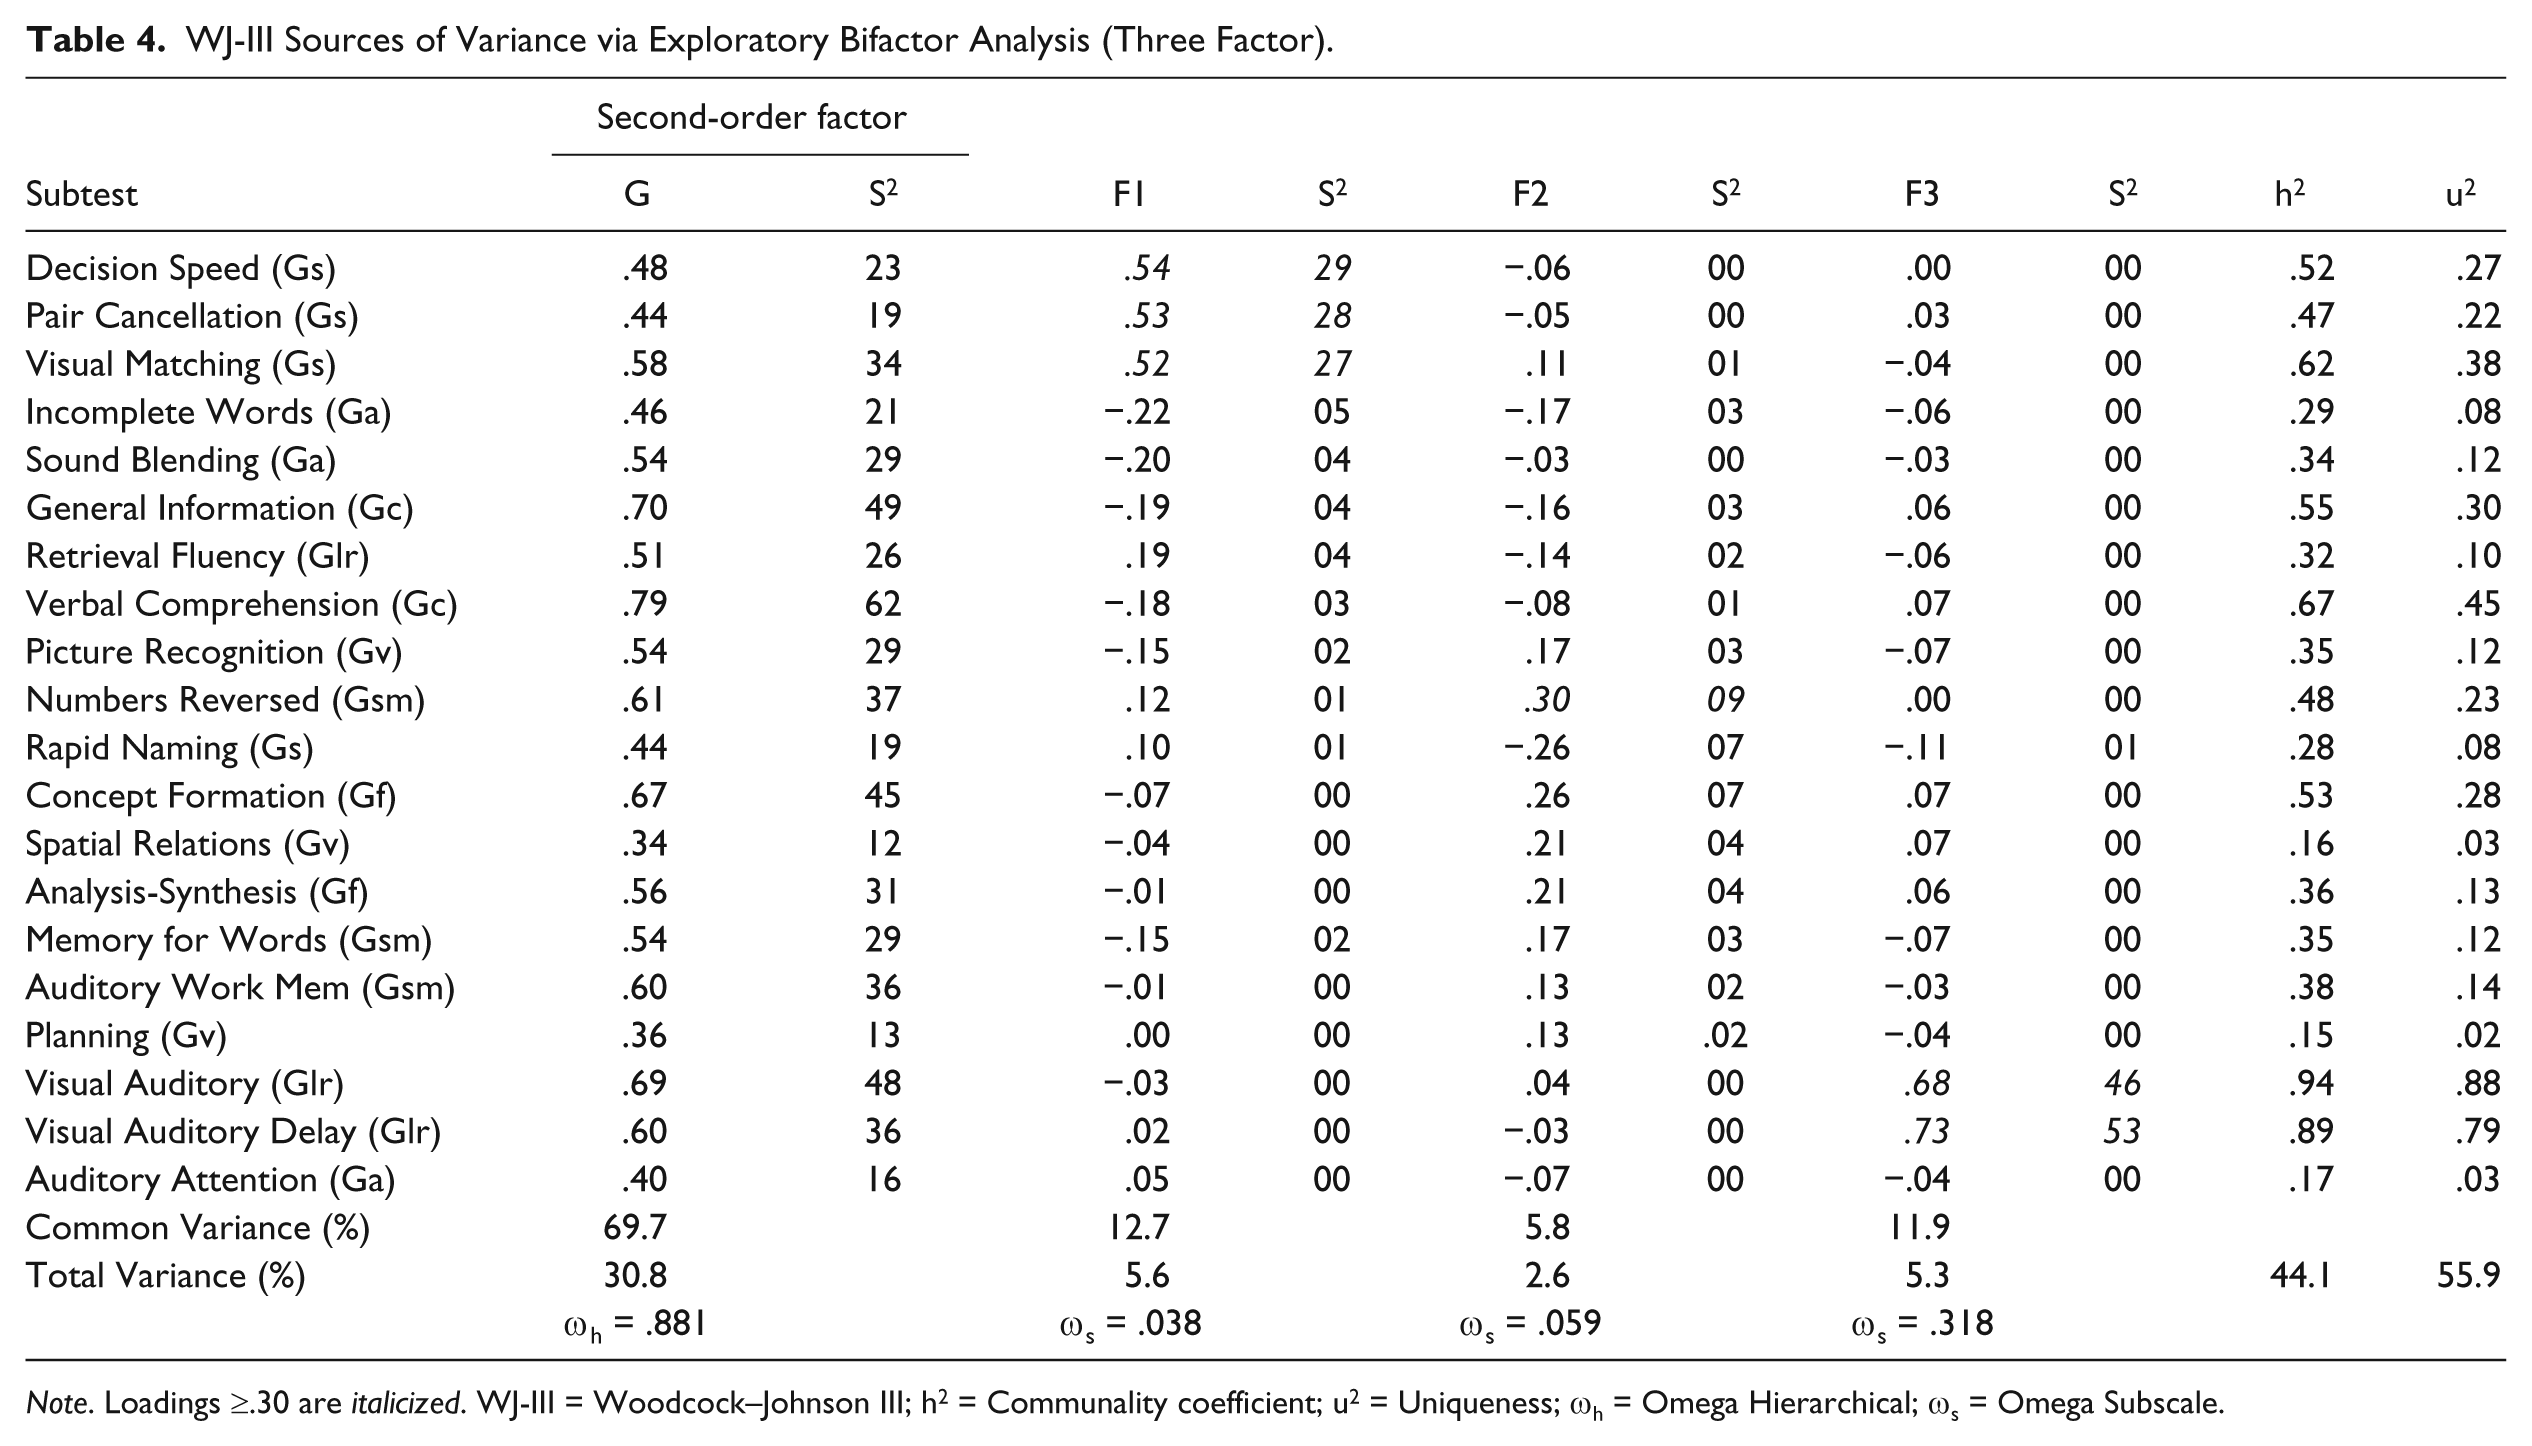
Note. Loadings ≥.30 are italicized. WJ-III = Woodcock–Johnson III; h2 = Communality coefficient; u2 = Uniqueness; ωh = Omega Hierarchical; ωs = Omega Subscale.
The reliability of WJ-III Cognitive was also estimated across both analyses with ωh and ωs. The ωh coefficient for the general factor (.756 for SL, .881 for EBFA) was high and sufficient for interpretation. ωs coefficients for the seven lower order factors ranged from .038 to .517 across both analyses. Low ωs coefficients suggest that interpretation of the factor indices beyond the general factor is inappropriate as little variance exists beyond the general factor (Reise, 2012).
Discussion
This article investigates the theoretical structure of the WJ-III Cognitive at age 6 to 8 through two EBFA procedures. The first (e.g., SL) procedure is well established with a long-standing research history; the second (e.g., EBFA; Jennrich & Bentler, 2011) is a newly developed, promising technique with scant applied research coverage. This study is one of the first to use EBFA on applied real-world data. EBFA may be a useful additional form of factor analysis for exploring constructs with highly correlated factors or traits.
When examining the forced seven-factor solution, both procedures accounted for a similar percentage of the total variance (29.26% for EBFA and 29.65% for SL) although the SL encompassed slightly higher proportion of common variance (60.92% vs. 56.27%). When comparing specific subtest’s g loadings, the SL produced higher g loadings in 12 of the 20 subtests whereas EBFA was higher in 7 cases. EBFA produced slightly higher, first (i.e., lower) order factor subtest loadings in nine subtests although the SL had seven subtests that produced higher loadings. EBFA produced a communality of .52 reflecting .48 unique variance. The SL produced a communality of .49 reflecting .51 unique variance.
Reviewing specific subtest g loadings, 12 of the subtests in the SL analysis accounted for a greater proportion of the common variance compared with EBFA. However, the pattern of salient and nonsalient loadings was nearly identical with both procedures. This is consistent with Reise et al.’s prediction regarding impact of proportionality and could suggest a negligible influence of proportionality on results when using applied data. Additional research on the impact of proportionality is necessary. Further research on EBFA using real-world data along with Monte Carlo simulation will also be worthwhile.
The results of this study raise concerns about the theoretical structure of the WJ-III Cognitive across the early school aged time range (6-8). Both the SL and EBFA suggest the preeminence of the higher order factor and indicate that the instrument may have a different factor structure from that posited in the Technical Manual. Use of factor extraction procedures (e.g., parallel analysis and MAP as supplemented by an HPA scree test) that are considered to be psychometrically robust suggests that three factors should be extracted from the WJ-III Cognitive at 6 to 8 years of age. However, extracting this number of factors generally renders the instrument less available for interpretation because the subtest alignment lacks full linkage to theory and the structure posited in the WJ-III Technical Manual. The SL three-factor results (Table 3) suggest the location of a verbal factor (Verbal Comprehension [Gc], General Information [Gc], and Sound Blending [Ga]), a processing speed factor (Decision Speed [Gs], Visual Matching [Gs], and Pair Cancellation [Gs]), and a long-term retrieval factor (Visual Auditory Learning [Glr] and Visual Auditory Learning Delayed [Glr]). The EBFA three-factor results (Table 4) indicate the possibility of a processing speed factor (Decision Speed [Gs], Visual Matching [Gs], and Pair Cancellation [Gs]) and a long-term retrieval factor (Visual Auditory Learning [Glr] and Visual Auditory Learning Delayed [Glr]). A third factor contained only Numbers Reversed (Gsm). Thus, structural analyses using psychometrically sound EFA procedures do not support the seven-factor model presented in the Technical Manual. They do support the WJ-III Cognitive as a solid measure of general intelligence across the six to eight time periods.
When casting aside the above mentioned factor extraction decision rules and extracting seven factors in accord with the structure posited in the Technical Manual, there were areas of convergence with and divergence from the Technical Manual. Both the SL and EBFA analyses (Tables 1 and 2) found that the Gc and Gf subtests alignment was consistent with the Technical Manual’s structure. Both analyses also found that Visual Auditory Learning and Visual Auditory Learning Delayed paired together to form a distinct Glr factor whereas Retrieval Fluency (Glr) paired with Rapid Naming (Gs) to form a second processing speed factor. Auditory attention (Ga) and Planning (Gv) singularly loaded additional, separate factors (sixth and seventh). Thus, forcing the seven-factor fit does not hold across both analyses with the exception of Gc and Gf.
The forced seven-factor solution in both analyses supports the WJ-III cognitive as a solid measure of general intelligence across the six to eight time period. Moving beyond this level of interpretation is questionable. This is consistent with the conclusion of several recent studies that investigated the WJ-III (e.g., Dombrowski, 2013a, 2013b; Dombrowski & Watkins, 2013). Providing further support for sole interpretation of the higher order factor, the reliability of the g factor for both analyses had strong estimates (ωh = .75-.88). Estimates for primary factors were low (ωs = .038-.517) and insufficiently high for measuring unique constructs (Reise et al., 2012) and for individual interpretation.
Conclusion and Implications for Practitioners
The results of this study suggest that the WJ-III Cognitive at the 6 to 8 year time period is a solid measure of general intelligence. Consistent with the body of exploratory structural validity evidence (e.g., Canivez, 2013; Canivez & Watkins, 2010; DiStefano & Dombrowski, 2006; Dombrowski, 2013a, 2013b; Dombrowski & Watkins, 2013; Dombrowski, Watkins, & Brogan, 2009; Glutting, Watkins, Konold, & McDermott, 2006; Nelson & Canivez, 2012; Oh, Glutting, Watkins, Youngstrom, & McDermott, 2004; Parkin & Beaujean, 2012; Watkins, 2010; Watkins, Glutting, & Lei, 2007), this study suggests caution about overlooking interpretation of the higher order factor (g) in favor of interpretation of lower order factors. More specifically, this study’s results are also consistent with EFA structural validity studies on instruments linked to CHC theory that have generally failed to produce evidence that supports interpretation of lower order factors (e.g., Canivez, 2008; DiStefano & Dombrowski, 2006; Dombrowski, 2013a, 2013b; Dombrowski & Watkins, 2013).
Given the divergence in structural results between EFA and CFA analyses, the small amount of variance accounted for by lower order factors, and low Omega subscale estimates, the most empirically grounded practical implication would be to interpret the WJ-III Cognitive where there is the greatest convergent evidence (i.e., at the level of g). A less empirically defensible position would be to view lower order factors as screeners of a particular ability. However, the need for additional convergent evidence regarding subtest alignment between independent studies and the Technical Manual should not be overlooked when moving to this level of interpretation. When a more psychometrically grounded understanding of a particular cognitive ability is necessary, then the clinician or researcher could follow-up with a well-validated full scale assessment of that particular ability (e.g., a full scale test of auditory processing or memory). Interpretation of lower order factors in a test such as the WJ-III Cognitive should be approached tentatively as this practice may lead to inaccurate decision making through interpretation of factors that lack adequate psychometric support. The evidence is accumulating to suggest that caution should be headed when interpreting the seven lower order CHC factors on the WJ-III Cognitive. The present study adds to this body of research by extending this admonition downward to the 6 to 8 age range.
Footnotes
Declaration of Conflicting Interests
The author(s) declared no potential conflicts of interest with respect to the research, authorship, and/or publication of this article.
Funding
The author(s) received no financial support for the research, authorship, and/or publication of this article.