




Abstract
The increasing diversity of the U.S. population has resulted in increased concerns about the psychological assessment of students from culturally and linguistically diverse backgrounds. To date, little empirical research supports recommendations in test selection and interpretation, such as those presented in the Culture–Language Interpretative Matrix (C-LIM). The current investigation was conducted to empirically evaluate the validity of the C-LIM classifications for the Woodcock–Johnson Tests of Cognitive Abilities, Third Edition (WJ III COG). The WJ III Normative Update standardization sample was used to determine the extent to which the two dimensions of the C-LIM (i.e., cultural loading and linguistic demand) influence performance on 20 of the WJ III tests. Results provide support for a re-classification of the C-LIM. Implications for research and school psychology practices are discussed.
Assessment remains a dominant practice for school psychologists (Bramlett, Murphy, Johnson, Wallingsford, & Hall, 2002), and they are gaining a better understanding of relevant variables when selecting and interpreting appropriate measures of cognitive abilities for an increasingly diverse student population (Salvia, Ysseldyke, & Bolt, 2013). Furthermore, the provision of culturally competent services is a foundational competency of school psychologists (Ysseldyke et al., 2006). One proposed method to assist practitioners when testing students who are culturally and linguistically diverse 1 (CLD) is the Culture–Language Interpretive Matrix (C-LIM; Flanagan & Ortiz, 2001).
The Culture–Language Interpretive Matrix
The C-LIM provides guidelines for CLD assessment. This model was originally conceptualized to answer the question of difference versus disorder when interpreting cognitive assessment results (Flanagan, Ortiz, & Alfonso, 2007). The difference versus disorder distinction attempts to discern whether atypical cognitive assessment results are due to either (a) student differences in cultural and linguistic backgrounds or (b) a valid reflection of an underlying cognitive disorder. The C-LIM attempts to distinguish between difference and disorder by categorizing individual tests from commonly used cognitive batteries on two dimensions: linguistic demand and cultural loading.
Linguistic Demand
Problems with the linguistic demand of cognitive measures occur when tests from a cognitive battery “degenerate in unknown degrees into tests of English-language proficiency” (Figueroa, 1990, p. 93). There is an obvious link between the ability of an individual to understand and communicate in English and his or her ability to perform on a test administered in English. For example, bilingual students performed significantly lower than their monolingual peers on the verbally loaded Wechsler Intelligence Scale for Children, Third Edition (WISC-III) tests (Nieves-Brull, 2006). Recent research and professional opinion suggest that the evaluation of the linguistic demand of tests is a complex, multivariate process. Cormier, McGrew, and Evans (2011) reported that the linguistic demand of test instructions requires the evaluation of at least two different, empirically quantifiable, components of the test’s verbal directions: (a) the complexity and (b) length/verbosity of the directions. In addition, Ortiz and Dynda (2005) suggest that linguistic demand interacts with such variables as (a) the age at which the individual learned English, (b) the linguistic background of the individual relative to those against which he or she is compared, and (c) the amount and quality of the exposure to English.
Cultural Loading
Experts have highlighted two cultural loading dimensions related to certain tests or test items: (a) the student’s level of acculturation compared with his or her peer group and (b) the extent to which cultural knowledge influences performance on certain tests or items (Rhodes, Ochoa, & Ortiz, 2005). There is no uniform consensus on the concept of cultural loading on tests and test score bias. For example, Brown, Reynolds, and Whitaker (1999) suggested that cultural loading of individual test items may be a fallacy. Nonetheless, the developers of the C-LIM framework (Flanagan et al., 2007) offered numeric ranges relative to the degree of attenuation in cognitive test scores to be expected from three groups of CLD individuals.
C-LIM Dimensions and Score Attenuation
In the C-LIM framework, a distinction is made between individuals who are slightly different, moderately different, and markedly different from the general population (i.e., the mainstream), as represented in the normative sample of a particular test (see Flanagan et al., 2007). This distinction between difference and disorder is determined by estimating the individual’s level of English proficiency and the amount of time they have resided in the United States. Flanagan et al. (2007) hypothesized that students’ scores become more attenuated (i.e., lower) as a function of the extent to which they are markedly different on one or both of the C-LIM dimensions (i.e., cultural loading and linguistic demand). The degree of attenuation hypothesized by Flanagan et al. ranges from 3 to 5 standard score points for an individual test identified as low on both dimensions to an attenuation of 25 to 35 standard score points for an individual test identified as high on both cultural loading and linguistic demand. However, these numeric values associated with varying levels of attenuation have yet to be demonstrated empirically. It has been postulated that the effects of attenuation lead to a pattern of predicted performance when examining the overall trend in an individual’s pattern of test scores, with a CLD student demonstrating a higher level of performance (i.e., higher standard score) on tests with low cultural loading and linguistic demand and a relatively lower level of performance on individual tests with high cultural loading and linguistic demand from a given test battery.
Preliminary Studies Addressing the C-LIM
Currently, only two empirical investigations of the C-LIM framework have been published in a peer-reviewed journal (Kranzler, Flores, & Coady, 2010; Styck & Watkins, 2013). In addition, there are a small number of unpublished dissertations that are cited as providing preliminary evidence for the C-LIM framework (see Kranzler et al., 2010, for a review). For example, two unpublished dissertations (Tychanska, 2009; Verderosa, 2007) attempted to validate the C-LIM classifications by examining cognitive ability score patterns to determine whether the predicted downward trend in scores from the C-LIM could be observed for CLD students, when compared with other students with or without disabilities. In both studies, the observed differences in test performance between groups appeared in line with the aforementioned pattern of predicted performance. However, both Verderosa and Tychanska did not appear to adjust p values to determine statistical significance, despite the large number of tests that were completed in both studies.
Although these two unpublished dissertations provide some preliminary evidence for the C-LIM pattern of predicted test scores, a similar study by Kranzler et al. (2010) observed the expected downward trend in only 13% of their sample of CLD students who were administered the Woodcock–Johnson Tests of Cognitive Abilities. In addition, Kranzler et al. reported that most of the differences in the test scores were not significant. These researchers concluded that more solid evidence is needed to support the C-LIM matrix classification system. In addition, Styck and Watkins (2013) examined the ability of the C-LIM Wechsler Intelligence Scale for Children, Fourth Edition (WISC-IV) subtest profiles to distinguish monolingual students included in the WISC-IV’s normative sample from a referred sample of English Language Learners (ELL). The hypothesized result was that 100% of the ELL group would demonstrate a score profile (i.e., pattern of predicted performance) that was consistent with C-LIM classifications and that the predicted C-LIM score profile would not be observed in the normative sample. This hypothesis was rejected: “The invalid C- LIM profile was exhibited by only 10.5% of the ELL children. In contrast, scores for 4.9% of the children in the WISC-IV normative group were identified as invalid by the C-LIM” (Styck & Watkins, 2013).
Collectively, the body of evidence for the C-LIM framework is sparse and contradictory. The C-LIM framework is largely based on expert judgment. In addition, although the influence of culture on test scores has been heavily researched (e.g., Jensen, 1980; Reynolds, 2000), researchers have yet to model the simultaneous effects of culture and language. This is a critical unmet need considering “language and culture are inextricably linked” (Ortiz & Dynda, 2005, p. 549). Finally, there has yet to be a study of the C-LIM classification of the Woodcock–Johnson Tests of Cognitive Abilities, Third Edition (WJ III COG) battery that incorporates variables that operationalize cultural loading and linguistic demand. Thus, this study aimed to answer the following research questions:
Method
Sample
The Woodcock–Muñoz Foundation provided the data from the Woodcock-Johnson III Battery (WJ III) normative update norming sample for use in this study. The norming sample included 8,782 participants who were recruited from more than 100 geographically diverse U.S. communities. The original stratified random sample consisted of 1,153 preschool children (ages 2-5 and not enrolled in kindergarten), 4,740 students enrolled in K-12, and 2,889 adults (1,727 who were not enrolled in college or university and 1,162 undergraduate and graduate students). All participants were administered the WJ III COG, and the Woodcock–Johnson Tests of Achievement, Third Edition (WJ ACH III) for the purposes of co-norming the two test batteries. The current study used a subset of the complete WJ III norming sample, which included students from ages 7 to 18 (see Table 1). For each age group sample, the sample was randomly split into two subsamples—the model testing and cross-validation samples.
Sample Sizes by Race Category and Age Group.
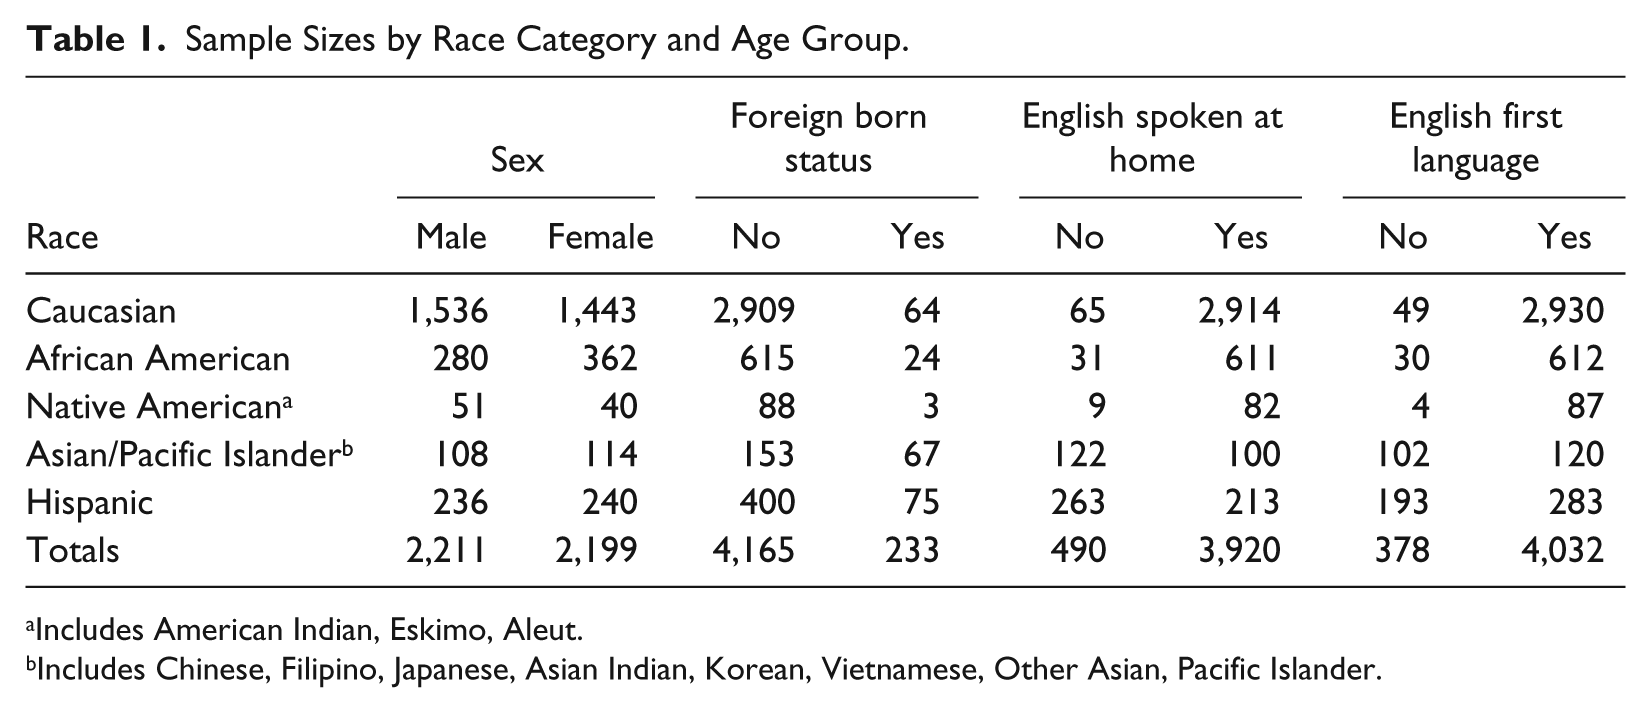
Includes American Indian, Eskimo, Aleut.
Includes Chinese, Filipino, Japanese, Asian Indian, Korean, Vietnamese, Other Asian, Pacific Islander.
The use of the WJ III normative sample provides a particularly useful frame of reference from which to evaluate the C-LIM model. In all prior studies, pre-selected samples of individuals varying on linguistic abilities and degree of cultural exposure were selected, which likely produced a restriction of range on both dimensions. By using a nationally representative norming sample, the potential confound of sample pre-selection effects on the dependent variables of interest is avoided. Furthermore, the use of a nationally representative sample allows for the examination of the C-LIM framework in a sample that is likely to reveal the relations between the two C-LIM dimensions in the population.
Measures
WJ III ACH
The WJ III ACH is a norm-referenced individually administered battery of tests aimed at measuring overall academic abilities and oral language (McGrew, Schrank, & Woodcock, 2007). The test–retest reliability of cluster scores for academic content areas across all ages within the norming sample ranges from .93 to .97, which is within the recommended range for making significant educational decisions. The individual tests used as independent (predictor) variables in this study (see variables section below) demonstrate test–retest reliability ranging from .83 to .87. Validity evidence for this measure is extensive, and the technical manual provides information on construct and content coverage for each of the individual tests (McGrew et al., 2007).
WJ III COG
The WJ III COG is a norm-referenced assessment tool used to measure overall cognitive abilities, as well as the seven major broad abilities included in the contemporary Cattell–Horn–Carroll (CHC) model of intelligence (Schrank & Wendling, 2012). The WJ III COG assesses the seven CHC domains of verbal comprehension and knowledge (Gc), fluid reasoning (Gf), short-term and working memory (Gsm), long-term storage and retrieval (Glr), visual–spatial processing (Gv), auditory processing (Ga), and broad cognitive processing speed (Gs). The reliability coefficients of the clusters from the standard battery of the WJ III COG range from .90 to .97. The reliability coefficients of individual tests range from .81 to .97. As was the case with the WJ III ACH, the validity evidence for tests included in the WJ III COG standard and extended battery is comprehensive and described in detail in the technical manual (McGrew et al., 2007).
Variables
Exogenous variables
For the purposes of this study, Linguistic Demand is defined as the individual’s level of ability in receptive and expressive language in the language of administration of the test. The latent variable, Linguistic Demand, included four oral language measures from the WJ III ACH: (a) Understanding Directions, (b) Oral Comprehension, (c) Story Recall, and (d) Picture Vocabulary. For the purposes of this study, Cultural Loading is defined as quantifiable characteristics that contribute to an individual’s association with a particular cultural group. The variables selected to represent the construct of Cultural Loading are as follows: (a) Foreign Born Status, (b) Race, (c) Language at Home, and (d) First Language (spoken at home).
Endogenous variables
This study used the age-based standard scores from the 20 WJ III COG tests as endogenous variables in each model. Models were evaluated for each of the following individual tests: Spatial Relations, Picture Recognition, Planning, Pair Cancelation, Visual Matching, Numbers Reversed, Visual–Auditory Learning, Delayed Recall: Visual–Auditory Learning, Retrieval Fluency, Rapid Picture Naming, Concept Formation, Analysis Synthesis, Working Memory, Memory for Words, Incomplete Words, Sound Blending, Auditory Attention, Decision Speed, Verbal Comprehension, and General Information.
Procedure
Figure 1 shows the general model tested in this study. The model is a representation of the theoretical influence of cultural loading and linguistic demand on WJ III COG test scores as per the C-LIM (Rhodes et al., 2005). The C-LIM model suggests a simultaneous contribution of both cultural loading and linguistic demand to each total test score—they both have varying degrees of influence depending on the test. To appropriately represent this interaction, we allowed the latent variables, Cultural Loading and Linguistic Demand, to co-vary. A model was created for each WJ III COG test and applied to each of the differential age groups to evaluate potential developmentally mediated findings. On evaluation of the initially specified model in the model development sample, various model fit and modification indices were reviewed for possible post hoc model refinements. No model changes were needed, and the cross-validation was conducted using the same models. The cross-validation models were retained in their original form—no further model readjustments were made during cross-validation.
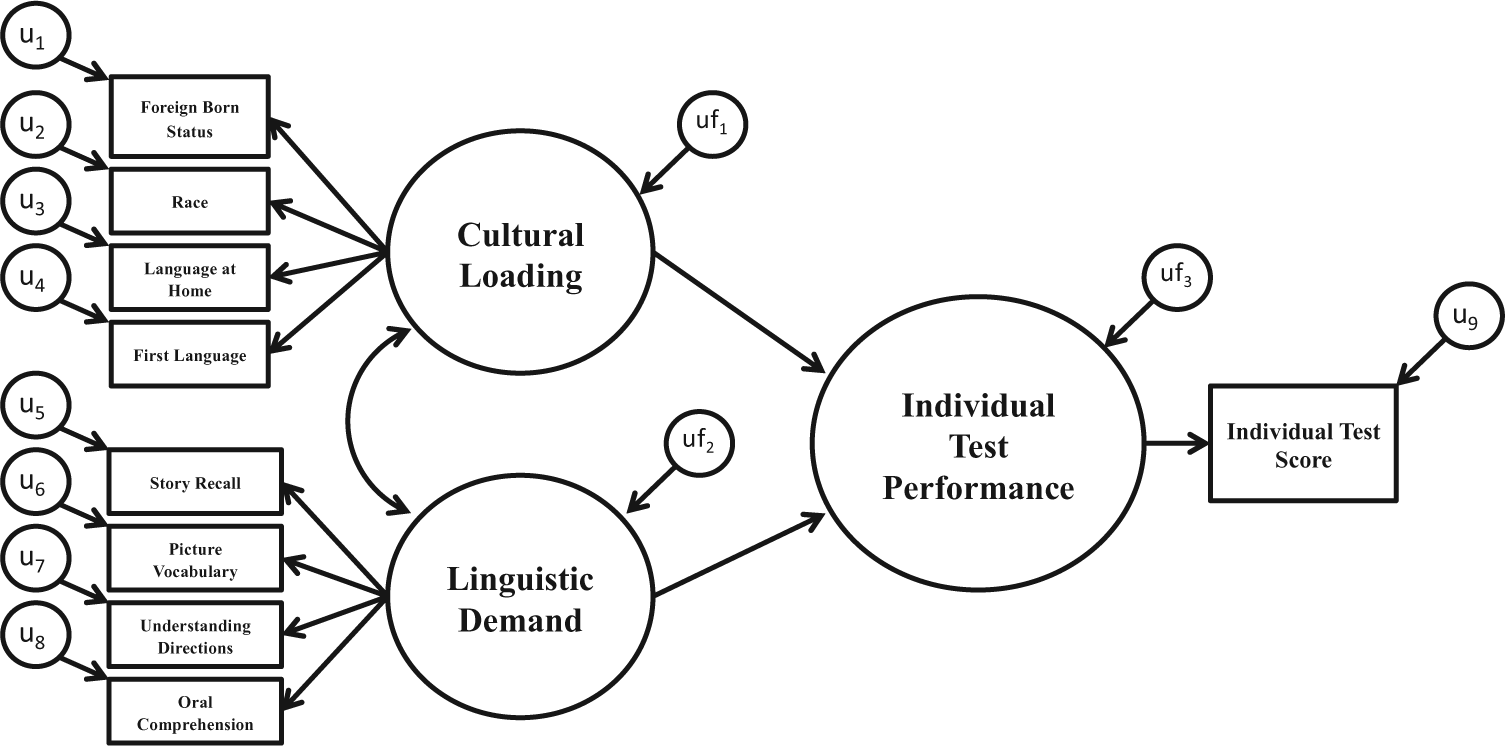
Hypothesized general model representing the relationships between cultural loading, linguistic demand, and performance on individual tests from the WJ III cognitive battery.
All latent variable structural equation models were evaluated using Version 20 of the Amos program to determine the overall fit and the strength and statistical significance of all respective path coefficients (Arbuckle, 2011). The use of latent variable structural equation modeling allowed for a simultaneous test of the influence of cultural loading and linguistic demand on WJ III individual tests scores.
Due to the sampling method used in the norming of the WJ III, not all variables were available for all participants. Therefore, variable sample sizes varied across the different individual tests. Thus, it was necessary to estimate means and intercepts for the model due to missing cases. The estimation of means and intercept Amos option results in the imputation of any missing values via the expectation maximum (EM) likelihood method prior to the calculation and analysis of the respective covariance matrices (IBM SPSS Amos 20 User’s Guide, Arbuckle, 2011). The Maximum Likelihood Estimation (MLE) option was used to generate the parameters and model fit statistics for all models.
Evaluating model fit
The conventional approach has been to use a cutoff value of .90 for the comparative fit index (CFI) and the normed fit index (NFI) and a cutoff value of .10 for root mean square error of approximation (RMSEA; Hu & Bentler, 1998). However, Hu and Bentler (1999) provided evidence for the more demanding cutoff values of .95 for the CFI and the NFI, and a cutoff value of .06 for the RMSEA. Despite different cutoff values being used in different published research (Byrne, 2001; Hemphill & Howell, 2000; King et al., 2000), Marsh, Hau, and Wen (2004) argue that “there is some evidence to suggest that even the old cutoff values (e.g., RNI and TLI > .90) are overly demanding in relation to a normative criterion of appropriateness based on the best existing psychological instruments” (p. 326). Moreover, empirical evidence suggests that false, misspecified models tend to be rejected at a higher frequency as sample size increases (Hu & Bentler, 1999; Marsh et al., 2004). Thus, given the use of psychological measurements and the large sample size used in the current analyses, goodness-of-fit cutoff values were set at .90 for NFI and CFI and at .10 for RMSEA.
Coding
A number of the demographic variables were re-coded prior to the analysis. Race was re-coded as dichotomous (White/not White), with the non-White group including the ethnicities Black, Asian, Hispanic, Native American, and Pacific Islander. Language Spoken at Home and English First Language were re-coded dichotomously as English/not English. The benefit of the re-coding key variables is that it allows for improved interpretation of negative loadings in the model. All other variables in the measurement model used age-based standard scores from individual tests.
Age groups
The way in which children and adolescents interact with the items presented during assessment procedures changes as they age as a result of age-related developmental and learning processes. Thus, data were categorized into age groups according to Piaget’s Theory of Cognitive Development (see Oakley, 2004, for a detailed description) within the school-age sample. According to this theory, the third stage, the Concrete Operational stage, occurs from ages 7 to 11 and is characterized by thinking that is more logical, objective, and deductive than in the previous stage, but is not yet abstract. The Formal Operational stage is characterized by abstract thinking and is typically observed in individuals 11 or 12 years and up. Arlin (1975) proposed a fifth stage during the young adult years, which divides the Formal Operational stage into two distinct stages—the problem-solving stage (the Formal Operational stage) and the problem-finding stage. The benefit of using Piaget’s theory is that the cognitive structures he describes are “content independent and also domain general” (Wellman & Gelman, 1992, p. 339). As a result, the theory can be applied to a multitude of areas influenced by cognitive development, such as the assessment of cognitive abilities.
Piaget’s Theory of Cognitive Development also coincides well with academic milestones and shifts in curricular expectations: The concrete operational stage aligns with typically developing students in the early elementary years (ages 7-10, Grades 1-4), the formal operational stage aligns with student cognitive development in the late elementary and middle school years (ages 11-14, Grades 5-8), and further cognitive development, as suggested by Arlin (1975), is associated with cognitive functioning of students in high school (ages 15-18, Grades 9-12). WJ III data from three age-differentiated groups were analyzed: (a) ages 7 to 10, (b) ages 11 to 14, and (c) ages 15 to 18.
Cross-validation
The individual data sets for the three age groups (i.e., 7-10, 11-14, and 15-18) were randomly split into test and cross-validation samples. Then, the final model represented in Figure 1 was fit for each of the 20 WJ III COG individual tests within each of the samples. As a result, the total number of models evaluated was 120 (i.e., 20 tests by three age groups in the model development stage; 20 tests by three age groups in the model cross-validation stage). Due to the relatively large number of models and paths tested for statistical significance, a conservative alpha of p < .0005 was selected to reduce the likelihood of Type II errors.
Results
Overall, the results from this investigation provide empirical information regarding the amount of cultural and linguistic variance associated with the individual tests from the WJ III battery. Due to the high level of consistency between initial model tests and the cross-validation sample, only the results from the cross-validation are shown and discussed in this section. 2
Model Fit
Overall model fit was evaluated to determine how consistent the observed data were with the proposed model. A rough estimate of how well the data fit the model was obtained by dividing the chi-square value by the degrees of freedom for each model. A good model fit is established if the results of the rough estimate are between 2 and 5 (Hooper, Coughlan, & Mullen, 2008). In general, the values of this calculation across tests and age groups ranged from around 4 to 6. However, due to the recognized influence of large sample size on the magnitude of chi-square statistics, we inspected additional overall model fit information from a number of fit indices—RMSEA, CFI, and NFI. The RMSEA evaluated fit between non-nested models with a good fit value of .10 or less. The CFI and NFI evaluated fit between nested models with a good fit value of .90 or more. Based on these three indices, it is concluded that the data fit the models well across individual tests and age groups.
Path Coefficients
Overview
The results were relatively consistent across age groups. All but one of the paths (Linguistic Demand → Picture Recall, ages 7-10) from Linguistic Demand to Individual Test Performance was statistically significant (p < .0005). The path coefficients from Linguistic Demand to Individual Test Performance demonstrated a relatively large range of values across individual tests for all three age group models. In contrast, only three paths from Cultural Loading to Individual Test Performance for ages 7 to 10, three paths for ages 11 to 14, and no paths for ages 15 to 18 were statistically significant (p < .0005). In addition, the path coefficients from Cultural Loading to Individual Test Performance were uniformly low in value and were relatively restricted in range. Finally, although there were relatively consistent covariance coefficients between the latent variables Cultural Loading and Linguistic Demand, these coefficients seldom exceeded .30; the maximum value for these coefficients across all models was .37.
Ages 7 to 10
Value ranges of paths for each individual test are shown in Table 2. The individual tests that had relatively high and significant (< .0005) Linguistic Demand effects were General Information (.79), Concept Formation (.82), and Verbal Comprehension (.90). The individual tests that had relatively low path coefficients were Picture Recall (.14), Planning (.26), and Spatial Relations (.28). The three individual tests that had statistically significant path coefficients from Cultural Loading, and their respective parameters, were General Information (.16), Incomplete Words (.25), and Numbers Reversed (−.18).
Path Coefficients Across Age Groups for the Direct Effects of Cultural Loading and Linguistic Demand on Individual Test Performance.
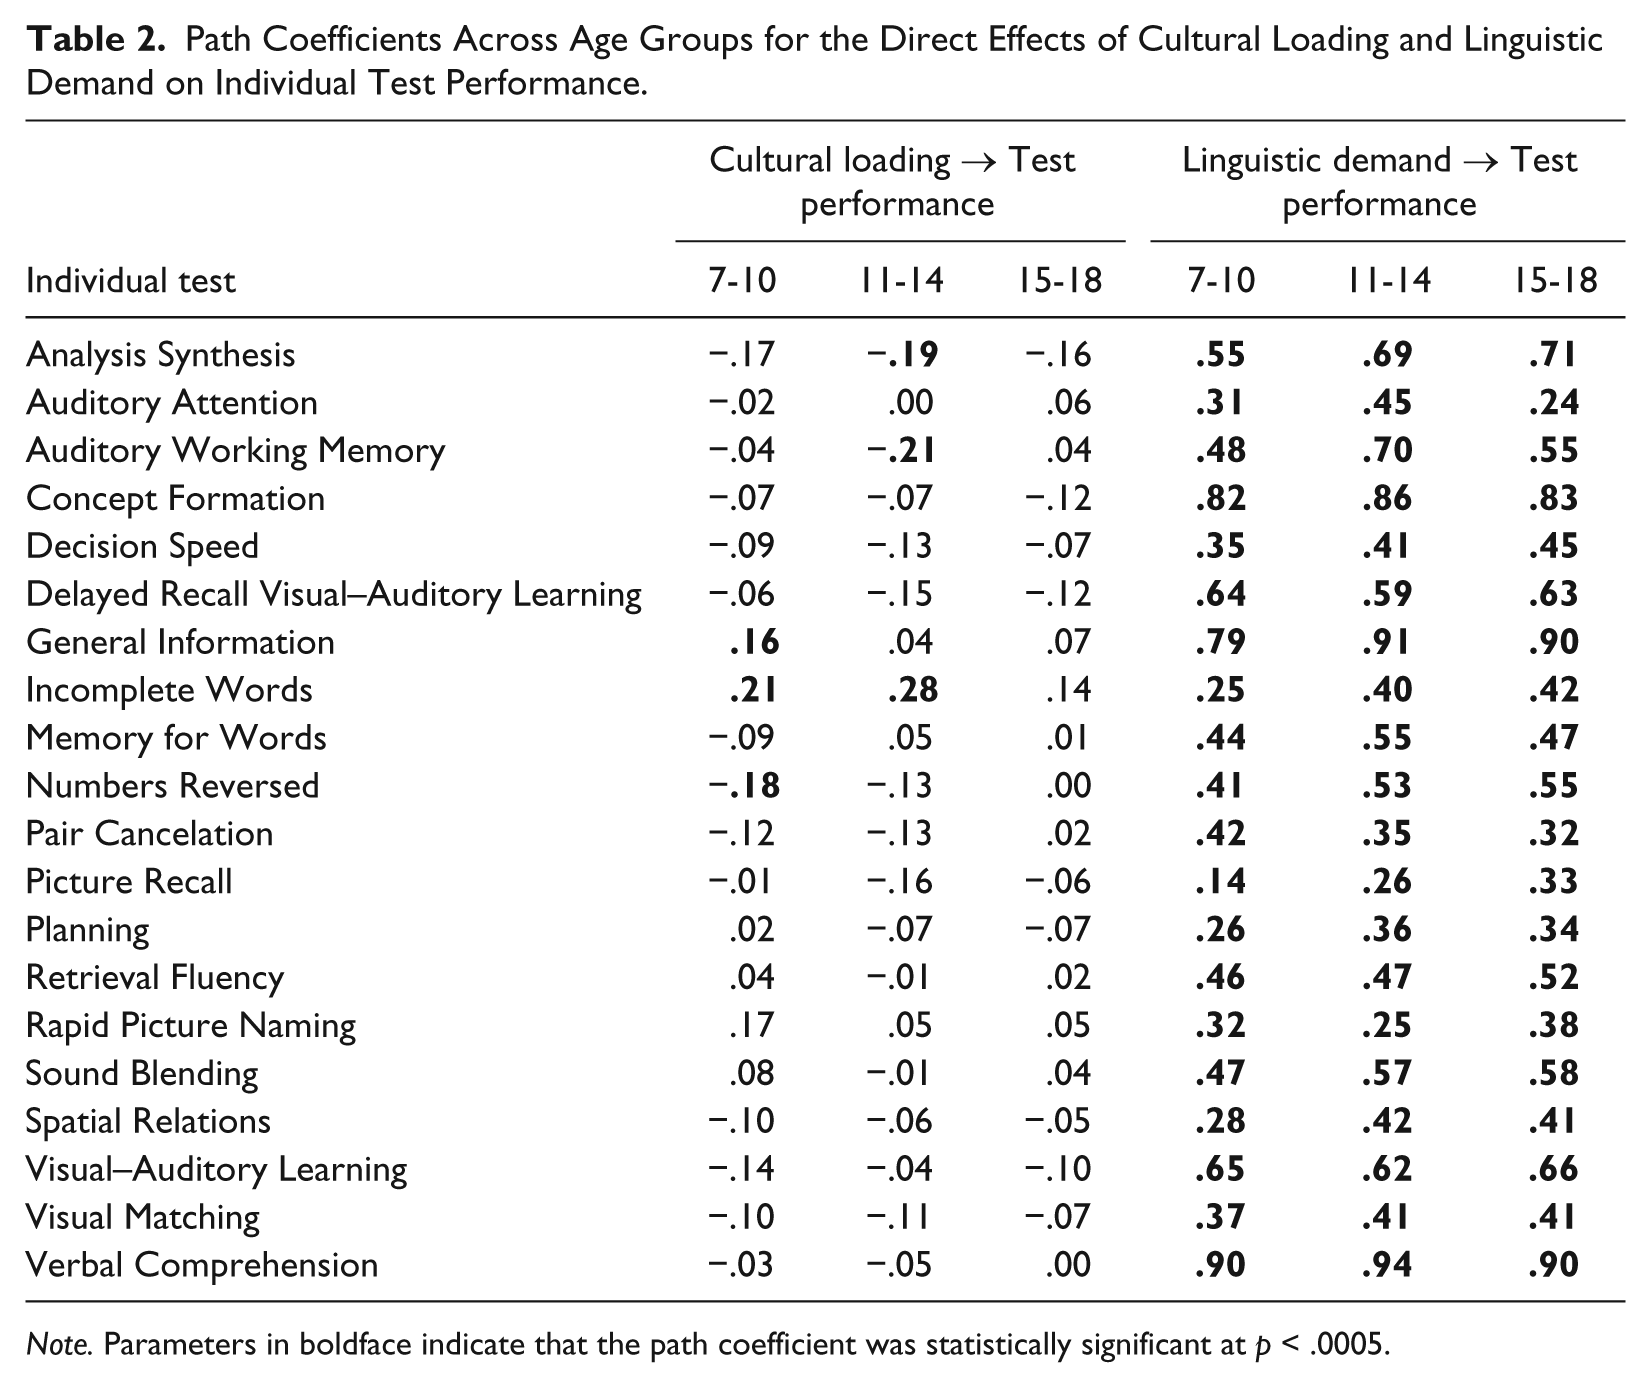
Note. Parameters in boldface indicate that the path coefficient was statistically significant at p < .0005.
Ages 11 to 14
The 11 to 14 age group exhibited similar results (see Table 2). The individual tests that had relatively high and significant (< .0005) values for the Linguistic Demand path were Concept Formation (.86), General Information (.91), and Verbal Comprehension (.94). The individual tests that had relatively low path coefficients were Rapid Picture Naming (.25) and Picture Recall (.26). The three individual tests that had statistically significant path coefficients (< .0005) from Cultural Loading, and their respective parameters, were Analysis Synthesis (−.19), Auditory Working Memory (−.21), and Incomplete Words (.28).
Ages 15 to 18
The ages 15 to 18 group again showed similar results (see Table 2). The individual tests that had relatively high and statistically significant (< .0005) values for the Linguistic Demand path were Concept Formation (.83), General Information (.90), and Verbal Comprehension (.90). The individual tests that had relatively low path coefficients were Auditory Attention (.24), Pair Cancelation (.32), and Picture Recall (.33). As noted previously, there were no paths that had a statistically significant effect on individual test performance.
Variance Explained
In general, the variance explained in the outcome variables demonstrated a relatively large range across the three age groups (see Table 3). This is consistent with the strength of the association observed in the values from the previously discussed path coefficients. Despite the relatively small variance explained by some of the models, the findings were still considered to be of practical significance; the values allowed for a categorization of the WJ III tests to be made according to the original C-LIM classifications (i.e., low, moderate, high).
Variance Explained by Exogenous Variables (Individual Test Performance) by Age Group.
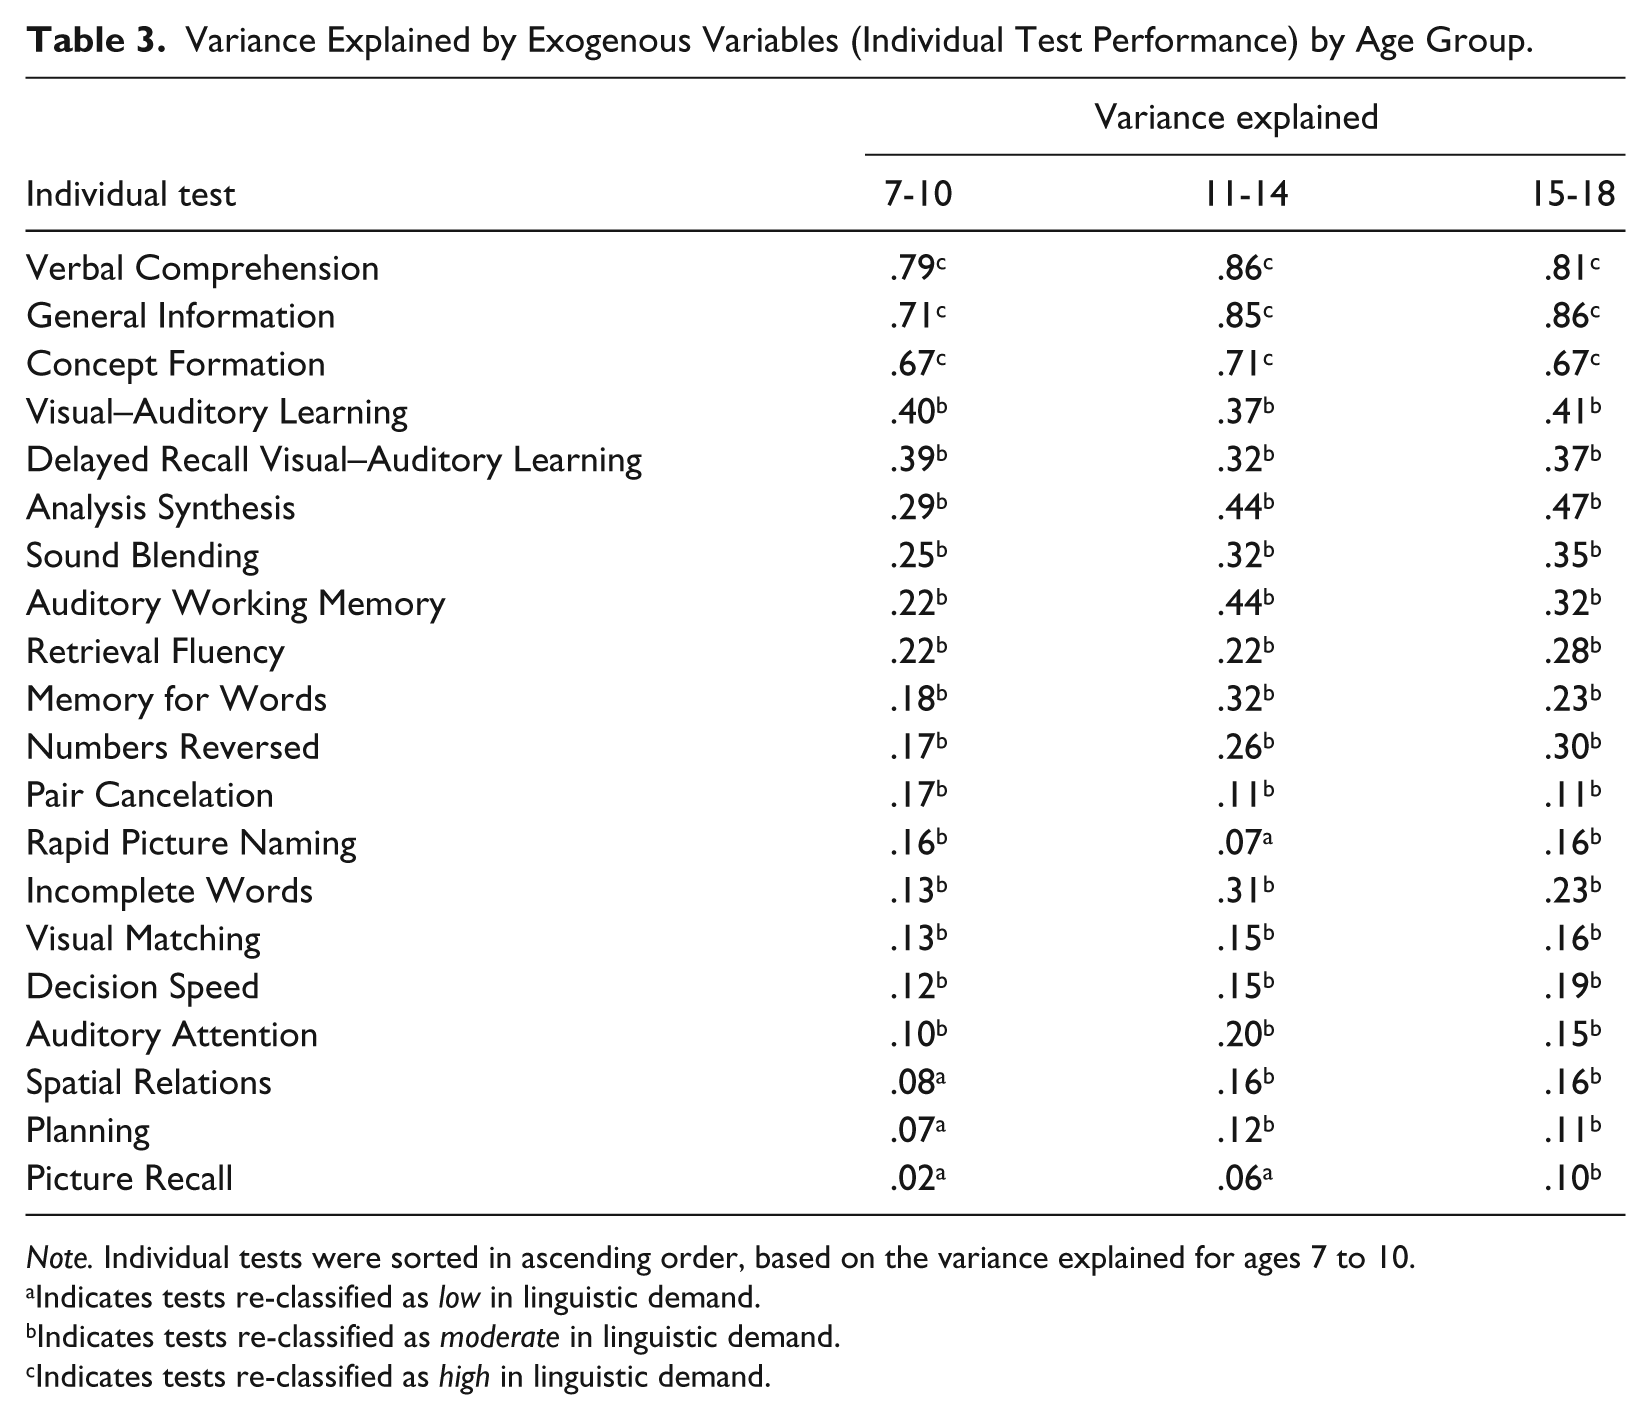
Note. Individual tests were sorted in ascending order, based on the variance explained for ages 7 to 10.
Indicates tests re-classified as low in linguistic demand.
Indicates tests re-classified as moderate in linguistic demand.
Indicates tests re-classified as high in linguistic demand.
Discussion
Flanagan and Ortiz (2001) originally developed the C-LIM to help with test selection and interpretation. In its original development, the C-LIM was based primarily on expert opinion. When examining the empirical classification of the WJ III COG tests, some patterns emerged. For example, findings indicated that the most linguistically demanding tests were all tests of Comprehension–Knowledge (Gc) and Fluid Reasoning (Gf). These tests were categorized to be high linguistic demand in the C-LIM as well. Conversely, tests with particularly low linguistic demand tended to measure domains of Visual–Spatial Processing (Gv) and Processing Speed (Gs). This also appears to be in line with the expected general trends assumed in the original C-LIM WJ III test classifications (Flanagan & Ortiz, 2001). However, the original classification appears to require modification.
Test Classifications
Previous research has relied on expert opinion (Flanagan & Ortiz, 2001) or natural breaks in quantitative data (Cormier et al., 2011) when associating individual tests from cognitive batteries to qualitative descriptors of linguistic demand and cultural loading. Here, we also examined natural breaks in the data but, in addition, considered the strength of the relationship between variables (e.g., value of the correlation/variance explained). This re-classification led to only a few (n = 3) tests being classified as high in linguistic demand and the majority being classified as moderate in linguistic demand (r = .30-.70; see Table 3). Despite a re-classification of the tests being suggested (Styck & Watkins, 2013), the “true” classification of subtests across all common measures of cognitive abilities remains unknown.
Age group differences
The results of this study suggest a significant modification to the original C-LIM classification of the tests from the WJ III COG battery. For example, a greater proportion of tests were classified as moderate in linguistic demand than proposed by Rhodes et al. (2005), particularly as student age increased. Conversely, there were fewer tests classified as low in linguistic demand as age increased, with only a single test classified as low in linguistic demand for ages 15 to 18. This trend may reflect an increase in the difficulty of the vocabulary required to provide correct answers to items on certain tests that are typically only given to older students. In other words, as students get older, they are likely to be exposed to a greater number of items with increasing difficulty given the structure of the WJ III COG and its use of ceiling rules to guide test administration.
Although a re-classification of the WJ III individual COG tests is provided, additional research is needed to validate these classifications. Nonetheless, practitioners should use and interpret the WJ III tests classified as high linguistic demand with caution, especially when testing CLD students. In addition, practitioners should also proceed with caution with those listed in the moderate range, although their influence on attenuating test scores should be less than the effect of those classified as high. It should be noted that this research does not provide a numeric value of attenuation for each level of cultural loading and linguistic demand, as suggested in Flanagan and Ortiz (2001). This may be another area for which future research could provide empirical support.
Cultural Loading
Cultural loading, as defined in the current investigation, demonstrated a significant relationship to only a few WJ III COG individual tests. This suggests that, in general, a student’s cultural background does not appear to have a significant impact on the student’s performance on the tests, as suggested by the C-LIM framework. It could be argued that cultural loading, as modeled in this study, does not adequately capture a student’s cultural background. In addition, the variance was restricted due to the cultural variables being coded dichotomously. In other words, there may be differences within race categories that were not captured in this study. Nonetheless, it is difficult to determine whether practitioners consider more information than the four factors modeled here (e.g., race, first language, language at home, and foreign born status) when selecting tests or when interpreting test scores; the current literature does not provide information about how culture is assessed in practice by school psychologists and what factors are considered when selecting measures or interpreting test performance.
Linguistic Demand
Overall, there are only three WJ III COG tests that have a high degree of linguistic demand from ages 7 to 18—an age range that represents a large proportion of the school-aged population to which school psychologists administer the WJ III COG. The results from the current investigation provide limited support for previous classifications presented on the axis of linguistic demand in the C-LIM. However, the wide range in the path values for the relationships between Linguistic Demand and Individual Test Performance supports the categorization of levels of influence for individual tests, as suggested in the C-LIM. Consequently, this study provides a re-classification of the tests from the WJ III COG battery that is supported by empirical evidence and quantitative, albeit somewhat arbitrary, cut points for the three levels of influence (i.e., low, moderate, and high). This revised classification could serve as an evidence-based guideline for practitioners in the selection and interpretation of the results from administering the WJ III COG.
The use of a normative sample allowed for the modeling of the complete spectrum of linguistic abilities and how they may interact with individual test performance from a cognitive battery (i.e., linguistic demand). Initially, the implications of the findings suggest that the linguistic loadings associated with particular tests would primarily affect CLD students. However, the findings are also important for some native English speakers, such as children and adolescents who have speech and language difficulties, given that their scores may also be attenuated due to this testing variable.
Limitations
The sample used was norming data from the WJ III Normative Update. These data present a certain limitation: There is an under-representation of immigrant populations and ELL students in the norming sample. Therefore, we were unable to determine the extent to which unique relationships among the variables exist for these specific populations. However, the current investigation did account for diversity to some degree and used multiple measures of linguistic ability to model the construct of linguistic demand. Future research could address this limitation by attempting to use similar models with a sample that has a larger proportion of CLD students.
An additional limitation is the difficulty in modeling the latent variable, Cultural Loading, due to the limited number of variables that could be selected from the extant data set. It is unclear how these variables could be improved in future research due to the level of diversity that occurs within racial or ethnic categories when identifying culture. However, future attempts at capturing diversity could consider the use of variables that could be used by practitioners when attempting to capture the potential influence of cultural loading on cognitive test scores.
Conclusion
The primary conclusion drawn from this study and previous research is that linguistic demand is an important consideration when selecting and interpreting tests of cognitive abilities. The implications of this study go beyond a re-classification of the C-LIM to emphasizing one of the underlying motivations of the C-LIM’s initial inception—the importance of considering a student’s linguistic background and abilities prior to selecting, administering, and interpreting tests of cognitive abilities. A comprehensive evaluation that takes a student’s linguistic ability into consideration should consider that a student’s language ability (i.e., conversational proficiency) might not be an accurate representation of a student’s academic language abilities (Cummins, 2008). Thus, it would be beneficial to gather information on a student’s academic language ability, due to the relationship between education and IQ (Matarazzo & Herman, 1984). A student’s receptive and expressive language abilities may be a worthwhile pursuit in future research, as student’s level of conversational proficiency in the classroom may mislead educators and psychologists to assume that the student has been exposed to English with the same frequency and depth as his or her peers (Cummins, 2008). Moreover, as suggested by the results of this study, considering the influence of linguistic ability when assessing cognitive abilities should continue to be supported by empirical evidence, instead of school psychologists continuing to rely on informal measures of linguistic ability through language samples and student interviews to gain information on language ability (Ochoa, Galarza, & Gonzalez, 1996).
A second conclusion is that it is unclear how cultural loading can be represented quantitatively in a way that is meaningful both theoretically and practically. An important, albeit unanswered question is, “What variables do practitioners take into account when making decisions about the cultural influences that may affect the selection and interpretation of tests from cognitive batteries?” Flanagan and Ortiz (2001) define cultural loading as “the degree to which a given test requires specific knowledge of or experience with mainstream culture” (p. 243). However, this broad definition does not identify specific variables that practitioners may consider in practice to make these decisions about whether a student’s experiences are significantly different from mainstream culture. Given these unanswered questions, it is possible that the underlying reasoning that led to the creation of the C-LIM and its categorization system needs to be re-thought (as also suggested by Styck & Watkins, 2013), particularly with respect to cultural loading. Specifically, it would be important to consider what is occurring and possible in practice, as this is the intended use of the C-LIM.
Footnotes
Authors’ Note
Damien C. Cormier is now in the Department of Educational Psychology at the University of Alberta.
Declaration of Conflicting Interests
The author(s) declared the following potential conflicts of interest with respect to the research, authorship, and/or publication of this article: Kevin S. McGrew is a co-author of the WJ III battery and discloses that he has a financial interest in the WJ III .
Funding
The author(s) has no financial support for the research, authorship, and/or publication of this article.