
Abstract
Adolescence is a critical period of life during which significant psychosocial adjustment occurs and in which emotional intelligence plays an essential role. This article provides validity evidence for the Trait Meta-Mood Scale–24 (TMMS-24) scores based on an item response theory (IRT) approach. A sample of 2,693 Spanish adolescents (M = 16.52 years and SD = 1.38), of whom 51.1% were boys, completed the TMMS-24. The three-dimensional structure of the TMMS-24 was confirmed, showing adequate psychometric properties for assessing adolescents. With one exception, the IRT analyses showed that the items have a reasonable fit to Samejima’s Gradual Response Model. In addition, all three dimensions exhibit the best measurement precision around the mean of the latent trait levels. Again, with one exception (Item 23), all items have a moderate to very high discrimination power.
Keywords
Emotional intelligence (EI) refers to the mental processes involved in recognizing, using, understanding, and managing one’s and others’ emotional states when coping with problems and regulating behavior (Mayer & Salovey, 1997). Adolescence is a critical period of life in which the ability to express and understand emotions is particularly important in social and psychological adjustment (Mavroveli, Petrides, Rieffe, & Bakker, 2007; Peña-Fernández, Andreu-Rodríguez, Barriga, & Gibbs, 2013). To manage emotion in an appropriate way, especially in adolescents, EI plays an important role (Mayer, Perkins, Caruso, & Salovey, 2001). Previous research has shown that adolescents with better developed EI show greater social support and use more effective coping strategies, which in turn, modulate the effects on academic performance, well-being, and life satisfaction (Austin, Saklofske, & Mastoras, 2010; James, Bore, & Zito, 2012; Keefer, Parker, & Wood, 2012; Saklofske, Austin, Mastoras, Beaton, & Osborne, 2012). EI can be considered a part of personality (Russo et al., 2012; Watson, 2000) but still leaving a good amount of variance unique to EI (Saklofske, Austin, & Minski, 2003).
The different conceptualizations and definitions of EI have resulted in a range of measurement instruments (James et al., 2012); among them, the Trait Meta-Mood Scale (TMMS; Salovey, Mayer, Goldman, Turvey, & Paarfay, 1995) is one of the most widely used (Gorostiaga, Balluerka, Aritzeta, Haranburu, & Alonso-Arbiol, 2011). The TMMS was designed to assess individual differences in the process of emotional regulation and addresses three key aspects of EI: emotional attention, emotional clarity, and emotional repair.
Although EI scales have received wide use, more empirical data about their psychometric properties are required, especially when these scales are adapted, translated, and then used in different countries (Li, Saklofske, Bowden, Fung, & Yan, 2012). Previous research conducted with the TMMS with Spanish participants reports high reliability coefficients, ranging from .82 to .90 for the general population (Fernández-Berrocal, Extremera, & Ramos, 2004; Salovey et al., 1995), and moderate values in adolescents, with alpha coefficients between .68 and .86 (Díaz-Castela et al., 2013; Extremera, Durán, & Rey, 2007; Fernández-Berrocal, Alcaide, Extremera, & Pizarro, 2006; Gorostiaga et al., 2011; Salguero, Fernández-Berrocal, Balluerka, & Aritzeta, 2010). Moreover, the instrument has shown adequate convergent and discriminant validity (Fernández-Berrocal et al., 2004). In the field of EI, the application of advanced psychometric methods such as item response theory (IRT) is rare and thus, some cause for concern among researchers and clinicians (Matthews, Zeidner, & Roberts, 2007). There is little published work to which IRT has contributed (Cooper & Petrides, 2010). The work done with the TMMS has been based on classical test theory (CTT). Nonetheless, psychometric technology based on IRT models has many advantages when compared with the classical approach (Hambleton & Jones, 1993). IRT, through its item level analysis, both establishes the probability of a participant endorsing an item and allows the comparison of scores from different participants in different measurement instruments. Therefore, this approach provides an invariant metric with respect to the evaluated sample and the instruments used for whatever end (De Ayala, 2009; Hambleton, Swaminathan, & Rogers, 1991).
Within the IRT framework, the Graded Response Model (GRM; Samejima, 1969) provides Information Functions for each item (Item Information Function; IIF), and for the global test (Test Information Function; TIF). The IIF indicates the measurement precision of an item across different levels of the trait being measured, whereas the TIF indicates the measurement precision of the test across different levels of the measured trait. This information is much more detailed than reliability coefficients based on CTT. So bearing in mind IIF and TIF, it is possible to understand both the precision of the scale for each trait level, and which items are most appropriate to apply to each person. In addition, IRT allows the estimation of discrimination (a-parameter) and threshold (b-parameter) parameters of the items.
Differential item functioning (DIF) of TMMS items will be analyzed in detail. DIF occurs when examinees from different groups show differing probabilities of success on (or endorsing) the item after matching on the underlying trait that the item is intended to measure (Gomez-Benito, Hidalgo, & Zumbo, 2013). For this reason, studying DIF has a special relevance when it comes to investigations where measurement invariance is evaluated. So, if one of the items presents DIF and it has not been detected previously, the conclusions obtained from the measurement invariance analyses may be biased. The two types of existing DIF are termed uniform and non-uniform (Mellenbergh, 1982). Uniform DIF occurs when there is no interaction between the trait level and being part of a group, that is to say, when the probability of endorsing a certain item is uniformly greater for one of the groups throughout the different trait levels. Non-uniform DIF, however, is present when there is an interaction between trait level and group, that is, the difference in the probability of endorsing an item is not the same for all trait levels.
Although there are many psychometric advantages offered by IRT, the TMMS have not been systematically investigated to date using these newer psychometric tools. The main purpose of this article is to obtain new validity evidence for the Spanish version of the TMMS-24 (Fernández-Berrocal et al., 2004) scores using IRT in a community sample of Spanish adolescents.
Method
Participants
Participants were 2,693 adolescents (of whom 51.1% were boys) recruited from 22 schools of three autonomous communities located in the North of Spain. Ages ranged from 14 to 23 years, with a mean age of 16.52 (SD = 1.38). The sample was from secondary schools, with 34.20% in their final year of compulsory secondary education, 57.90% doing A Levels and 7.80% undergoing vocational training.
Once the test was administered, only 0.4% of data were identified as missing. Given that the magnitude of missing data was so small, it was handled using the listwise deletion method (Fernández-Alonso, Suárez-Álvarez, & Muñiz, 2012).
Measure
EI was assessed with the standard Spanish adaption of the TMMS-24 (Fernández-Berrocal et al., 2004). The questionnaire consists of three subscales: attention (eight items; α = .89), which assesses the amount of attention paid to one’s own emotional state; clarity (eight items; α = .83), which evaluates the understanding of one’s emotional state; and emotional repair (eight items; α = .78), which refers to the ability to regulate one’s emotional state. Participants rate the extent to which they agree on a 5-point Likert-type scale where 1 means strongly disagree and 5 strongly agree. High scores for repair and clarity dimensions indicate appropriate levels in both dimensions whereas high scores on attention implies excessive attention to feelings, something that should be improved on.
Procedure
Participation was voluntary, and no incentives were provided. Data were collected in the classrooms provided by the schools. Psychologists trained in the use of measurement instruments administered the tests.
Data Analyses
First, to analyze the factorial structure of TMMS-24 a confirmatory factor analysis (CFA) was conducted on the total sample. Second, the sample was divided by sex, and a CFA was carried out on each of the subsamples to analyze the robustness of the three-factorial structure by sex through a cross-validation process (Browne, 2000; Rios, & Wells, 2014). In all cases, the Robust Maximum-Likelihood Method was selected because of the non-normality of the distributions and analyzed using the Saphiro–Wilk normality test. As the TMMS-24 states, a three-dimensional structure was proposed in all cases. Goodness-of-fit to the sample data was determined by means of the following indices: χ2 likelihood ratio divided by the degrees of freedom (χ2/df), comparative fit index (CFI), and root mean square error of approximation (RMSEA). Byrne (2001) suggested that for a good fit to the model, the CFI should be higher than .95, the RMSEA lower than .06, and the value of the χ2/df ratio lower than 2. Moreover, interfactor correlations were calculated.
The DIF was analyzed through logistic regression. Each subscale was analyzed independently and the matching criterion was purified in the process of conducting the DIF analysis. Ordinal Cronbach’s coefficients of the subscales of TMMS-24 were estimated (Elosua & Zumbo, 2008).
In the framework of IRT, the Samejima’s (1969) GRM was used, applying three separate models for each TMMS-24 subscale. Analysis of the standardized residual errors of the 24 items of the TMMS-24 was carried out. Moreover, the IFs were calculated for the three subscales of the TMMS-24, and the parameters and IFF were estimated for each of the 24 items. Interfactor correlations were calculated in this case too.
The statistical analyses were carried out using SPSS 19.0, Mplus 5.1, and Multilog 7.03.
Results
Construct Validity and Robustness of the Construct by Sex in Adolescents
As can be seen in Table 1, the three-dimensional structure of TMMS-24 was confirmed in the full sample and separately for male and female groups. The factorial loadings of the three subscales, for the three subsamples were between .44 and .84, except Item 23, which had values of .19, .22, and .18 in the full sample, the male group, and the female group, respectively. These results follow the same pattern when the item discrimination indices for the full sample, the male group, and the female groups are analyzed. All of the values are above .38 except, again, Item 23, which has discrimination indices of .21 (total and girls) and .23 (boys).
Factorial Structure of TMMS-24 in Spanish Adolescents.
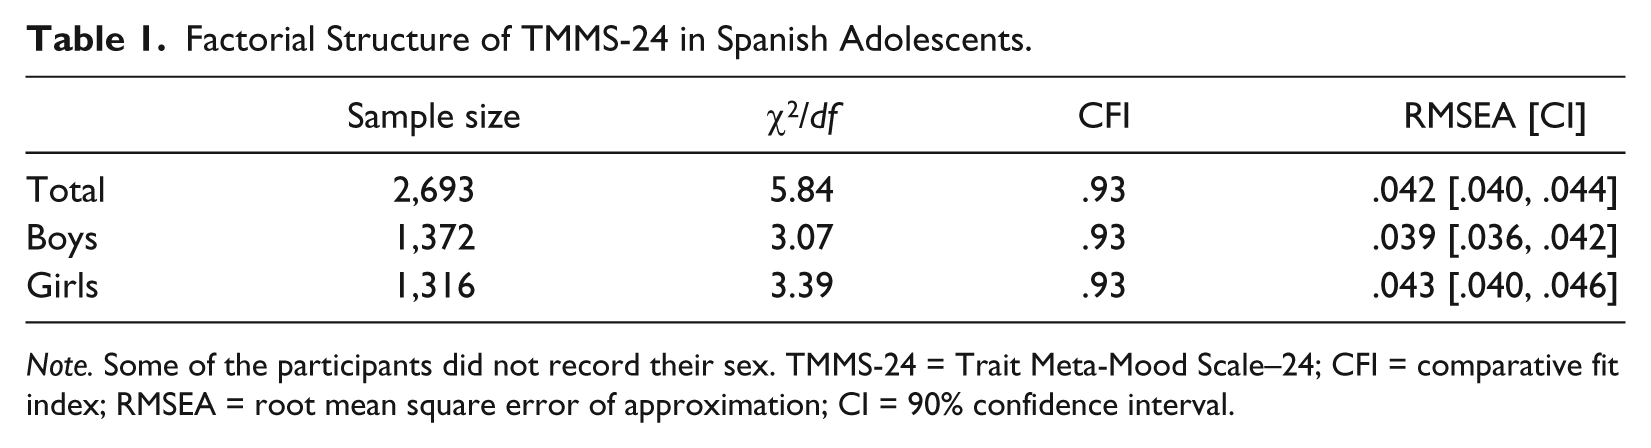
Note. Some of the participants did not record their sex. TMMS-24 = Trait Meta-Mood Scale–24; CFI = comparative fit index; RMSEA = root mean square error of approximation; CI = 90% confidence interval.
Interfactor correlations obtained for both the whole sample and the subsamples of boys and girls are shown in Table 2.
Interfactor Correlations for the Confirmatory Factor Analysis.

Note. r = Pearson correlations.
DIF
The DIF in relation to sex was analyzed through the logistic regression method, and it can be observed that several items exhibited DIF from a statistically significant perspective (see Table 3). However, when analyzing such a large sample, statistical testing of DIF alone might provide misleading information (Kim, Cohen, Alagoz, & Kim, 2007). Taking the effect size into account, only one of the items exhibited more than negligible DIF: Item 23 shows uniform DIF, where girls more often endorsed this item than boys, irrespective of their standing on the latent trait.
DIF and Effect Size of the TMMS-24 Items.
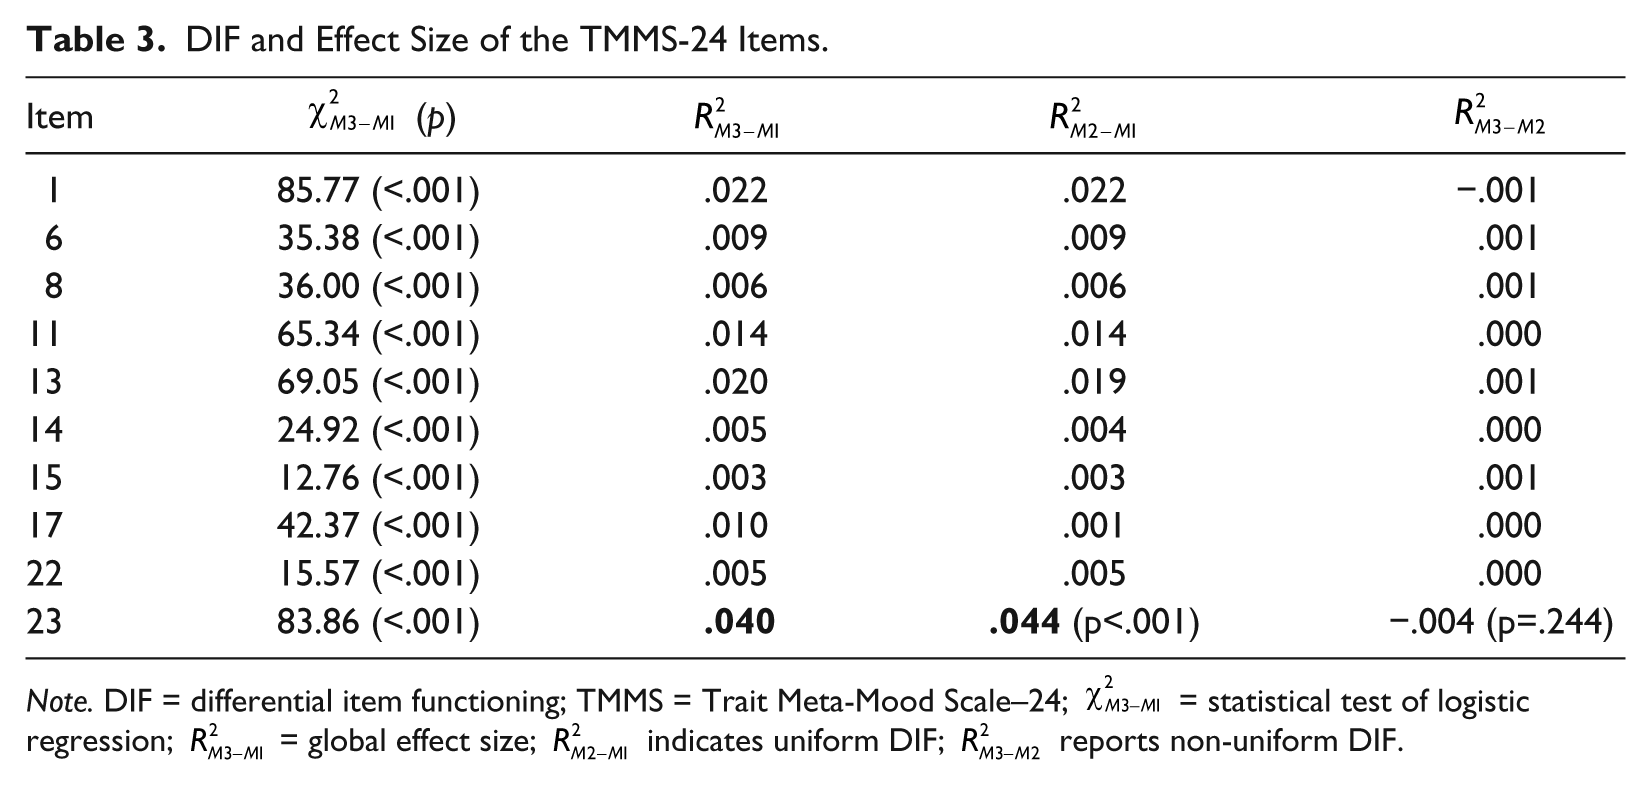
Note. DIF = differential item functioning; TMMS = Trait Meta-Mood Scale–24;
IRT Analysis
An examination of the standardized residual errors of the 24 items of the TMMS-24 showed that approximately 90% of the residuals were found within limits (−3 < r < 3) that indicate a good fit of the data to the model, and thus, it may be concluded that all of the items fit the model (Liang, Han, & Hambleton, 2008).
Parameters a and b for each item on the scales of the TMMS-24 showed that except for one, all items have a moderate to very high discrimination power (see Table 4). Half of the items exhibit a very high discrimination, with most of the best discriminating items belonging to the emotional attention dimension. The b-parameters shown in Table 4 reach, in most cases, relatively low to moderate values. When using Samejima’s GRM, the number of b-parameters is one less than the number of alternatives for that item. As there are five alternatives for the items in the TMMS-24, there are four values of b for each item. The b-parameter indicates, for a given level of the trait (θ), the probability of selecting a specific response category or higher. This means that the probability of choosing the first category or higher will always be 1, not including the corresponding b for this category of response. However, the difference between the values of these parameters (b4 − b1) can be interpreted as an indicator of the ease with which a person may change his or her response from one category to another. To put it another way, if the differences between b values are small, it means that there is a similar probability of choosing any of the response categories. And so, there is a big chance that in the future, a person may change his or her response from one category to another. In contrast, as these differences grow, the probability of choosing a different category of response shrinks and so a change becomes less probable. Understanding b4–b1 differences can be a great help in applied contexts when planning the possibility of carrying out a clinical intervention to improve aspects of people’s EI. It would be easier to change the response when b4–b1 difference is smaller. In contrast, a change is more unlikely when trying to modify aspects covered by items with a larger b4–b1 difference. To sum up, the difference between the b-parameters of an item gives an indication of the possible benefits of an intervention designed to change aspects of EI that are deficient in a specific population. Subsequently, the largest differences (b4 − b1) for the items of the EI questionnaire were found in the emotional repair subscale, and the smallest differences correspond to the emotional attention subscale. According to the previous explanations, this means that it would be easier to change the subjects’ responses for emotional attention than for emotional repair.
IRT Parameter Estimates for TMMS-24.
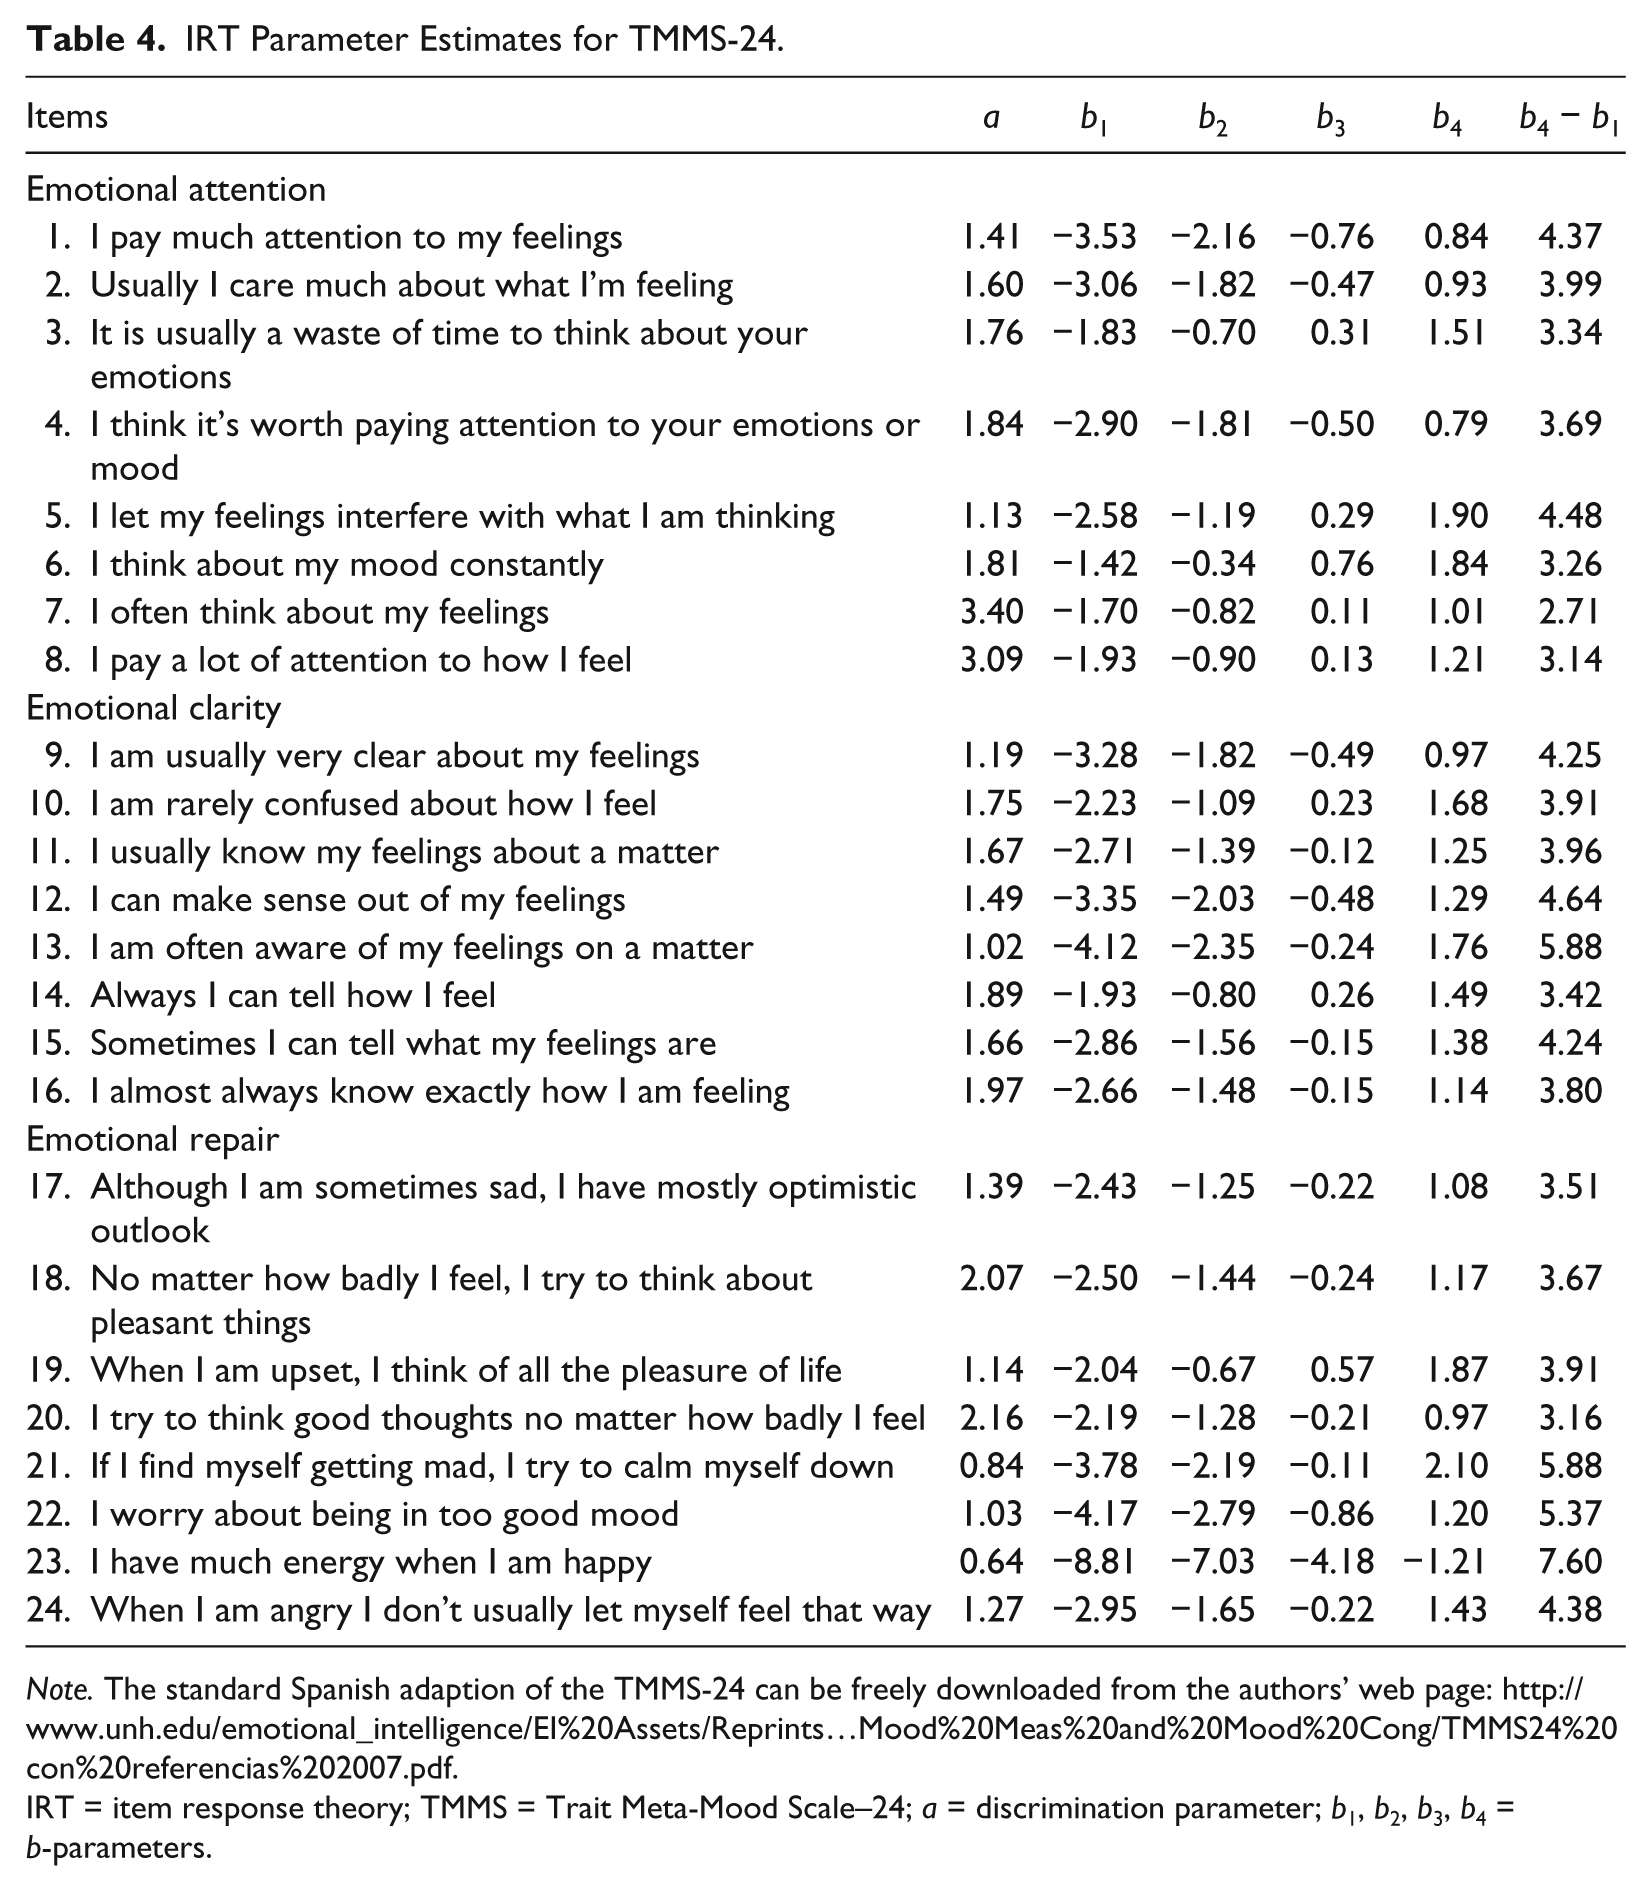
Note. The standard Spanish adaption of the TMMS-24 can be freely downloaded from the authors’ web page: http://www.unh.edu/emotional_intelligence/EI%20Assets/Reprints…Mood%20Meas%20and%20Mood%20Cong/TMMS24%20con%20referencias%202007.pdf.
IRT = item response theory; TMMS = Trait Meta-Mood Scale–24; a = discrimination parameter; b1, b2, b3, b4 = b-parameters.
To further explore the measurement precision of the TMMS-24, the IF, representing the accuracy and the standard measurement error, was estimated for each dimension. In general, all three IFs exhibit maximum information between −2 and +1 trait levels, showing the best measurement precision around the mean of the trait levels. The three scales reduce their accuracy around the highest levels of the trait, especially in individuals with a latent trait level above +2.
Table 5 shows item information values for the TMMS-24, where some of the items had uniformly low IIF values across the latent trait range; however, many other items had moderate to high IIF values.
Item and Test Information Functions for the TMMS-24.
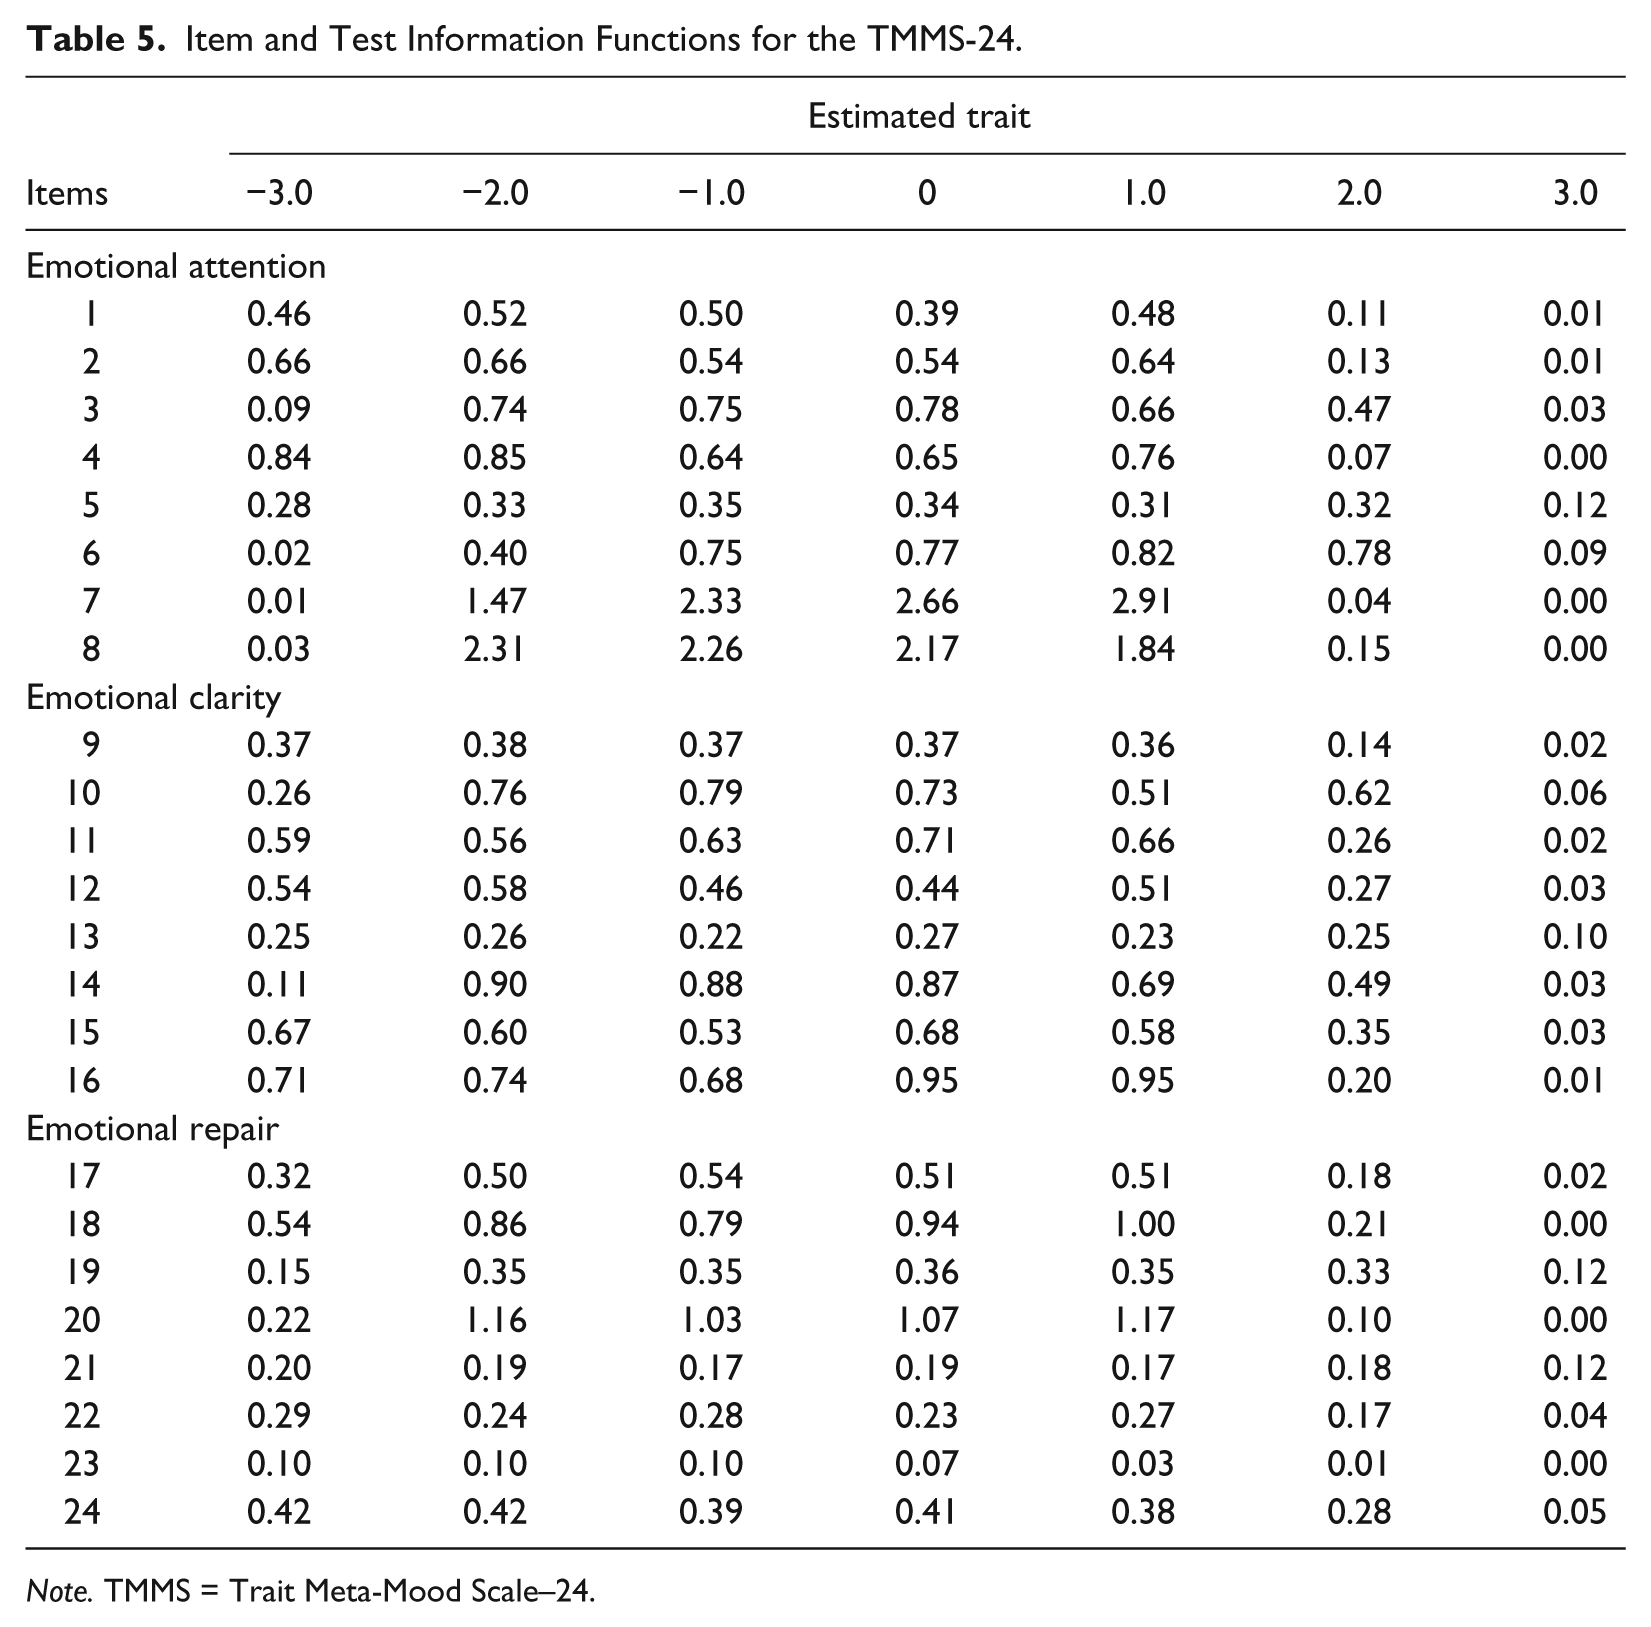
Note. TMMS = Trait Meta-Mood Scale–24.
In addition, the interfactor correlations from the trait levels of the participants on the three dimensions of the TMMS-24 are as follows: rclarity–attention = .373, rrepair–attention = .076, and rclarity–repair = .269. As expected, these interfactor correlations are very similar to those calculated in the CFA (Table 2).
Discussion and Conclusion
The main goal of this article was to obtain new validity evidence for the TMMS-24 in a community sample of Spanish adolescents as part of the growing cross-cultural analyses of EI measures. The three-dimensional structure proposed in the original instrument (Salovey et al., 1995), and in the Spanish version used here (Fernández-Berrocal et al., 2004), was confirmed. The three-factor structure of the TMMS-24 was also confirmed in the full sample and separately for male and female groups. These results converge with those obtained by previous researchers (Díaz-Castela et al., 2013; Extremera et al., 2007; Martín-Albo, Núñez, & León, 2010). As can be seen in Table 2, the dimensions that show the highest correlations are clarity and emotional attention. These results are in accordance with other findings to date in the Spanish population (Extremera et al., 2007; Fernández-Berrocal et al., 2006; Fernández-Berrocal et al., 2004).
Only Item 23 exhibited uniform DIF. In addition, this item had the lowest discrimination index, and factor loadings, both in the full sample and when analyzed across sex. This item had also demonstrated problems related to its factorial loading in previous research with Spanish adolescents (e.g., Díaz-Castela et al., 2013; Gorostiaga et al., 2011). As a possible explanation of this item’s bias, the authors share the explanation put forward by Salguero et al. (2010) about the possibility that the item might imply the need for recognition of the signs that accompany positive emotions, something that could be associated with EI skills other than emotional repair.
The reliability coefficients obtained here are similar to preceding articles (Díaz-Castela et al., 2013; Extremera et al., 2007; Gorostiaga et al., 2011; Salguero et al., 2010), where dimensions of emotional attention and emotional repair displayed the highest and the lowest coefficients, respectively. Using the IRT models, in general, a-parameters show moderate to very high values, indicating they are effective at discriminating individuals across the range of the latent trait (θ), especially in the dimension of emotional attention. Regarding b-parameters and the difference b4 − b1, when attempting to begin a psychological intervention to help a participant improve his or her EI, it is possible to plan two approaches. On one hand, if one wants to achieve significant changes for the person, it will be necessary to intervene in those aspects where the b4–b1 difference is greater, in this case, in the emotional repair dimension, especially in Items 21 to 24. On the other hand, the intervention will be more successful when it is carried out in those dimensions where the difference is smaller. This is because the change is easier and so, it is possible to achieve small changes that may motivate the participant to continue with the intervention. In this case, the intervention should initially focus on aspects related to emotional attention; afterward, it would be necessary to work on emotional clarity; and, finally, on the items related to emotional repair. It must be remembered that the parameter values cannot be compared between scales, but the difference b4 − b1 can be compared. So the scale in which these differences are the smallest will be the most appropriate when it comes to implementing any intervention.
With respect to the IFs of the three dimensions of the TMMS-24, the current findings suggest the most accurate measurement of EI occurs around the mean score, and the least accurate for the higher levels of EI. Thus, the TMMS-24 shows adequate reliability when assessing persons with low and medium EI scores, but this decreases when assessing participants with very high scores in EI.
Although they used a different instrument (Trait Emotional Intelligence Questionnaire–Short Form [TEIQue-SF]) from the one used in this research, the IF has a similar pattern to that found by Cooper and Petrides (2010), showing the lowest accuracy at very high levels of the latent trait. This indicates that the TMMS-24 evaluates practically the whole person with appropriate precision and has reduced precision when evaluating people with very high values in the measured variable, who make up less than 1% of the cases. This behavior of the TMMS-24 is expected, because the precision of the test is the result of the precision of each one of the items, and the precision of the items making up the TMMS-24, given by the IFs, is high for all levels of the measured variable and low for extremely high values.
Regarding the precision of the items (reliability) over the different trait levels, there was a tendency for the IIF values to decrease sharply for those θ values higher than two standard deviations above the mean. For values greater than θ (three standard deviations above the mean), the precision of the items is considerably reduced. Although in practical situations, the number of people who have these high values of EI is very scarce (less than 1%), this aspect must be borne in mind, and the TMMS-24 must be used prudently in such situations, given that its reliability is reduced when evaluating this type of person. These results are similar to those found by Cooper and Petrides (2010), in which they analyzed the IIF in the TEIQue-SF scale. Specifically, Items 7 and 8, 14 and 16, and 18 and 20 show the highest values on each subscale. Conversely, Items 5, 13, and, especially, 21 and 23 report the lowest information on each subscale of the TMMS-24.
In sum, new validity evidence obtained in a large community sample of adolescents support the three-dimensional structure of the TMMS-24 in the full sample and separately for male and female groups. With respect to the DIF analyses, Item 23 should be examined to determine the reason for the bias. The three scales assess with a high degree of precision in a wide range around the score means, decreasing in precision as the trait levels increase. These findings should prove useful when determining the focus of programs designed to increase levels of EI in adolescents (Dacre Pool, & Qualter, 2012). Finally, it would be desirable to use complementary measures coming from different sources of information, such as families, teachers, or other proxies.
Footnotes
Acknowledgements
The authors wish to sincerely thank the reviewers for their comments that have helped us to greatly improve the article.
Declaration of Conflicting Interests
The authors declared no potential conflicts of interest with respect to the research, authorship, and/or publication of this article.
Funding
The authors disclosed receipt of the following financial support for the research of this article: This research was funded by the Spanish Ministry of Education and Science, and the Ministry of Economy and Competitiveness (AP2010-1999 and PSI2011-28638).