
Abstract
As the United States has begun to lag behind other developed countries in performance on mathematics and science, researchers have sought to explain this with theories of teaching, knowledge, and motivation. We expand this examination by further analyzing a measure of interest that has been linked to student performance in mathematics and intention to enroll in advanced mathematics classes. Using Item Response Theory (IRT), the purpose of this study was to evaluate the psychometric properties of the Mathematics Interest Inventory (MII). Six hundred sixty-six students (47.6% Hispanic, 48.2% Male) formed the sample. Results revealed minimal differential item functioning (DIF) between genders. Substantial DIF emerged between Hispanic and White students. Implications of the differential functioning and the measurement of interest in mathematics are discussed.
Keywords
Over the last few decades, students’ performance in mathematics and science in the United States has begun to lag behind their international peers (Fleischman, Hopstock, Pelczar, & Shelley, 2010; Provasnik et al., 2012; Shorrocks-Taylor & Jenkins, 2002). While many may attribute this to poor teaching or a lack of knowledge and focus on pedagogical reform (e.g., Seymour, 2002; Smith, Sheppard, Johnson, & Johnson, 2005), others hold a motivational perspective. In his seminal work on social cognitive theory, Bandura (1986) stated, “People do not enact everything they learn. They may acquire and retain the capabilities to execute modeled activities adeptly but rarely or never perform them” (p. 68). The motivation to act on one’s knowledge is what distinguishes knowing and performing (Bandura, 1986). To facilitate student performance in areas of science, technology, engineering, and mathematics (STEM), programs have been designed to explicitly focus on STEM-related careers, and educational foci have sought to instill and capture students’ interest in STEM as early as elementary school (DeJarnette, 2012; Russell, Hancock, & McCullough, 2007). According to Lent, Brown, and Hackett (1994), interest plays a major role in connecting self-beliefs to performance and occupational decisions (see also Brown & Lent, 2006), including the decisions to enter a STEM profession (Lent et al., 2001; Lent, Lopez, Lopez, & Sheu, 2008). To see students’ self-beliefs and interests lead to successful endeavors in coursework and occupations in STEM fields, researchers need to be confident in the measurement devices and implications of the results that educators and policy makers base their decisions on.
Most researchers tend to rely on self-report instruments as a way to measure personal factors (e.g., self-efficacy, interest, affect). However, self-report instruments need to be used with caution as they tend to be biased. We need to be constantly aware that the implications we construct based on the results of potentially biased and faulty measures may be incorrect. Apart from the obvious issue of social desirability (Spector, 1994), respondents need to be adequately and accurately aware of their knowledge (i.e., metacognition) and abilities (Schunk, Pintrich, & Meece, 2008). The socialization of individuals may also have an influence on an individual’s self-beliefs (Bandura, 1986). For example, past research on gender and STEM fields have shown that there is a difference in the levels of interest between males and females in mathematics (Evans, Schweingruber, & Stevenson, 2002; Köller, Baumert, & Schnabel, 2001; Marsh, Trautwein, Lüdtke, Köller, & Baumert, 2005; Renninger, 1992). A prominent question would be, is this a function of true interest, social manipulation, or of bias in the measurements? In addition, the socialization argument extends to ethnically and linguistically diverse individuals. Because of differences in language use or level of communication, the wording within instruments may threaten its validity (e.g., Church, 2001; Ramirez, Teresi, Holmes, Gurland, & Lantigua, 2006). As important conclusions are drawn from the results of these measurement devices, it is important that researchers thoroughly test and modify their instruments to not only accommodate the diversity of respondents but also place restrictions on use so that researchers cannot make inaccurate conclusions about subgroups within a population.
There are multiple reasons why researchers may decide to develop and utilize new instruments, including a lack of measurement devices for a certain construct, inappropriate construct conceptualization in previous measurements, or an inaccurate measurement scheme. In response to the call for better measurements of mathematics interest, Stevens and Olivárez (2005) developed the Mathematics Interest Inventory (MII). The MII was developed with situational and individual interest in mind, focusing explicitly on emotion, knowledge, and value. In the construction of the MII, items were worded to facilitate young respondents. That is, the items were created to reflect the language and behavior relevant to fourth graders. The validation of the instrument occurred in three phases, utilizing three distinct samples. The first phase consisted of an exploratory factor analysis of the original 62 items on the first sample (n = 170), which resulted in a three-factor (i.e., Positive Valence [PV], Negative Valence [NV], Time) solution. The second phase consisted of fitting the second sample of 282 students to a confirmatory factor analysis based on the results of the first phase and resulted in an adequately fitting model after a few items were removed due to poor loadings. The final phase utilized the third sample of 272 students to evaluate the application of the model to older children. The confirmatory factor analyses (CFA) model retained adequate fit even with an older student sample. Significant, positive correlations with students’ current mathematics grades of the students across the phases suggested good concurrent validity. Subsequent studies examining the MII and achievement have demonstrated consistently high correlations with other motivational factors (e.g., self-efficacy, self-determination) and achievement (Stevens, Olivárez, & Hamman, 2006). In addition, these studies have also demonstrated the predictive ability of mathematics interest (via MII) as a full moderator of the relationship between mathematics self-efficacy and the intentions to enroll in more mathematics courses during high school (Stevens, Wang, Olivárez, & Hamman, 2007). Across all of these studies, the MII has shown to have good internal reliabilities (Cronbach’s α ≥ .70; Kline, 2000), with one exception that the Time subscale fell below this cut-off in one sample of the instrument validation study (α = .57; Stevens & Olivárez, 2005). Overall, the instrument appears to be a psychometrically sound measure of mathematics interest; however, with a focus on gender and ethnic differences in STEM fields, more information is needed.
Using the MII, Stevens and colleagues (Stevens et al., 2006; Stevens et al., 2007) found significant mean score differences between Hispanic and White students, yet a non-significant mean score difference between boys and girls. Although it might be of interest to know that mean score differences between boys and girls were not significant or that Hispanic students had significantly higher levels of mathematics interest, it still fails to explain where the discrepancies occurred or if these occurred as a function of true mathematics interest or some other barrier introduced via instrument. Further analysis is needed to determine if the non-significant difference between boys and girls is truly a function of similar mathematics interest or of compounded error in a composite score. In addition, further analysis is needed to determine whether the significant mean differences between Hispanic and White students is reflective of their mathematics interest or if some underlying bias influenced different responses.
The purpose of the current study was to evaluate the item-level characteristics of the MII using Item Response Theory (IRT; Lord & Novick, 1968). IRT has emerged to address the well-documented shortcomings of classical test theory (CTT), offering three primary advantages: (a) the estimate of an examinee’s latent trait is independent of the particular sample of items that are administered, (b) the item characteristics are independent of the particular sample of respondents, and (c) a statistic indicating the precision with which each respondent’s latent trait as estimated is provided, and this statistic is free to vary among respondents (Hambleton & Swaminathan, 1985). While a theory is understood as a scientifically acceptable set of principles advanced to explain and predict a phenomenon, IRT is in fact a system of mathematical models that defines one way of establishing the correspondence between latent constructs and their indicators (de Ayala, 2009). In the current study, we adopted Samejima’s (1969) graded response model among the available IRT models because it is appropriate for handling the situation where item responses are contained in two or more ordered categories.
The fairness of the MII is of particular interest to us given that certain subgroups (i.e., girls, Hispanic students) earned statistically equal or higher scores on the scale than their counterparts (Stevens et al., 2006; Stevens et al., 2007), despite the findings that women and ethnic minorities showed lower intention to take advanced mathematics courses or enter STEM careers (e.g., Beasley & Fischer, 2012; Deacon, 2011; Shapiro & Williams, 2012). An instrument is not fair when two groups of an equal amount of a latent trait earn different scores on the same item (Gall, Gall, & Borg, 2006); such measurement bias is also termed as differential item functioning (DIF; Holland & Wainer, 1993). Taken into the current context, DIF analyses are warranted because any group difference across gender or ethnicity captured by the MII may be a function of measurement bias, rather than true differences in the latent trait.
The following research questions were to be addressed:
These research questions entailed a comprehensive review of the item-level IRT parameters (i.e., item discrimination and thresholds) and measurement bias (i.e., DIF). Answers to these questions could guide the future use of the MII by providing recommendations on the selection of a set of items that are most informative and least biased in the subscale level.
Method
Participants
The data for the current study were drawn from Stevens et al.’s (2006) study on the mathematics achievement gap between Hispanic and White students. A total of 666 participants were recruited from students attending schools in west and south Texas. The overall percentage of missing data was limited to 0.4% of all data cells, with percentages ranging from 0% (n = 0) to 1.0% (n = 7) by individual item. Table 1 summarizes the demographic information of the participants by grade level.
Demographic Information of Participants (N = 666).

Note. Participants’ ages ranged from 8 to 18 years with a mean of 13.31 years old (SD = 2.01). For the demographic information, missing data are limited to 0.5% on gender (n = 3), 1.5% on ethnicity (n = 10), and none on grade level.
Measures
The traditional approach to gauging interest by simply asking the question “are you interested?” has been criticized for overestimating people’s awareness of their own level and degree of interest. Particularly, a person hardly uses the term interest in its more general shared meaning beyond its common-language meaning in everyday life (Valsiner, 1992). The MII was developed to address this issue by assessing interest through simple behavioral indicators (Stevens & Olivárez, 2005). The MII consists of 27 items gauging three factors of mathematics interest: PV, NV, and Time. PV is assessed by 10 items and reflects the degree to which students report a positive attraction toward mathematics (e.g., “I like to answer questions in math class.” “I feel good when it comes to working on math.”). NV is assessed by 10 items and related to negative experiences associated with mathematics (e.g., “I am bored when working on math.” “I get mad easily when working on math.”). Time is assessed by seven items and reflects the amount of time and effort respondents commit to mathematics (e.g., “I work more math problems than what I have to.” “I spent many hours working on math.”). Respondents are asked to rate how well each item described them on a response scale (1 = not at all like me, 4 = very much like me). The average internal consistency reliabilities (Cronbach’s α) were reported to be .93 for PV, .80 for NV, and .69 for Time in the instrument validation study (Stevens & Olivárez, 2005). Although it seems counterintuitive that negative affect is indicative of interest, NV was shown to have significant, positive correlations with PV in this validation study. This finding actually has its theoretical basis that the presence of interest is not always accompanied with positive feelings, but sometimes negative experiences as well (Hidi & Anderson, 1992; Iran-Nejad, 1987; Renninger & Hidi, 2002). The total score of the MII is therefore computed by adding up item scores, thus ranging from 27 to 108. The MII has been administered in the English version only.
Analyses
A major assumption of IRT analyses is unidimensionality, which refers to the notion that a set of items measures a single latent construct (Lord & Novick, 1968). To test this assumption, CFAs were performed on the three-factor model in Mplus v. 6.0 (Muthén & Muthén, 2010) using weighted least square mean-and-variance adjusted (WLSMV) χ2 test statistic estimation. Chi-square (χ2) tests of model fit were referred to along with approximate fit indices (AFIs) for determining acceptable model fit. Due to the well-known criticism that the χ2 test is severely sensitive to sample size (Schmitt, 2011), the following criteria of AFIs were consulted on significant results of the χ2 test: root mean square error of approximation (RMSEA) ≤ .06, comparative fit index (CFI) ≥ .95, and weighted root mean square residual (WRMR) ≤ 1.0 (Bentler, 2007; Hu & Bentler, 1999; Yu, 2002).
Samejima’s (1969) graded response model (GRM) was used for the IRT estimates. In the GRM, option characteristic curves (OCCs) are estimated for each response option in an item. The mathematical formula with an item of K = 4 ordered responses options (k = 0, 1, 2, 3) may be written as,
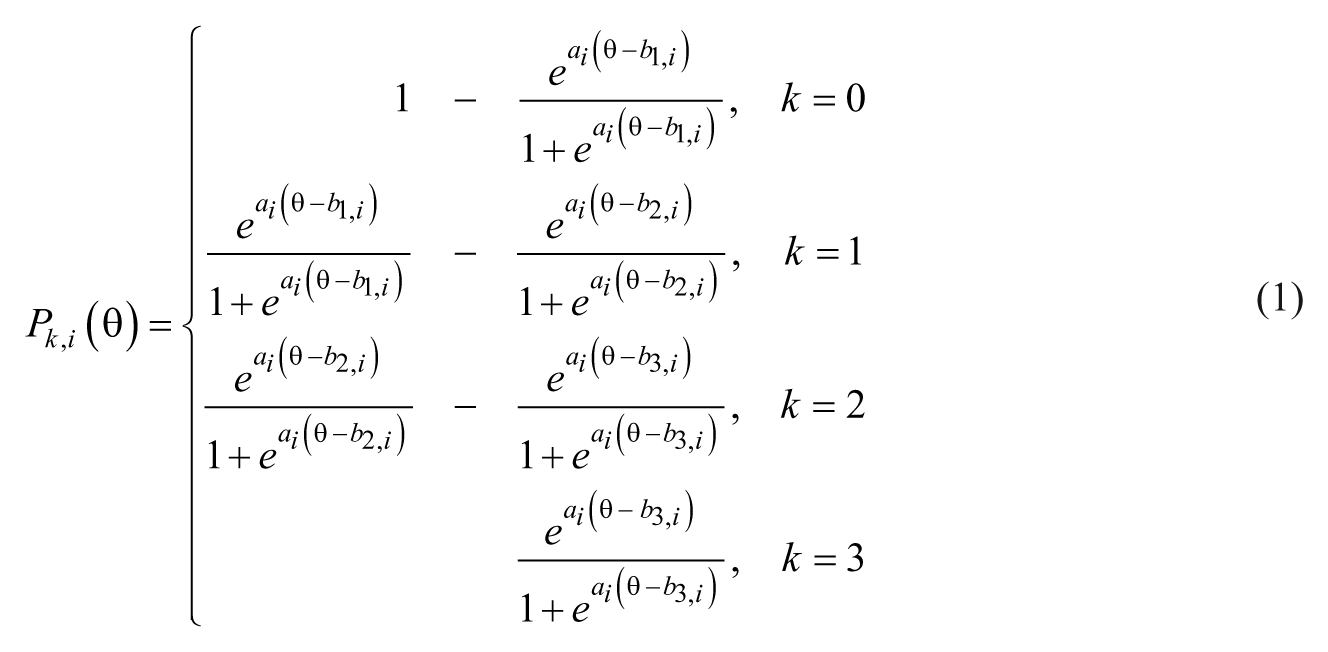
where Pk,i is the probability of a person’s endorsement of response option k for item i, θ is the latent trait, ai is the discrimination parameter for item i, the mathematical constant e is the base of the natural logarithm, and bk,i is the threshold parameter (de Ayala, 2009). The discrimination parameter (a) indicates the degree of slope at each point of inflection. According to Baker (1985, 2001), item discrimination is considered to be very low for a < 0.34, low for 0.35 ≤ a ≤ 0.64, moderate for 0.65 ≤ a ≤ 1.34, high for 1.35 ≤ a ≤ 1.69, and very high for a > 1.70. In the present study, the threshold parameters b1,i and b3,i represent the values of θ where the probability is .5 for endorsing the lowest (k = 0) and highest options (k = 3), respectively, while the modes of the other OCCs (k = 1, 2) are specified as (b1,i + b2,i)/2 and (b2,i + b3,i)/2, respectively. The intersection of any two OCCs otherwise indicates an equal probability of endorsing option k or higher versus endorsing lower order options (de Ayala, 2009). Figure 1 presents a graphical illustration of the OCCs for the MII Item 1 of PV as an example. The probability is .5 for an individual to endorse Option 0 (i.e., not at all like me) when his positive affect for mathematics is 1.43 SDs below population mean, and for Option 3 (i.e., very much like me) when 1.18 SDs above mean. For OCCs of Options 1 (i.e., not much like me) and 2 (i.e., sort of like me), the θ values are (−1.43 + −0.33)/2 = −0.88, where the mode of OCC for Option 1 is present and (−0.33 + 1.18)/2 = 0.43 for Option 2.
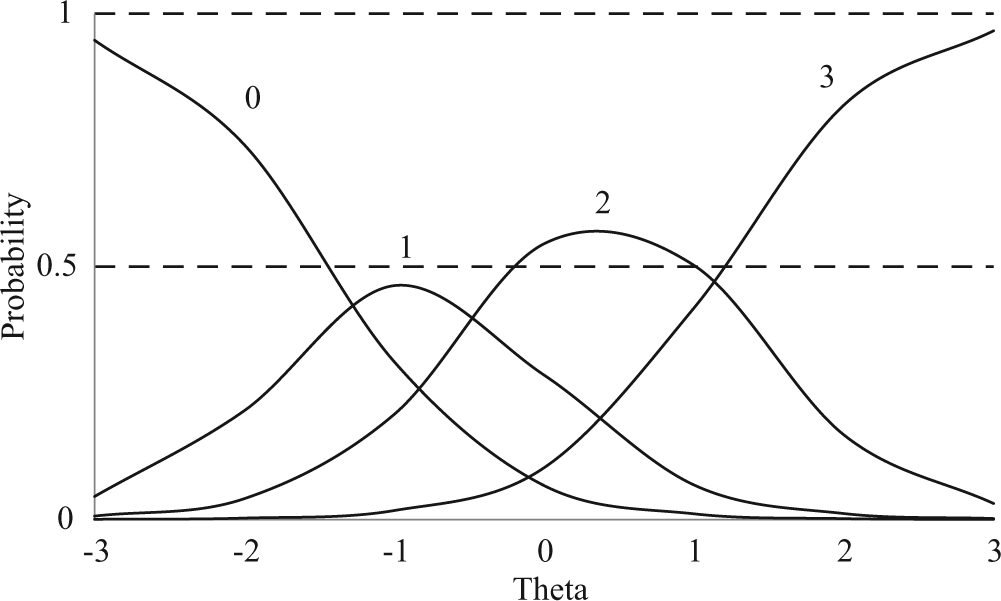
Graded response model option characteristic curves (OCCs) for Item 1 of the Mathematics Interest Inventory with four response options (a1 = 1.84, b1,1 = −1.43, b2,1 = −0.33, b3,1 = 1.18).
A minimum sample size of 500 was recommended by Reise and Yu (1990) to achieve adequate calibration with the GRM, based on their findings of parameter recovery with 25 five-option items. We estimated item parameters by fitting three separate unidimensional GRMs to each of MII subscale in IRTPRO v. 2.1 (Cai, Thissen, & du Toit, 2011). In addition, IRTPRO provides test information function values to represent the total information available for estimation. The test information function is defined for a set of test items (e.g., a subscale) at each point on the continuum of the latent trait, and the amount of information is influenced by the quality and number of test items. The contribution of each item to the total information is addictive and depends on how highly each item correlates with other items in the set (Hambleton & Swaminathan, 1985).
Several approaches, either IRT-based or non-IRT-based, are available for DIF detection (de Ayala, 2009). A major distinction between the non-IRT-based Mantel–Haenszel (M-H) method and IRT-based approaches (e.g., likelihood ratio [TSW-ΔG2]; Thissen, Steinberg, & Wainer [1988, 1993]) is that M-H is nonparametric and based on observed rather than latent conditioning scores. According to Potenza and Dorans (1995), a problem associated with parametric approaches is that DIF detected may be an artifact of model misspecification, while nonparametric methods are relatively free of model misspecification and collinearity problems (see also Bolt, 2002), but require sufficient data. We chose M-H over IRT-based approaches given our relatively large sample size. Further, the M-H procedure also yields effect size indicators which are particularly helpful in interpreting the direction and magnitude of DIF.
The analysis of DIF was performed using DIFAS v. 5.0 (Penfield, 2012). The DIF analysis is normally conducted by comparing a focal group (usually the minority) against a reference group (usually the majority). The M-H chi-square (M-H χ2) procedure was used for detecting DIF in polytomous items (Penfield, 2012) with α = .05. The M-H χ2 statistic is distributed with one degree of freedom, with a higher value of a particular item indicating a higher probability for this item to display DIF (Mantel, 1963). To reduce Type 1 error, we used the Benjamini and Hochberg false discovery rate (BH-FDR; Benjamini & Hochberg, 1995) to adjust each item’s p value of M-H χ2. According to Kim and Oshima (2013), the BH-FDR is the most balanced adjustment in lowering the Type 1 error rate as compared with Bonferroni correction and Holm’s procedure. In terms of effect size of differences, DIFAS v. 5.0 provides L-A Cumulative Common LOR (Liu & Agresti, 1996) and the Cox’s Noncentrality Parameter Estimator (Cox’s B; Camilli & Congdon, 1999) statistics for estimating magnitude and direction of DIF. For both L-A LOR and Cox’s B, positive values indicate DIF in favor of the reference group, while negative values indicate DIF in favor of the focal group (Penfield, 2012). For detecting non-uniform DIF, DIFAS v. 5.0 provides the conditional differences or the difference between the difficulty indices found for each of the groups. The DIF is uniform if the difference values maintain one direction (i.e., positive or negative) across all the difficulty intervals (Padilla, Hidalgo, Benítez, & Gómez-Benito, 2012).
Finally, the impact of DIF at the subscale level was examined by Differential Test Functioning (DTF) analyses. DTF represents the aggregated DIF across the items of a test or subscale and is essentially the variance estimator of item-level DIF effects. Thus, it can provide information concerning the overall impact of DIF effects. With respect to polytomous items, the variance of the generalized DIF effect is denoted by Nu-square (ν2), and considered to be small for ν2 < 0.07, medium for 0.07 ≤ ν2 ≤ 0.14, and large for ν2 > 0.14 (Penfield & Algina, 2006).
Results
To detect the group differences (i.e., boys vs. girls, White vs. Hispanic) as reflected by measures of the MII, a 2 × 2 analysis of variance (ANOVA) was conducted. The ANOVA indicated a significant main effect for ethnicity, F(1, 603) = 3.94, p < .05, partial η2 = .006, but no significant main effect for gender, F(1, 603) = 0.15, p = .70, partial η2 < .001, or interaction between ethnicity and gender, F(1, 603) = 1.98, p = .16, partial η2 = .003. As assessed by the MII, Hispanic students demonstrated significantly higher mathematics interest (M = 64.88, SD = 15.69) than White students (M = 62.21, SD = 18.03) across gender, while no significant difference was found between boys (M = 63.33, SD = 16.56) and girls (M = 63.85, SD = 17.23) across ethnic groups.
Unidimensionality
The reliabilities of the three MII subscales were assessed for internal consistency as both Cronbach’s alpha (α) and Raykov’s rho (ρ). The results appeared identical across α and ρ, and indicated good internal consistencies: PV = .93, NV = .87, and Time = .73. In addition, internal consistencies were also shown to be similar within each pair of comparison groups for subsequent DIF analyses: PV = .93 (female), .92 (male), .92 (Hispanic), and .94 (White); NV = .88 (female), .86 (male), .86 (Hispanic), and .88 (White); Time = .74 (female), .71 (male), .72 (Hispanic), and .74 (White).
The three-factor CFA model did not appear to fit the data well, χ2(321) = 2428.13, p < .0001, CFI = 0.90, RMSEA = 0.10, WRMR = 2.19. To further examine the factor structure, we consulted the modification indices (MIs; Sörbom, 1989) and identified one item as having a substantial cross loading, producing Δχ2 = 779.8. Removing this item would have improved the model to fit the data marginally well, χ2(296) = 1619.24, p < .0001, CFI = 0.93, RMSEA = 0.08, WRMR = 1.79. The decision was made to retain this item for the IRT analysis because (a) the MII has been cross-validated to multiple samples in its validation study and results consistently supported the three-factor simple structure (Stevens & Olivárez, 2005); (b) Hu and Bentler’s (1999) combinational rules are considered too stringent and more appropriate when evaluating statistical significance rather than goodness of model fit (Marsh, Hau, & Wen, 2004). Factor loadings (λ) of the CFA are summarized in Table 2. In terms of inter-factor correlations, PV was shown to have a positive correlation of .70 (p < .001) with NV and a positive correlation of .84 (p < .001) with Time, while NV positively correlated with Time at .61 (p < .001).
IRT Parameter Estimates (a, b1, b2, b3) and DIF Results by Subscale and Item.
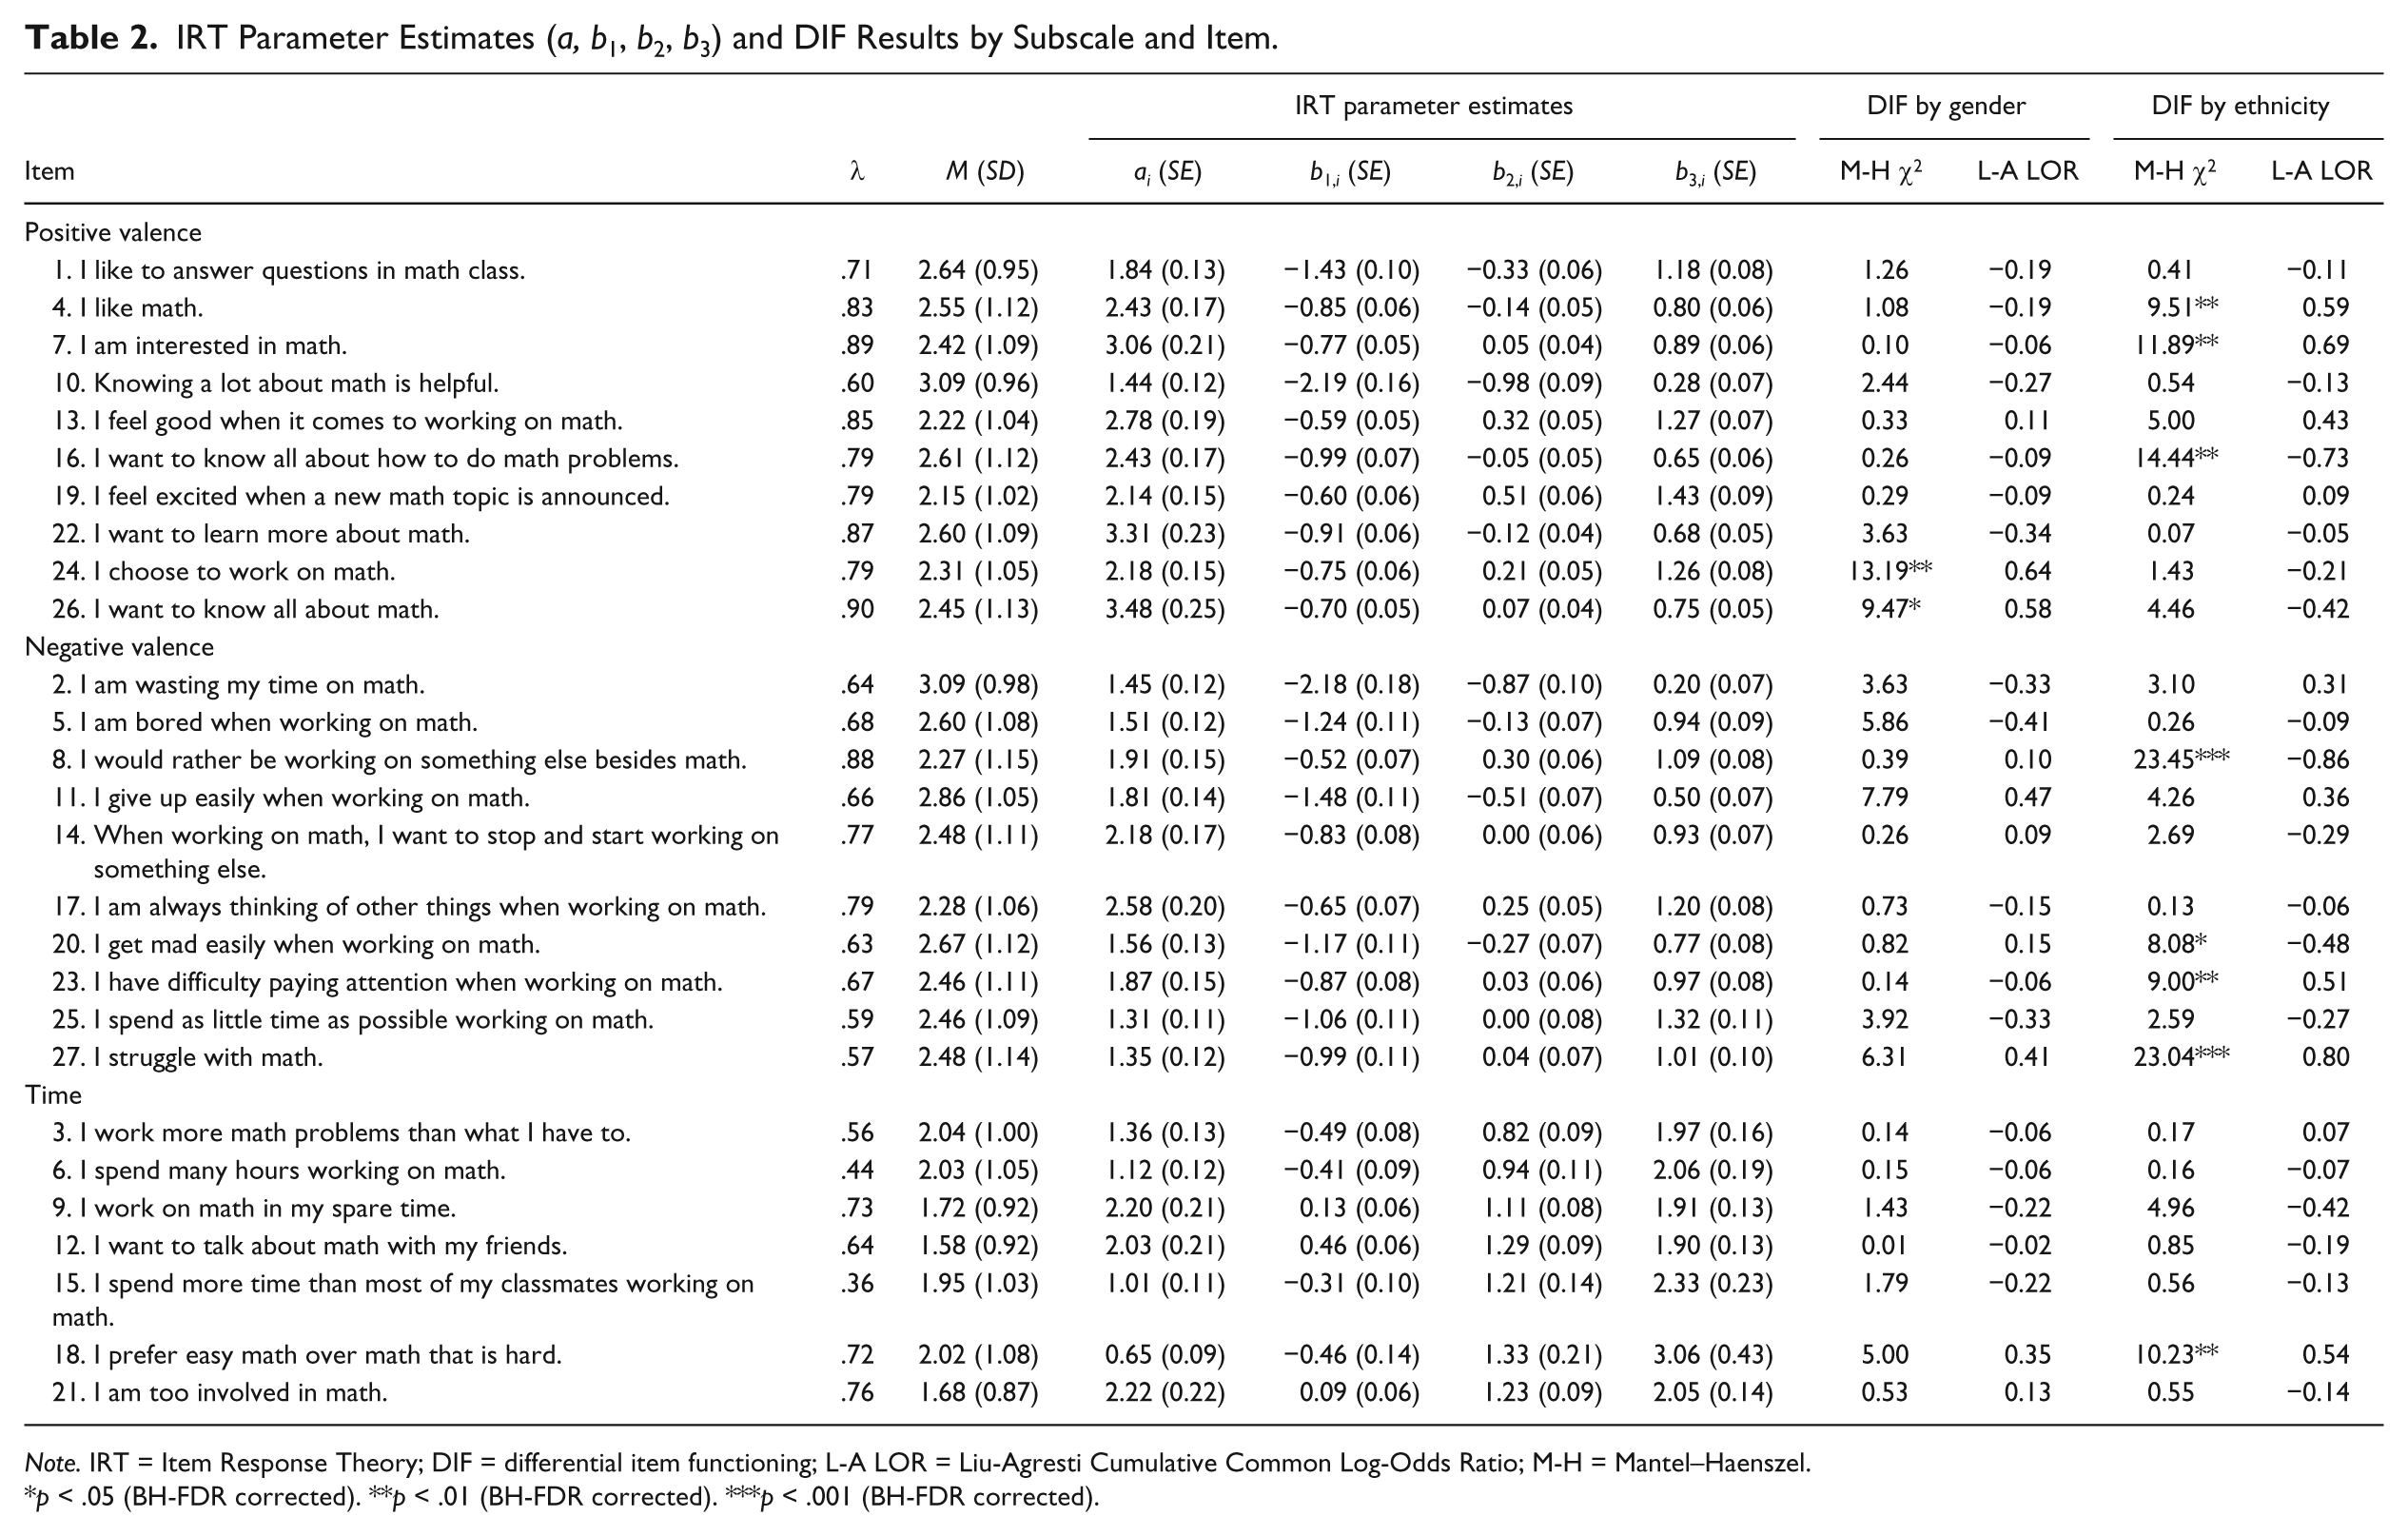
Note. IRT = Item Response Theory; DIF = differential item functioning; L-A LOR = Liu-Agresti Cumulative Common Log-Odds Ratio; M-H = Mantel–Haenszel.
p < .05 (BH-FDR corrected). **p < .01 (BH-FDR corrected). ***p < .001 (BH-FDR corrected).
Item Response Theory Analyses
Table 2 summarizes the descriptive statistics and IRT parameter estimates for the items. Based on Baker’s (1985, 2001) guidelines, 17 items (63%) demonstrated very high discrimination, 6 items (22%) high discrimination, and 4 items (15%) moderate discrimination.
For PV, the average item thresholds were −0.98 for b1 (SD = 0.50), −0.05 for b2 (SD = 0.41), and 0.92 for b3 (SD = 0.36). Item 10 demonstrated the lowest thresholds of the set (b1,10 = −2.19, b2,10 = −0.98, b3,10 = 0.28), indicating that very low levels of positive affect were necessary for a student to endorse lower response options (i.e., lowest through k − 1) for the statement “knowing a lot about math is helpful,” versus endorse option k and higher. In contrast, Item 19 demonstrated the highest thresholds in the subscale (b1,13 = −0.60, b2,13 = 0.51, b3,13 = 1.43), indicating that very high levels of positive affect were necessary for a student to endorse response lower order options for the statement “I feel good when it comes to working on math,” versus endorse response option k and higher. Overall, the item thresholds of PV ranged from −2.19 to 1.43, suggesting a sufficient distribution of item responses according to threshold.
For NV, the average item thresholds were −1.10 for b1 (SD = 0.47), −0.12 for b2 (SD = 0.35), and 0.89 for b3 (SD = 0.33). These results seemed to suggest that the average thresholds of negative affect for mathematics required to endorse response option k and higher rather than lower order options were lower than the ones for positive affect. In other words, it was easier for respondents to endorse higher-order response options for NV items as compared with PV items. Item 2, “I am wasting my time on math,” appeared to be of the lowest thresholds of the set (b1,2 = −2.18, b2,2 = −0.87, b3,2 = 0.20), whereas Item 8 “I would rather be working on something else besides math” and Item 25 “I spend as little time as possible working on math” (b1,8 = −0.52, b2,8 = 0.30, b3,25 = 1.32) demonstrated the highest thresholds. Overall, the item thresholds of NV ranged from −2.18 to 1.32, also suggesting a sufficient distribution of item responses according to threshold.
For Time, the average item thresholds were much higher: −0.14 for b1 (SD = 0.37), 1.13 for b2 (SD = 0.19), and 2.18 for b3 (SD = 0.41). These results indicated that this subscale might not have a sufficient distribution, particularly for thresholds below the mean (i.e., θ < 0). Item 12, “I want to talk about math with my friends,” showed the highest threshold in the subscale for k = 0 (b1,12 = 0.46) as well as the lowest threshold for k = 2 (b3,12 = 1.90). As such, Item 12 appeared to be an example of limited distribution. Overall, the item thresholds of time ranged from −0.49 to 3.06, suggesting that this subscale may underestimate the time and effort respondents spent on mathematics.
Figure 2 illustrates the test information curves across the subscales. As indicated by the area under the curve, the PV items altogether provided the most information for measurement of children’s positive affect for mathematics, while the Time items altogether provided the least information of measurement of time and effort invested on mathematics. For PV, the maximum of the total information is about 19.76 at θ = 0, with very close values between θ = −0.8 (18.56) and θ = 0.8 (18.57). In comparison, the NV curve contains less information that the maximum of the total information is about 10.58 also at θ = 0. This reflects a larger mean of the item discrimination (a) parameter of the PV items because the maximum total information value is directly proportional to the square of a (Hambleton & Swaminathan, 1985). Thus, Time appears to be particularly weak for estimating a respondent’s latent trait for θ < 0 because the test information function curve appears asymmetric and contains limited information in the lower half of the continuum of θ.

Test information functions for three subscales of the Mathematics Interest Inventory.
Differential Item Functioning
Results of DIF analyses are summarized in Table 2. We first examined the DIF of the MII subscales across gender specifying male as the reference group and female as the focal group. Only two PV items demonstrated significant DIF: Item 24 (M-H χ2 = 13.19, BH-FDR corrected p = .002) and Item 26 (p = .01). Both items showed DIF in favor of the reference group (i.e., male) given positive L-A LOR values. That is, even given the same level of positive affect for math, male students were more likely than female students to endorse higher-order options (e.g., sort of like me rather than not much like me) of the statements “I choose to work on math” and “I want to know all about math.” As indicated by the conditional differences by difficulty intervals, neither item was found to show non-uniform DIF. The DTF effect variance of the PV subscale was small, ν2 = .07. No significant DIF across gender was found in NV or Time. Thus, the amount of DIF by each item for gender may be considered minimal. This result indicates that although there may be overall differences in mathematics interest according to gender, these differences are likely not due to substantially different interpretations of mathematics interest items by gender.
Next, DIF was computed between White students as the reference group and Hispanic as the focal group. For PV, three items showed significant DIF: Item 16 (p = .001), Item 7 (p = .003), and Item 4 (p = .007). Item 16, “I want to know all about how to do math problems,” was more readily endorsed by Hispanic students (L-A LOR = −.73), while Item 7, “I am interested in math,” and Item 4, “I like math,” were more readily endorsed by White students (L-A LOR = .69 and .59, respectively). The DTF effect variance of PV was large, ν2 = .15. For NV, four items showed significant DIF: Item 8 (p < .001), Item 27 (p < .001), Item 23 (p = .009), and Item 20 (p = .011). Item 27, “I struggle with math,” and Item 23, “I have difficulty paying attention when working on math,” were more readily endorsed by White students (L-A LOR = .80 and .51, respectively), while Item 8, “I would rather be working on something else besides math,” and Item 20, “I get mad easily when working on math,” were more readily endorsed by Hispanic students (L-A LOR = −.86 and −.48, respectively). The DIF of all these items across ethnicity was found to be uniform. The DTF effect variance of NV was large, ν2 = .20. Finally, only one item of Time (Item 18, “I prefer easy math over math that is hard”) demonstrated significant DIF (p < .001) and the DTF was small, ν2 = .04.
Thus, there appears to be a substantial amount of variation in the interpretation of mathematics interest items according to group membership. Results indicated that, in terms of positive affect toward mathematics, students who identified as White appeared to more readily endorse items with more direct, affective statements such as, “I like math” and “I’m interested in math,” while students who identified as Hispanic tended to endorse higher options on a less direct, more goal-oriented and non-affective statement: “I want to know all about how to do math problems.” When it came to negative affect, however, Hispanic students were more likely to endorse higher options on affective statements, “I would rather be working on something else besides math” and “I get mad easily when working on math,” yet less likely than their White peers to do so.
Discussion
The current study provides an examination of mathematics interest according to both gender and ethnicity, specifically students who self-reported to be White or Hispanic. Results indicate that the presence of differences in mathematics interest according to gender may not be considered a function of measurement error or a lack of psychometrically sound items as the presence of differential item functioning was minimal (e.g., 20%, only 2 out of 10 PV subscale items). Teresi (2006) has indicated when less than 25% of items present DIF that this may be considered as minimal. From the results of the current study, we conclude that in examining differences in mathematics interest according to gender, MII scores may be considered as psychometrically sufficient with respect to its IRT properties. Thus, the results of the current study support previous research indicating the reliability and validity of the MII scores as evaluated by classical psychometric procedures (Stevens & Olivárez, 2005).
With respect to differences in mathematics interest between White and Hispanic students, the presence of DIF was more substantial in terms of both number of items and effect size. Approximately 30% of the PV items (e.g., Items 4, 7, and 16) and 40% of the NV items (e.g., Items 20, 23, 23, and 27) indicated the presence of significant DIF. The associated effect sizes with these items presenting DIF ranged from moderate to large (Penfield, 2007). Results indicated a pattern of response according to the indirect or direct nature of the items. Thus, the MII may have difficulty capturing mathematics interest between White and Hispanic students due to these differential response patterns according to the nature of the item as being affective versus non-affective regarding the positive and negative valence, respectively, of mathematics interest.
Although our observation is preliminary and certainly requires further exploration, cultural differences in how people experience, regulate, and express emotions are well-documented in the literature (e.g., Goetz, Spencer-Rodgers, & Peng, 2008; Scollon, Diener, Oishi, & Biswas-Diener, 2004, 2005). Thus, the translation of the role of affect in the expression of mathematics interests is not unsurprising. The mechanism behind this differential response to direct versus indirect items regarding mathematics interest would appear to be multi-faceted but may be the result of cultural differences and the associated social desirability to fit in with the culture and its subsequent values with which one identifies (Lange, Thalbourne, Houran, & Lester, 2002; Scott et al., 2007; van de Vijver & Phalet, 2004). As such, this DIF result may indicate that more direct, affective approaches to fostering mathematics interest may be more effective for students who are White while indirect approaches to identifying mathematics interest may be more effective with students who are Hispanic. For instance, results suggest that teachers directly asking, “Do you like math?” may work well in identifying mathematics interest among students who are White but not as well with students who are Hispanic. As a result of this direct, affective approach, students who are Hispanic may not be steered toward more advanced mathematics as teachers and other school personnel would consider them as lacking sufficient interest in it. Instead, students who are Hispanic may respond better to more indirect, goal-oriented approaches to discerning mathematics interest, such as by asking, “Do you want to know how to do this math problem?”
Future use of the MII must be cautioned about the presence of DIF in particular items. If any modification or adaptation is to be applied, Hambleton’s (2006) recommendations may be consulted to avoid potential causes of DIF such as complicated language, multiple ideas in individual statements (i.e., double-barrier), concepts and situations that do not easily translate to other cultures, and stereotyping. Our findings regarding the direct versus indirect/affective versus non-affective approaches may be referred to for modification purpose as well. However, users of the current MII version should not arbitrarily omit items that demonstrated DIF, because this may result in artificially higher or lower scores in a certain subgroup especially when the magnitude of DIF tends to cancel (i.e., some items favor the reference group while others favor the focal group; see Edelen, Thissen, Teresi, Kleinman, & Ocepek-Welikson, 2006). Given that this is exactly the case for DIF in the MII subscales, we recommend users retain all items for scale scores, but take into account the observed DIF when making comparisons at the item level.
Several limitations emerged as part of conducting the current study, which provide directions for future research. For instance, the MII should be examined as to its age neutrality in that the expression of mathematics interest may vary as a function of age. Insufficient sample size across age groups precluded this analysis as the examination of differential item functioning typically requires large sample sizes per group (e.g., approximately 250 or more for each group; Herrera & Gomez, 2008; Rogers & Swaminathan, 1993; Swaminathan & Rogers, 1990). Relatedly, future research examining DIF across race/ethnicity needs to collect detailed demographic information about the sample particularly with regard to their cultural and language background (e.g., which generation of immigrants, first and second languages, English proficiency), because such information would allow for investigations of the causes of DIF (Church, 2001; Ramirez et al., 2006). Lack of these pieces of information in the current study prevents us from conducting more in-depth investigations.
In conclusion, the IRT-based evaluation of the MII provides several implications for the development and use of self-report instruments to measure mathematics interest. By consulting the discrimination and threshold parameters, researchers may gain better understandings about the quality of individual items. Furthermore, the test information functions reflect how respondents interact with the instrument at the subscale level. For example, respondents tend to underrepresent their mathematics interest for the Time subscale in the MII, suggesting that children may conceptualize time in a way other than what is assumed. Most importantly, the DIF results may provide valuable information as to how items may be adapted for relatively unbiased measurement when multiple ethnic groups are included, as well as account for the variance in group differences that are due to measurement error.
Footnotes
Declaration of Conflicting Interests
The author(s) declared no potential conflicts of interest with respect to the research, authorship, and/or publication of this article.
Funding
The author(s) received no financial support for the research, authorship, and/or publication of this article.