
Abstract
The purpose of the present study was to extend the model of measurement invariance by simultaneously estimating invariance across multiple populations in the dichotomous instrument case using multi-group confirmatory factor analytic and multiple indicator multiple causes (MIMIC) methodologies. Using the Arabic version of the General Aptitude Test (GAT), invariance was tested at the configural, metric, and scalar levels. Results indicated that the hybrid model that incorporates both the multi-group case and the MIMIC model provide a viable alternative to the measurement of invariance between variables when they interact. Metric and scalar invariance were supported for all of GAT’s subscales with the exception of Word Meaning for which lack of invariance was likely caused by model misspecification. Subtle effects were observed in favor of public school testees, but they did not exceed significance levels.
Bias due to population characteristics may be one of the most imminent threats in test validity as its absence requires the costly evaluation and modification of an existing instrument across various populations. Thus, the importance of evaluating procedures to derive the proper conclusions is imperative. This is particularly more important for the measurement of achievement for which the immediate consequences may be opportunities for promotion, graduation, and work advancement, with the associated benefits of increased salary, prestige, and so on (Randall & Engelhard, 2010). Furthermore, erroneous measurement of ability may be associated with school failure, segregation, stigma, special placement (as in the case of special populations), and even the development of psychopathological tendencies (Cole & Zieky, 2001).
It is for this reason that the establishment of concepts like measurement invariance (MI) represents a theoretical development of great importance in measurement bias. Measurement invariance concerns how the items measure the latent construct across groups (Cheung & Rensvold, 2002). Measurement invariance is determined to exist between groups if the trait scores between the groups are comparable and have the same meaning across them. Statistically, this means that the mathematical function that relates latent variables to the observations (i.e., items) must be the same in each of the groups involved in the comparison. Measurement invariance is a prerequisite before any group comparison; in its absence the presence of measurement bias will likely confound true between groups differences on point estimates.
The purpose of the present study is to extend knowledge on measurement invariance by proposing a hybrid model for simultaneously evaluating the biased propensities of more than one population using multi-group confirmatory factor analytic (multi-group CFA) methodologies combined with multiple indicator multiple causes (MIMIC) models. This methodology may be particularly more useful when evaluating interactions between variables that define various populations, or interactions between factors that define populations and time, or other non-linear relationships between latent variables (e.g., quadratic latent factor effects; see Marsh, Nagengast, & Morin, 2013). The proposed hybrid model is tested using a subscale from the Arabic version of the General Aptitude Test (GAT) for which evaluations at the state level regarding scholastic aptitude are made. Below there is a description of measurement invariance followed by a brief account of CFA and MIMIC methodologies with an application with real student data.
Measurement Invariance
To examine measurement invariance across different groups, successive multi-group CFAs have to be conducted (Joreskog, 1973). Measurement invariance concerns the extent to which the psychometric properties of the observed indicators are transportable (generalizable) across groups or over time/condition. In other words, whether we are measuring the same construct, in the same way, in different groups or over time/condition (Vandenberg & Lance, 2000). There are three major forms of measurement invariance, namely, configural, metric, and scalar invariance (Joreskog, 1973), which are described next (see also Figures 1 to 3).
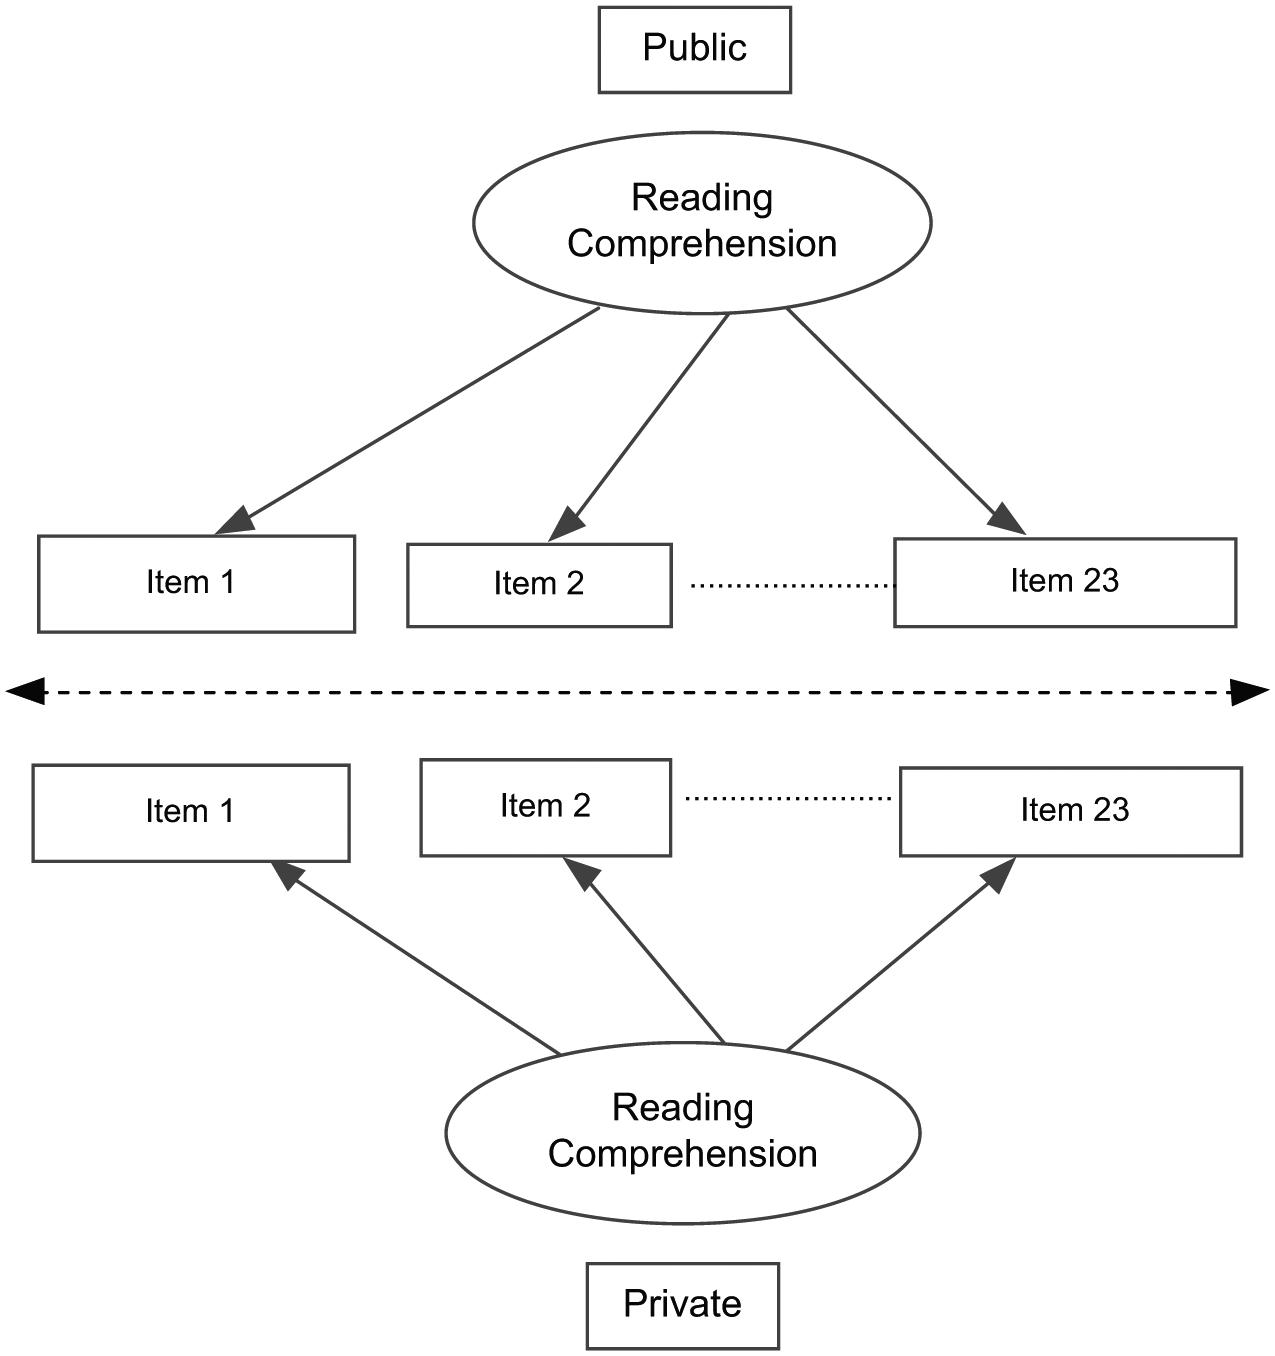
Configural invariance of the Reading Comprehension subscale.

Metric invariance of the Reading Comprehension subscale which involves the equivalence of factor loadings.

Scalar invariance of the Reading Comprehension subscale which involves both the equivalence of factor loadings and item intercepts.
Configural invariance is satisfied when after fitting separate CFA models for each sample (see Figure 1), model fit is acceptable for all samples. Evidence in favor of configural invariance is provided when the samples are associated with exactly the same simple structures. The main thesis of configural invariance is that the participants in different populations conceptualize the latent construct in identical ways (Joreskog, 1973). This model is tested if we leave the factor loadings, item intercepts, and residual variances to vary freely but still maintain the same simple structure, with no constraints. Figure 1 displays the unidimensional structure of reading comprehension that is simultaneously fit to two populations, students who attend public schools and students who attend private schools.
Metric invariance tests whether different groups respond to the items the same way. Metric invariance presupposes the presence of configural invariance because in the absence of the same simple structure between two populations, further comparisons of any kind are meaningless. Metric invariance sets an equivalent factor pattern (as in configural invariance), but further adds the condition of equivalent factor loadings on two or more groups (see Figure 2). Lack of evidence of metric invariance is indicative of items that operate and function differently in one population compared with another (or others). Lack of metric invariance seriously puts into question the similarity in which two populations conceptualize a specific construct(s).
A third level of invariance is necessary if one is interested in examining mean differences in the underlying constructs across groups. This level of invariance, termed scalar invariance, implies that the meaning of the construct (the factor loadings), and the starting levels of the underlying items (intercepts) are equal in both groups. Scalar invariance guarantees that cross-group differences in the means of the observed items are a result of differences in the means of their corresponding constructs. To assess scalar invariance, one constrains the intercepts of the underlying items to be equal across groups (Figure 3), in addition to the equivalence of slopes and the presumed equivalent simple structure. It is supported if model fit cannot be improved by releasing some or any of the equality constraints imposed by the scalar model.
The Importance to Account for Both Metric and Scalar Invariance With Dichotomous Instruments
To test measurement invariance in the case of dichotomous data, there are two equivalent methods put forth (Makransky & Bilenberg, 2014; Reise, Widaman, & Pugh, 1993): (a) multi-group CFA approach, and, (b) the Item Response Theory (IRT) approach. It is interesting to note that the factor loadings (slopes) and item intercepts (thresholds) in CFA are equivalent to item discrimination and item difficulty indices in IRT. 1 Thus, a one-factor CFA model is equivalent to a two-parameter IRT model, in which the implicit assumption of invariance of means and slopes is tested. Similarly, the differential item functioning (DIF) concept (i.e., which indicates whether one group of respondents is scoring better than another group of respondents on an item or a test, after adjusting for the overall ability scores of the respondents) is analogous to violations of factorial invariance in a multi-group CFA.
Using CFA, however, one is able to test invariance in more complex structures and across more restrictive models (Marsh et al., 2013, proposed 13 such models). The present authors suggest that metric and scalar invariance in combination are imperative to understand how an instrument functions in two populations. Metric invariance may be an insufficient condition in the case of dichotomous instruments and both metric and scalar need to be satisfied to fully understand the behavior of the items (Raykov, Marcoulides, & Li, 2012). This is in accordance with the recommendations of L. K. Muthén and Muthén (2007) who suggested that because the item characteristic curve (ICC) of an item is influenced by both the intercept (location) and the slope (factor loading), one should test both simultaneously. For example, in the comparison between students with learning disabilities (LD) and typical student groups, one may observe that a measure of decoding ability comprised of 10 items may have 5 items that favor typical students and five favoring students with LD. If that is the case, then there is no basis for meaningful comparisons between constructs because constructs are conceptualized differently in terms of level as well as their relative loading with the factor. In fact, in the case of observed differences, the direction of difference could not be ascertained (given the unknown ways in which item level differences contribute to the measurement of the latent construct). Figure 4 (upper panel) displays ICCs for the Word Meaning subscale using a Saudi Arabia sample (upper panel) and a sample from Bahrain (lower panel) after fitting a 2-Parameter IRT model. Through inspecting the figure, it is apparent that although location parameters were very close to each other (and had statistically justified equivalence), factor loadings were not. For example, the 50% probability of success for item Y1 was associated with an ability level of approximately –.75 logits for both groups. Thus, scalar invariance with dichotomous instruments is extremely important as it shows differences in item difficulties between groups, which represents a significant form of bias when comparing different populations. Both metric and scalar invariance are prerequisite conditions to conducting any meaningful group comparisons.
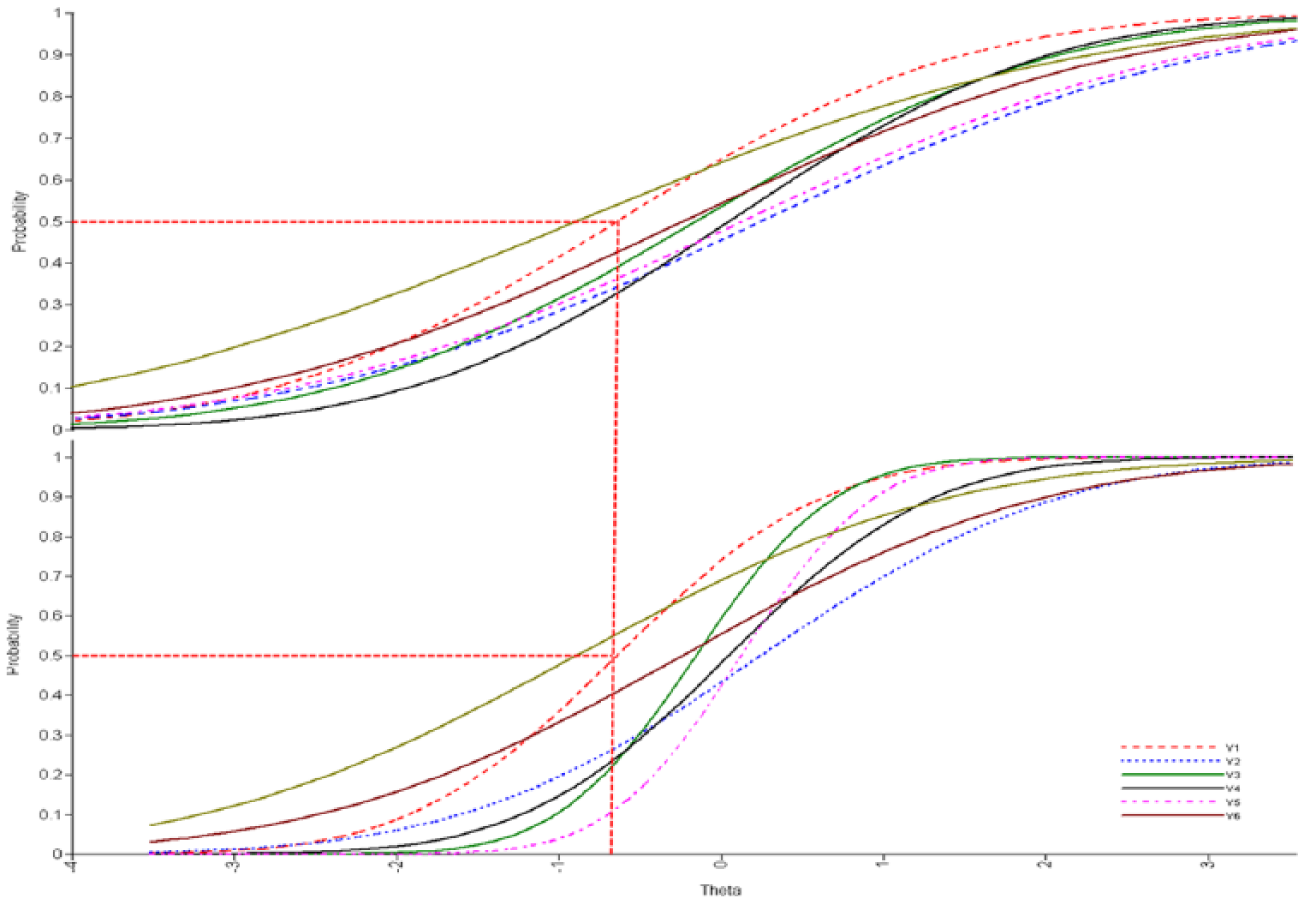
Item characteristic curves (ICCs) for the Word Meaning subscale using the Saudi Arabia (upper panel) and Bahrain (lower panel) samples.
Measurement Invariance: The Multi-Group CFA Approach
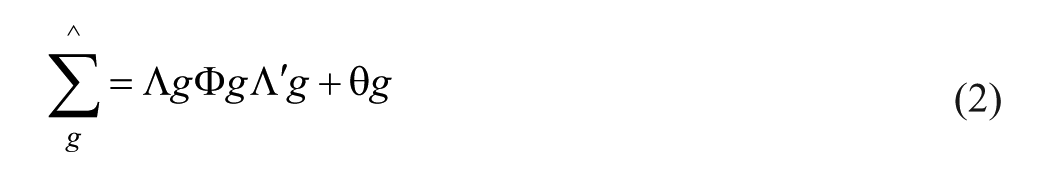
In CFA with dichotomous data, the observed responses x on an item are modeled as a non-linear function of the latent variable ξ an intercept/threshold term τ and an error term δ. The factor loadings Λ show the amount of change in the latent construct as a function of one unit of change in the x measured variable. Based on B. Muthén and Christofferson (1981), this model is described by the following equation:

With Xg being the vector of observed scores, τ g being the vector of item intercepts, Λ g being the matrix of factor loadings, ξg being the vector of factor scores, and, δg being the vector of error scores for each of groups g. From this representation, a covariance matrix is estimated for each group:
So,
Measurement Invariance: The MIMIC Approach
For simplicity reasons and because the MIMIC model involves a measured variable that defines group membership, a single item causal indicator is used to describe the model. Thus, in the MIMIC model approach with dichotomous indicators, each individual’s i observed score Y on item j is a function of its factor loading λ on latent factor η with inclusion of the relevant error term ϵ, as shown below (see Kim, Yoon, & Lee, 2012):

In the multiple-group case then, a categorical dummy variable X is linked through the coefficient γ to the latent factor η as shown below:

Thus, to test measurement invariance, a dummy categorical variable is introduced as a predictor of the latent variable η, plus the residual term ζi of that latent factor (disturbance term). The model with this direct path can be written as follows:


which implies that the grouping variable X exerts an effect on both the factor loadings λ (Equation 5) through the β coefficients and the latent mean γ (Equation 6) of latent variable η. An example of a MIMIC model is shown in Figure 5 in which a grouping variable (region) has direct effects on the items slopes (γ1-γ23) and the latent mean β1 as well.

Multiple indicator multiple causes model for testing the invariance between factor loadings (estimates γ1 through γ23 on item slopes λ1 through λ23), and the latent factor mean β1 with an error term ζ as a function of a grouping variable (region of residence).
The Need to Account for Multiple Population Invariance: Combinations Between Multi-Group CFA and MIMIC Approaches
When two levels of two factors (e.g., of gender and two age groups) behave differently on an instrument, then a psychometric analysis of aggregated populations (both age groups combined or ignoring for gender) provides an incomplete story of the actual properties of an instrument’s invariance. In fact, such a psychometric model fails to describe any of the populations of interest. The ability to extend measurement invariance to account for the simultaneous evaluation of multiple populations will prove to be very useful in such instances and others for which non-linearity is likely operative (i.e., when modeling interaction effects). Other interactions may involve combinations of continuous and categorical variables, for example, comparing regionally different groups on scholastic achievement, accounting for their levels of IQ, individual difference variables, or even an effort to account and correct for sources of systematic measurement error. Such complex models can only be estimated using combinations of multi-group CFA and MIMIC methodologies (Marsh et al., 2013) as two independent variables (e.g., gender and urbanicity) may have overlapping participants. Thus, models that allow for cross-classified effects are imperative. Figure 6 displays a proposed hybrid model that allows evaluation of the interactions between levels of two independent variables that describe various populations (school type and region). At its basic form, it is a multi-group factor model, so one of the grouping variables is accommodated within the simultaneous analysis of two or more variance-covariance matrices (in the present example the multi-group CFA involves public vs. private schools). By adding a MIMIC structure to the multi-group CFA model (i.e., the effects of region), one accommodates the second population and potentially the likelihood that two independent variables interact with each other. Thus, for each level of the first population (in the multi-group framework), a MIMIC structure is added to extend invariance on each level of the second independent variable. The MIMIC model is accommodated with the independent variable “Region” which exerts direct effects (G1-G23) on the items’ slopes (L1-L23) and the factor means (B1-B2) for each level of the first independent variable (i.e., public and private schools).The model can accommodate any number of levels of each factor, assuming sample size requirements, power, and corrections for Type 1 errors.
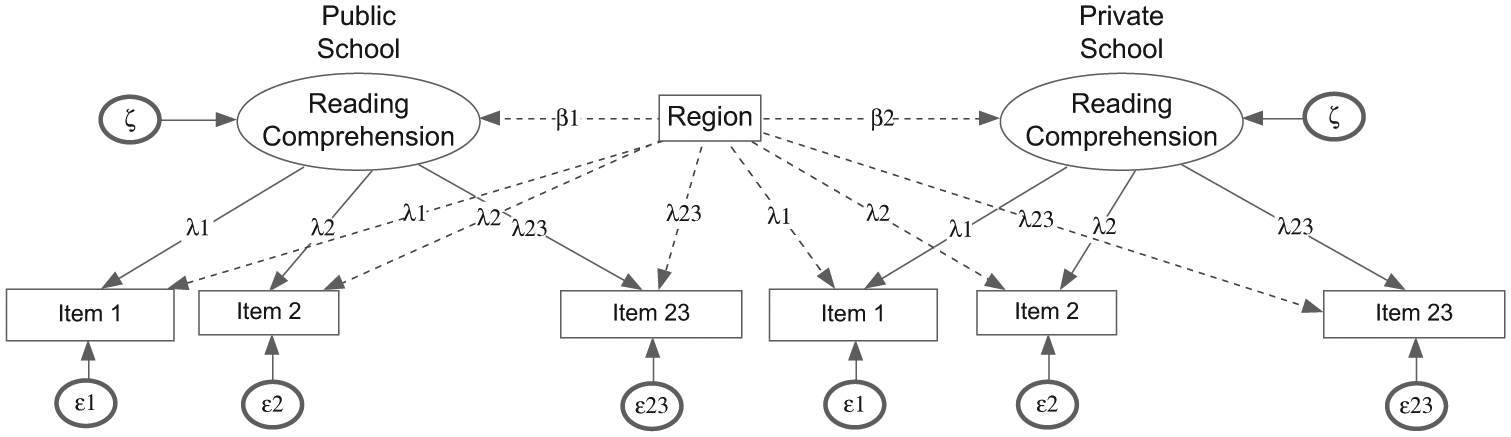
Hybrid confirmatory factor analysis model for the simultaneous estimation of invariance across multiple populations (both type of school and region of residence).
Purpose and Importance of Present Study
The purpose of this study was to extend the model of measurement invariance by suggesting a hybrid CFA model that combined multi-group and MIMIC methodologies for simultaneously evaluating invariance in several populations. It is unfortunate that most of psychological research involves between-groups comparisons with the implicit assumption (rarely tested) that the constructs are measured in similar terms across populations. Unless, however, invariance is present at least at the factor loading level, all subsequent between-groups comparisons may likely be suspect and invalid. The proposed methodology was intended to introduce a substantive synergy so that combined effects of multiple populations can be addressed. What follows is an application of the current hybrid model to the Reading subscale of the GAT, a standardized assessment battery used in entrance to the university in Saudi Arabia.
Method
Participants
A total of 29,120 individuals participated in this study (males = 2,974 [10.2%]; females = 26,146 [89.8%]). The majority of the participants 28,722 (98.65%) came from Saudi Arabia and 398 (~1.35%) from Bahrain. With regard to type of school, 25,972 (89.2%) were studying in public schools and 3,148 (10.8%) in private schools. With regard to the region of residence, 22,103 (75.9%) were residing in rural areas and 7,017 (24.1%) in urban areas.
Measure
GAT for art major
The measure involved the GAT for Art Major developed by the National Center for Assessment. It is a general cognitive ability test developed in Arabic, which measures two different cognitive areas: (a) verbal and (b) numerical. The test contains 95 dichotomous items (right-wrong) and measures seven different cognitive skills: (i) Word Meaning, (ii) Sentence Completion, (iii) Analogy, (iv) Reading Comprehension, (v) Arithmetic, (vi) Analysis, and (vii) Geometry. The first four subscales measure verbal ability and the remaining numerical ability. For the purposes of the present study, only the Reading Comprehension subscale was utilized in the invariance models with the example in Figure 4 involving the Word Meaning subscale. Several previous studies have supported the presence of reliability and validity with various populations (Alharbi, in press; Alqataee & Alharbi, 2012).
Data Analysis
Confirmatory Factor Analysis
Each of GAT’s subscales was evaluated by initially fitting a multi-group CFA model using the mean and variance-adjusted weighted least squares (WLSMV) method of estimation in Mplus (L. K. Muthén & Muthén, 2007). Model fit was evaluated by fitting the data to a tetrachoric matrix using the probit link function. In comparing the fit of hypothesized models, chi-square tests and goodness-of-fit indices were utilized. The chi-square test as a measure of global model fit (Cochran, 1952) is hypersensitive to sample size, as it rejects reasonable models whenever sample sizes are large and it fails to reject poor models whenever sample sizes are small (MacCallum, Browne, & Sugawara, 1996). Furthermore, it is well known that the chi-square test is an inherently flawed mechanism for addressing model fit, especially in terms of comparing the observed chi-square statistic to a chi-square distribution because this test is not robust to violations of the distributional assumptions and because the distribution itself provides only asymptotically correct p values (i.e., the p value approaches its correct value as the sample size becomes infinitely large). Consequently, we involved fit indices in our evaluation of model fit as model fit is a multifaceted concept and no single fit index fully captures model evaluation (Tanaka, 1993). Particularly, we reported two fit indexes that showed good performance in a simulation study by Hu and Bentler (1998). The root mean squared error of approximation (RMSEA) is a measure of the estimated discrepancy between the population and model-implied population covariance matrices per degree of freedom. RMSEA values up to .08 indicate a reasonable fit to the data, while values up to .05 indicate excellent fit (Hu & Bentler, 1999). The Comparative Fit Index (CFI) ranges from 0 (poor fit) to 1.00 (perfect fit) and is derived from a comparison of a restricted model (one in which structure is imposed on the data) with a null model (one in which all pairs of observed variables are assumed to be mutually uncorrelated). CFI values greater than .90 indicate an acceptable fit (with values > .95 being ideal; Hu & Bentler, 1999).
Traditionally, the chi-square test is used to compare nested models, but as mentioned above, this statistic is sensitive to sample size. Thus, we decided to use an additional criterion to assess for evidence of invariance; particularly, we used the ΔCFI. A CFI decrease of ≥.01 was considered indicative of a significant decrement in model fit and lack of invariance across groups (Cheung & Rensvold, 2002). It should also be noted at this point that a power analysis estimation and a simulation were employed to ensure that excessive power was not present to produce spurious effects (see next section on power and sample size estimation).
In the context of testing measurement invariance, a series of hierarchically nested models are tested. Initially, a multi-group CFA model was fit to the data to assess configural invariance. Factor variances and means were fixed to 1 and 0, respectively, for identification purposes. All residual variances were constrained to 1 as they are not uniquely identified in the configural model but all factor loadings and thresholds were freely estimated. Subsequently, the metric invariance model constrained factor loadings to be equivalent between groups, but the thresholds were allowed to vary across groups. Decrease of model fit was tested using the Difftest 2 procedure as the chi-square difference test is not appropriate under the WLSMV estimation procedure (L. K. Muthén & Muthén, 2007). 3
The last model involved evaluation of scalar invariance by constraining item intercepts/thresholds in tandem with factor loadings (see Figure 3). The above models were tested using two populations in a multi-group CFA framework and using more than two populations by combining multi-group and MIMIC methodologies (see Figure 4).
Sample size and the power to evaluate model discrepancies between nested models
MacCallum et al. (1996) proposed that the power to evaluate model fit in CFA should be based on discrepancies between null and alternative RMSEA values. This index is estimated as a function of the discrepancy function F0 and the degrees of freedom d (Rigdon, 1994).

Using formulae provided by MacCallum et al. (1996), in the present study, discrepancies between exact fit (RMSEA = .02) and close fit (RMSEA = .01), for a one-factor model with 23 indicators (as is the case for reading comprehension), a sample size of 290 participants would suffice to provide power equal to 99.5% (estimation based on Preacher & Coffman’s 2006 applet).
Sample size simulation
A simulation study was run to evaluate the precise sample size estimates needed to implement chi-square tests when comparing different nested models using the procedures described by L. K. Muthén and Muthén (2002). This simulation was run using a single factor CFA model with 23 items (i.e., for reading comprehension), and a sample size equal to 290 participants across 500 replications. The estimates for the simulation of factor loadings and variance estimates were based on population parameters (based on 41,134 cases). Results indicated that the model converged in all 500 replications. Differences between observed and expected indices indicated that the bias in the RMSEA at 5% was equal to .002, which is negligible. The bias at finding significant effects at 95% was between 94.2% and 96.2% for slopes, intercepts, and error variance terms. Thus, a random sample of 290 cases was used in all invariance modeling using the Reading Comprehension subscale with group formation involving public versus private schools and urban versus rural regions.
Results
What Are the Effects of School Type (Public vs. Private) on Students’ Scores on GAT’s Reading Comprehension?
Table 1 shows the findings from the three nested models by fitting a multi-group CFA structure to the tetrachoric correlation matrix of the Reading Comprehension subscale. The residual-based criterion of RMSEA < .05 and CFI > .900 were met. Thus, preliminary evidence suggested that a one-factor simple structure fit the data for both populations properly, suggesting the presence of configural invariance. Notably, the fit based on the CFI was proper based on earlier recommendations but not more recent ones (Hu & Bentler, 1998). However, the fit based on the RMSEA was right at the cutoff of exact and close fit, suggesting very good model fit. Several factor loadings from the two groups did not exceed conventional levels of significance. Nevertheless, the quality of the instrument per se was not the objective of the present report. Metric invariance included constraining the factor loadings to be equivalent across groups. Factor variances were fixed to one for both groups for identification purposes. Using custom chi-square difference tests 4 (i.e., Difftest procedure), metric invariance was supported and model fit was improved by use of descriptive indices, although by default the constrained model was associated with worse, albeit non-significantly, model fit. Thus, once again, metric invariance was supported. Last, placing the additional constraint of equivalent intercepts was also supported (scalar invariance). Model fit was not significantly worse using the Difftest procedure and incremental fit remained at the exact same level as in the metric invariance model. Subsequent analyses involved the additional contribution of region as a moderating variable to assess whether the metric and scalar invariance held when both independent variables, namely school type and region, interacted with each other.
Comparison of Nested Confirmatory Factor Analytic Models for Evaluating Invariance by School Type for the Reading Comprehension Subscale of the GAT.
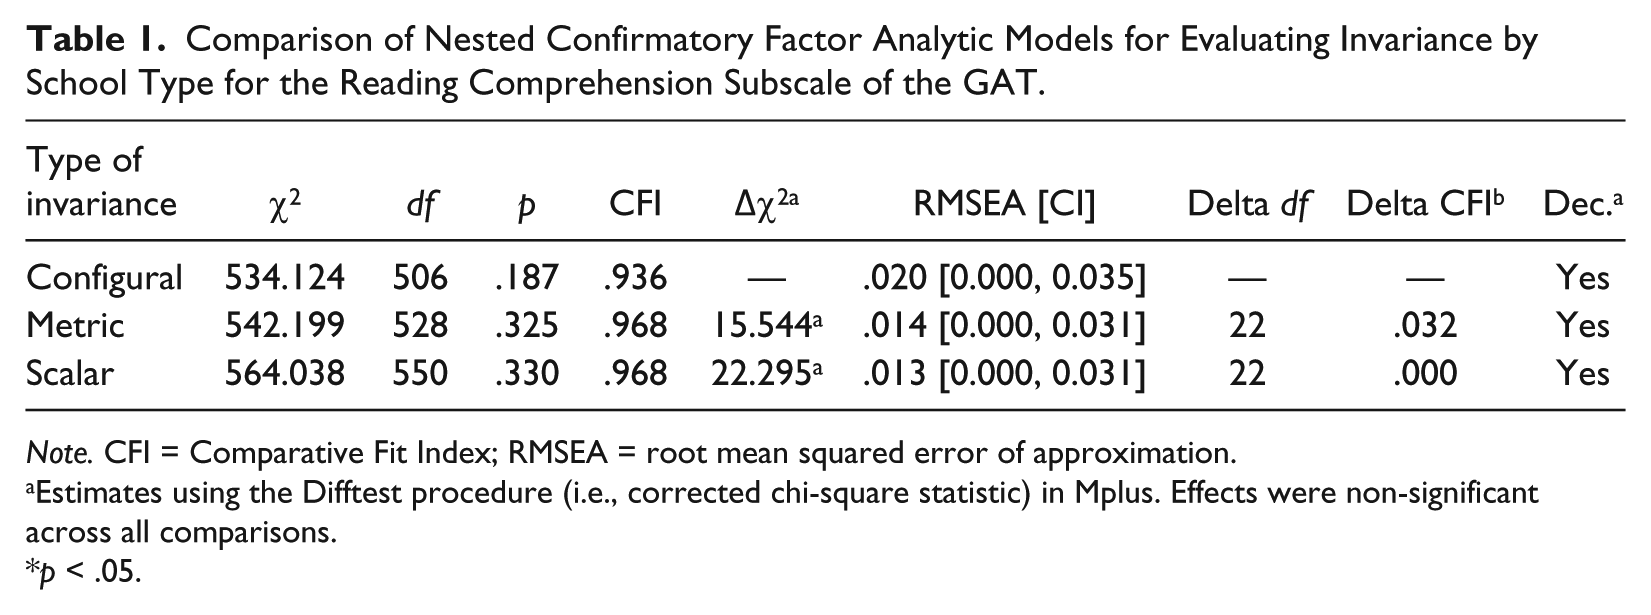
Note. CFI = Comparative Fit Index; RMSEA = root mean squared error of approximation.
Estimates using the Difftest procedure (i.e., corrected chi-square statistic) in Mplus. Effects were non-significant across all comparisons.
p < .05.
What Are the Effects of School Type (Public vs. Private) and Region of Residence (Urban vs. Rural) on Students’ Scores on GAT’s Reading Comprehension?
When fitting separate CFA models to the data across school type and through evaluating the contribution of region using the MIMIC model, configural invariance was supported (see Table 2). The RMSEA value was suggestive of exact fit by use of the point estimate, and its confidence interval slightly exceeded the cutoff for exact fit (i.e., .02). Furthermore, the CFI was excellent (.988). This finding suggests that there was no specific misfit due to bias introduced by any population and evaluation of the modification indices did not point to any specific and meaningful misfit due to either of the independent variables. Thus, the simultaneous evaluation for both populations suggested that the univariate simple structures held well. Using this multiple-population bias analysis metric invariance was also supported with decrements in model fit due to factor loading constraints being practically negligible and statistically non-significant. Furthermore, the RMSEA point estimate was suggestive of exact fit. Last, scalar invariance was also supported with model fit being outstanding by both the RMSEA (being exact) and the CFI (1.00). The Difftest procedure also produced non-significant decrements in model fit from imposing those additional constraints.
Comparison of Nested Confirmatory Factor Analytic Models for Evaluating Invariance by Both School Type (Private vs. Public) and Region of Residence (Urban vs. Rural) for the Reading Comprehension Subscale of the GAT.
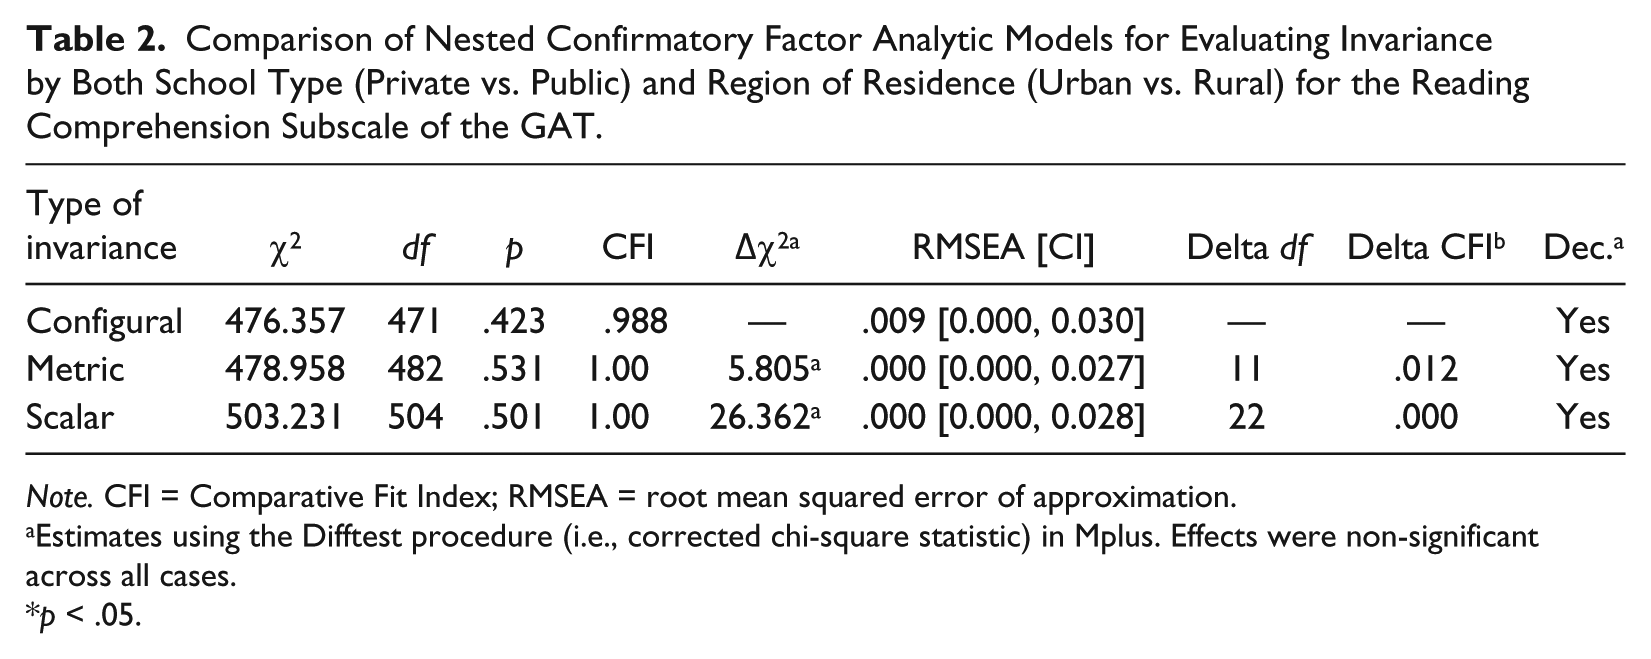
Note. CFI = Comparative Fit Index; RMSEA = root mean squared error of approximation.
Estimates using the Difftest procedure (i.e., corrected chi-square statistic) in Mplus. Effects were non-significant across all cases.
p < .05.
Figure 7 displays test characteristic functions and test information functions for four comparison groups with regard to Reading Comprehension. Results suggest that the least successful range of information was provided by individuals coming from urban public schools for which the Reading Comprehension subscale of the GAT was least sensitive to low ability individuals. Inspection of the TCCs suggests that the test maybe slightly easier for individuals coming from private schools or private urban schools, compared with those individuals educated in public schools, particularly urban public schools, although a test of significance using the variance estimates for each curve (Penfield, 2005 5 ) supported the null hypothesis (τ2 = 0.006, z ≤ 3.00, for α = 1/1000, demonstrating a small effect size).
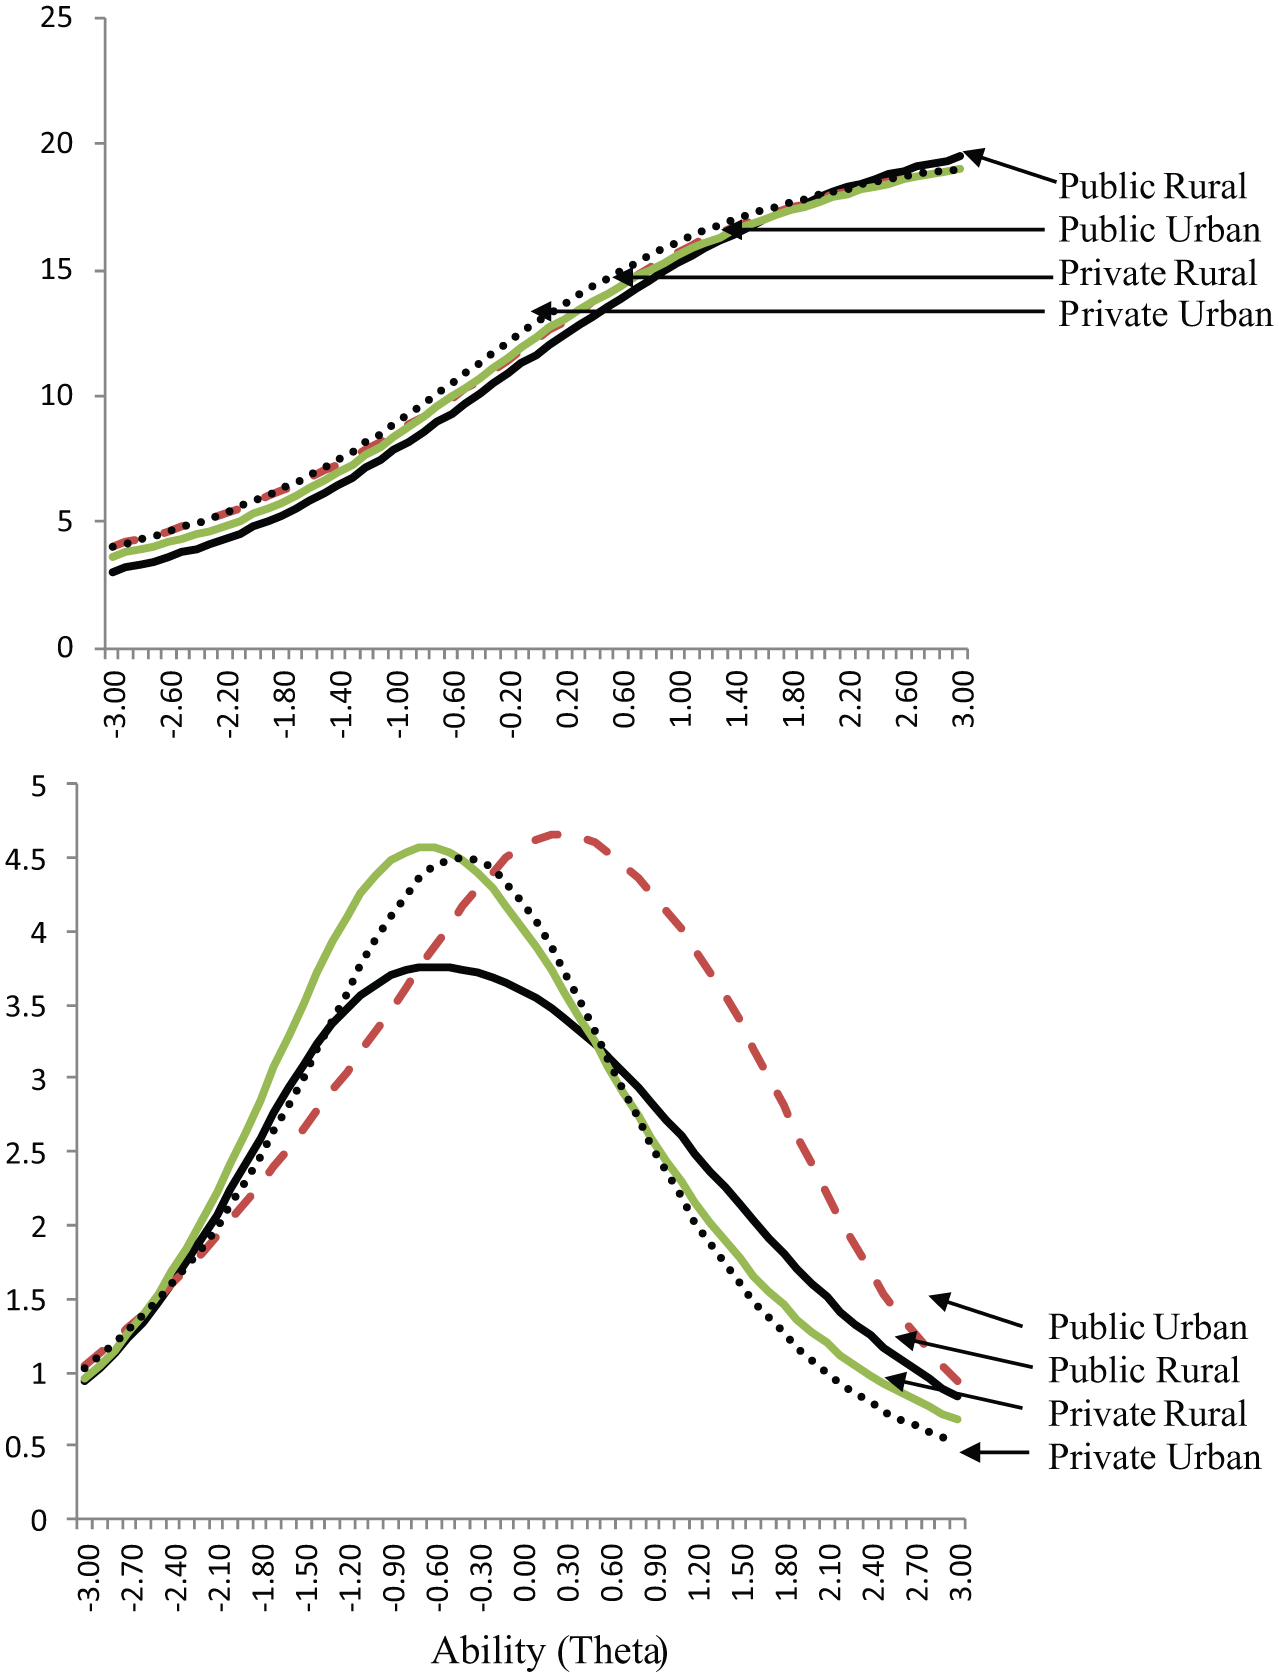
Test characteristic curves (TCCs; upper panel) and test information functions (TIFs; lower panel) for combinations of school type and region of residence for the Reading Comprehension subscale.
Effects of School Type (Public vs. Private) and Region of Residence (Urban vs. Rural) on Students’ Scores on GAT’s Arithmetic Subscale
As a thoughtful reviewer suggested, the saliency and importance of the present methodology would be augmented through an example in which measurement invariance would not be satisfied. Thus, we selected the “Arithmetic” subscale of the GAT for which both metric and scalar invariance were not satisfied using the current sample. Specifically, the difference chi-square tests were significant for metric invariance suggesting that the slopes linking the items to the latent constructs were non-equivalent, χ2(16) = 34.928, p = .0041. Given the absence of metric invariance, scalar invariance is not discussed further. Figure 8 presents a visual analysis of two samples showing lack of invariance with regard to the measurement of the arithmetic skill. As Figure 8 shows, the 17-item subscale was simultaneously fit to the data of both students from private (upper figure) and students from public schools (lower figure). These mirrored graphs would show equivalence of slopes if the estimates (on the arrows linking the items to the latent construct) were the same for both groups. For example, the slope for Item 17 was equal to 0.63 for both groups, showing perfect equivalence. Besides metric invariance, the equivalence, or lack of, the intercepts (item difficulties) for both groups is shown with the vertical axis showing the range in item difficulties from approximately −1 to 1.5 logits. An example of equivalence is Item 10 for which the intercepts for both groups lie at approximately the same level (similarly good equivalence was also observed for Items 2 and 11). Most items, however, failed to show that effect; for example, large discrepancies in item difficulties were observed for Items 7, 9, 12, 3, and so on (with differences exceeding half a logit and approaching or exceeding one logit). Thus, Figure 8 shows both functionality (equivalence of slopes) in the definition of the arithmetic construct as well as differences in level between two groups. Both types of information corroborate with the idea that the measurement of arithmetic ability for students in private and public schools was saliently different preventing any meaningful comparisons between the two groups.
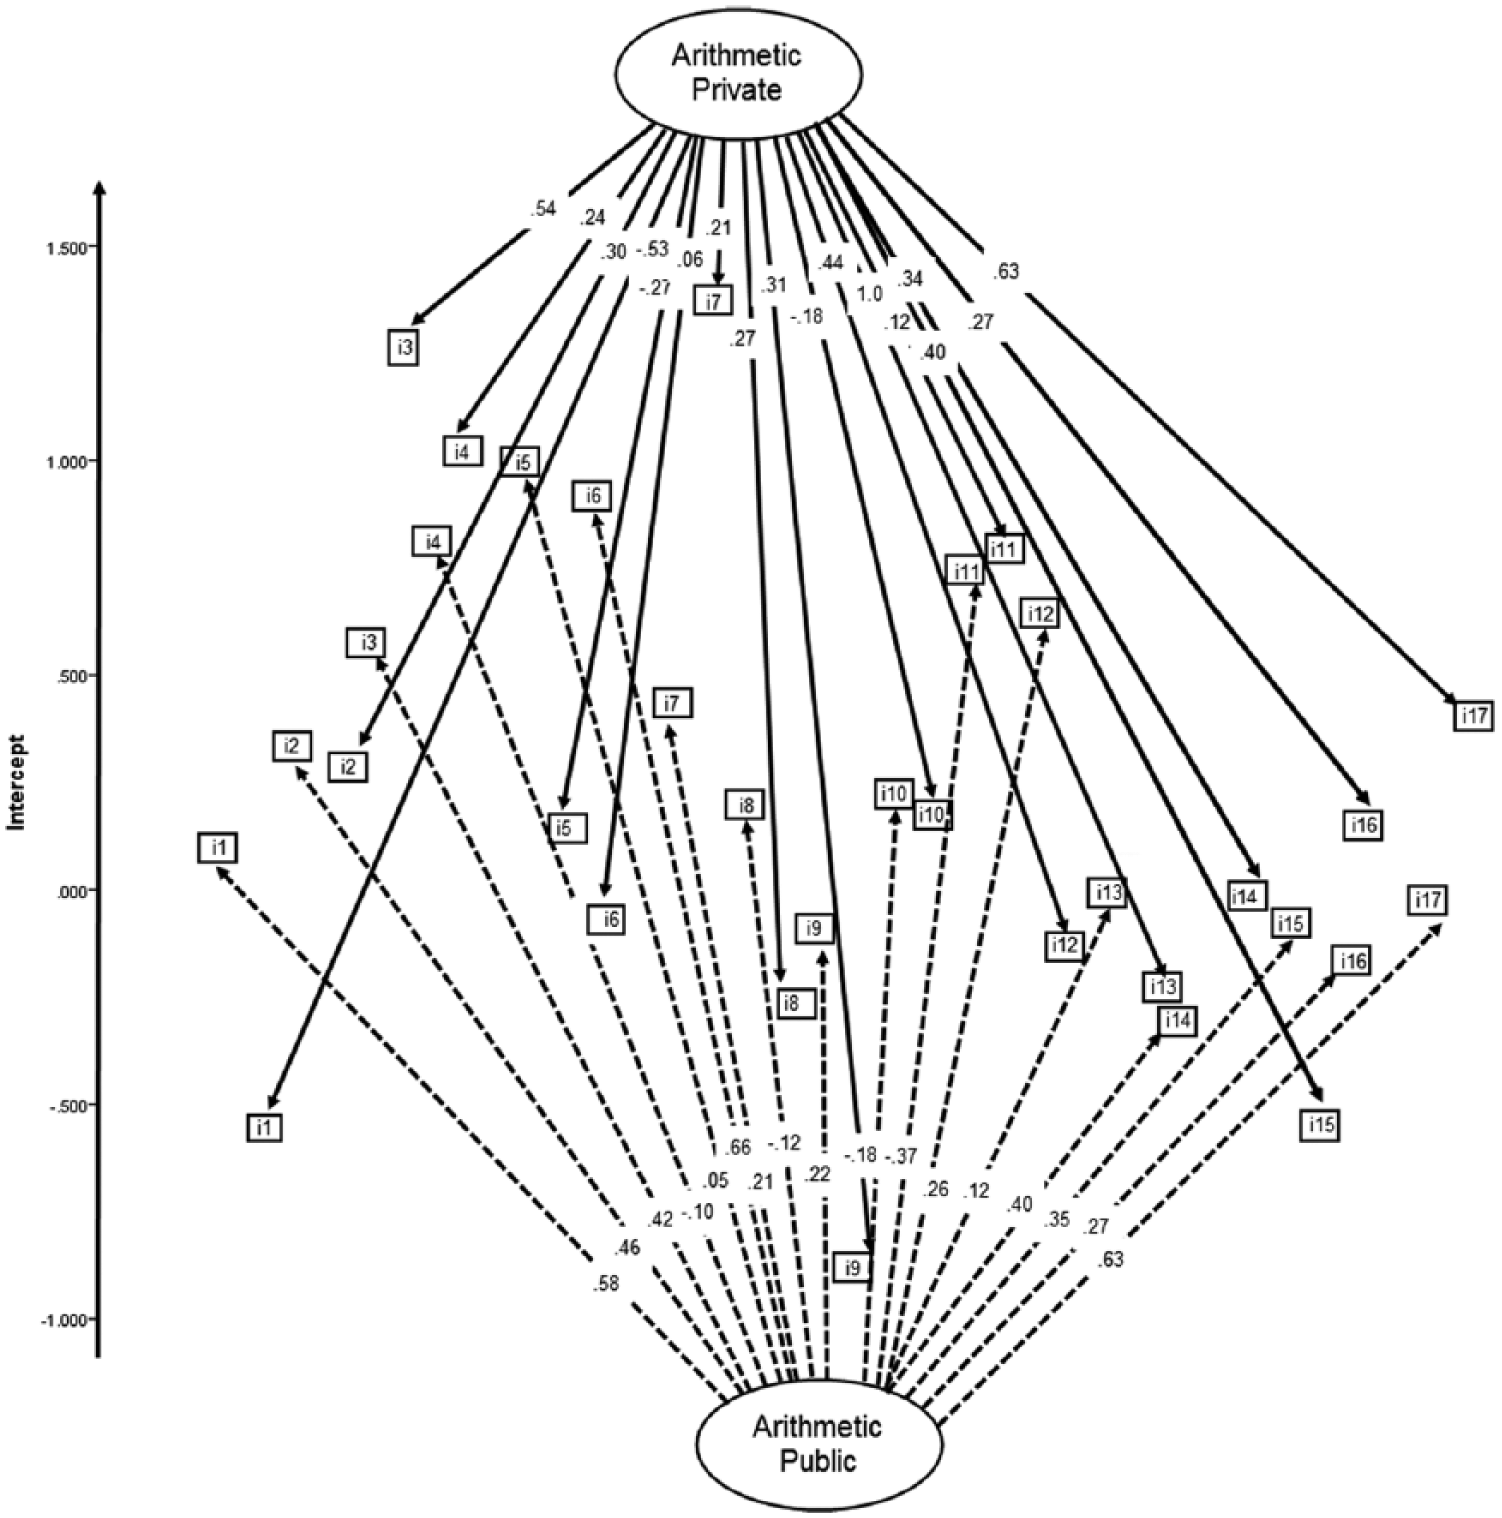
Multi-group intercept/slope plot for visual comparison between model fit for public versus private schools on the Arithmetic subscale of the General Aptitude Test (GAT).
Discussion
The purpose of the present study was to extend the model of measurement invariance by suggesting a hybrid CFA model that combined multi-group and MIMIC methodologies for simultaneously evaluating measurement invariance across several populations. The present hybrid methodology of combining multi-group CFA analyses and MIMIC models to accommodate the interactive nature of independent variables defining two or more populations proved to be promising for evaluating complex sources of bias that stem from multi-group differences. Several important findings emerged from the present study.
The most important finding related to the fact that the proposed two-step methodology provides a viable method to estimating invariance across two independent variables, each containing a number of levels. Thus, a 2 × 2 design was accommodated as the two levels of factor two (defined by a dummy variable) were fitted for each level of factor one (multi-group model). This methodology may provide a sufficient alternative test of measurement invariance compared to the 13 model taxonomy provided by Marsh et al. (2013).
With regard to the Reading Comprehension subscale of the GAT, its unidimensionality was supported across all models, albeit the fact that several items did not present themselves with stochastically significant effects (at the slope level). Relying on the residual-based statistic (RMSEA) suggested that no further modifications to the unidimensional structure were necessary; thus, the unmodified instrument was kept as it was. Several researchers, however, have pointed out that invariance may be affected in the presence of model misspecification (French & Finch, 2011). For example, French and Finch (2011) proposed that incorrect decisions about measurement invariance should be expected at much higher levels than the assumed nominal alpha level in the case of model misspecification and their observations came under conditions of medium misclassification. It has been strongly recommended that tests of invariance should be halted under model misspecification conditions and should be resumed when such misspecifications are corrected (French & Finch, 2011), for example, after removing items or persons who are the cause of the misspecification. These error rates have been even higher with dichotomous instruments compared with those having continuous indicators. Thus, future attempts to employ the present hybrid models should ensure that the best possible measurement model has been ascertained.
It is important to also note that the MIMIC model ordinarily tests for uniform measurement invariance; thus, in the case of unequal factor loadings, the model results are put into question (Kim et al., 2012). This potential problem can be resolved by first testing for factor loading equivalence. In the case of non-invariance, one can proceed by testing interactions between the latent factor η and the grouping variable X (Marsh et al., 2013). Another potential limitation of the MIMIC procedure relates to the large number of Type 1 errors observed in simulation studies (French & Finch, 2011), particularly when models are misspecified (French & Finch, 2006, 2011). However, in the present study, the models fit the data extremely well; thus, we did not expect such effects. In the future, it will be important to take into consideration the recommendations and critiques put forth by Raykov et al. (2012) on the standard practices used to evaluate measurement invariance but the present synergy is a promising venue. Extensions to the present combination of multi-group and MIMIC approaches would be the testing of interactive effects or other non-linear relationships between factors whose levels behave differently on an instrument. Further evidence with regard to invariance conclusions under instances of large misclassifications may also be another research venue.
Footnotes
Declaration of Conflicting Interests
The author(s) declared no potential conflicts of interest with respect to the research, authorship, and/or publication of this article.
Funding
The author(s) received no financial support for the research, authorship, and/or publication of this article.