
Abstract
The Early Literacy Knowledge and Skills (ELKS) instrument was informed by the work of Ferreiro and Teberosky based on the notion that young children could be differentiated according to levels of sophistication in their understanding of the rules of written language. As an initial step to evaluate the instrument for teaching purposes, the present study examines its psychometric properties in terms of internal consistency reliability, model-data fit, item discrimination, match between item difficulty and ability range in the sample, and item difficulty according to Ferreiro and Teberosky’s theory of early literacy development. Overall, the ELKS instrument showed good psychometric properties in these areas, although two items in particular may require further investigation and possible revision according to the model-data fit index. Future directions to investigate the potential classroom application of the instrument are suggested.
Keywords
The work of Ferreiro and Teberosky (1979/1982) on preschool children’s early literacy concepts has influenced some of our current understanding of early literacy development (e.g., Clay, 2002; Goodman, Reyes, & McArthur, 2005; Sulzby & Teale, 2003). Adopting a constructivist perspective, Ferreiro and Teberosky conceptualized early literacy as a problem-solving process where young children construct different hypotheses to solve the mystery of written text. According to Ferreiro (1991), children form hypotheses about the rules of written language to understand them and apply them in ways that are widely accepted. Based on their observations of 4- to 6-year-old Argentinian children (N = 69) completing early literacy tasks, Ferreiro and Teberosky suggested different progression levels to describe the way young children develop a more sophisticated understanding of the rules of written language. These developmental levels have been identified in the early literacy development of monolingual and bilingual children in languages such as Japanese (Kato, Ueda, Ozaki, & Mukaigawa, 1998), Spanish, Hebrew (Tolchinsky & Teberosky, 1998), and English and Chinese (Yaden & Tsai, 2012). Deaf children have also been found to display these developmental levels (Ruiz, 1995; Watson, 2009).
Ferreiro and Teberosky (1979/1982) argued that their findings support the idea that students need to be able to demonstrate their own understanding of literacy in the classroom. They asserted that children at different developmental levels may construct an understanding of literacy that is different from adults. By allowing children to demonstrate their own understanding of literacy, teachers can identify the misconceptions behind the reasoning of individual children and find developmentally appropriate ways to correct those misconceptions. Rather than asking children to rote learn the conventional conception of literacy, Ferreiro and Teberosky suggested that literacy teachers need to incorporate children’s existing knowledge, using language and concepts that are appropriate to their cognitive developmental stages. Their study findings therefore have specific implications on the teaching and assessment of literacy in the preschool and early primary years.
Drawing upon Ferreiro and Teberosky’s (1979/1982) work, the Early Literacy Knowledge and Skills (ELKS) instrument (Barringer, Brown, Chan, & Care, 2009) contains tasks that provide children the opportunity to explain how they make sense of written language. A scoring scheme was formulated to allow children’s responses to be rated according to the developmental level demonstrated. The instrument was developed as part of the Young Learners’ Project (YLP; www.education.unimelb.edu.au/younglearners/), a 6-year study (2007-2012) that aimed to identify personalized early literacy teaching strategies for children in preschool and the first year of school. Although the instrument was initially designed as a data collection tool for the YLP (Barringer, 2009), the responses that can be elicited using the instrument may also be useful for informing teaching.
The purpose of the present study was to examine the psychometric properties of the ELKS instrument as an initial step to evaluate whether the data drawn from the instrument could be useful for informing early literacy teaching. Item response modeling was used to analyze the data and to compare the difficulty ordering of the ELKS items and item steps with Ferreiro and Teberosky’s (1979/1982) theory of early literacy development. Other indicators from item response and classical test theories were also examined, such as internal consistency reliability, the fit between the items and the partial credit model (PCM), how well the items discriminate between children of different ability levels, and the match between the difficulty of item steps and children’s ability estimates. For the purpose of this study, literacy was defined as the ability to read (decoding and comprehension) and write (spelling and expression of ideas) using conventional media (print and pencil). Consistent with Whitehurst and Lonigan’s (1998) definition of emergent literacy, early literacy was used to refer to the conceptual knowledge and skills that are developmental precursors to formal literacy.
Method
Participants
This study included cross-sectional data collected from 293 children (145 males, 148 females), with two thirds of them (n = 183; 47-66 months old) in preschool and the rest in their first year of school (n = 110; 63-79 months old) at the time of assessment. The average age of the preschool children at the time of assessment was 56.7 months (SD = 4.2 months), and 70.6 months (SD = 3.4 months) for the primary school children.
Material and Administration
The children were assessed using the ELKS instrument in the middle of their preschool or school year. The instrument is designed to be administered on an individual basis and is composed of three main components: an A4-size stimulus booklet, a response recording sheet that includes administration instructions, and a set of scoring criteria. The instrument contains 10 tasks assessing concepts of silent reading behavior, writing, knowledge of print conventions, word reading, syntactic knowledge, and knowledge of the alphabet, letter-sounds, and words. Most of the tasks involve giving children problem scenarios, and asking them to select from a range of responses and explain their reasoning. Some tasks have multiple items to account for possible inconsistencies in responses. The average administration time was around 20 min per child, ranging from 15 to 45 min. Further details regarding the instrument can be found in Barringer (2009) and Chan (2012).
The number of items in each of the ELKS tasks varies. Altogether, there are 30 items in the ELKS instrument, with the number of score levels within each item ranging from two to seven. Consistent with Ferreiro and Teberosky’s (1979/1982) study, responses were coded so that a higher score level within an item indicates a more sophisticated level of knowledge or skills. The interrater reliability of the individual tasks in the ELKS instrument based on interrater correlation (Tinsley & Weiss, 1975) were .87 or above across tasks (Barringer, 2009).
Procedure
Item scores from the ELKS instrument were analyzed with ConQuest (Wu, Adams, Wilson, & Haldane, 2008) using the PCM (Masters, 1982; Masters & Wright, 1997). As the ELKS instrument is designed to describe the early literacy development of children based on Ferreiro and Teberosky’s (1979/1982) theory, the one-parameter logistic (1PL) model was used instead of the two-parameter logistic (2PL) generalized PCM (Muraki, 1992) as the former model allows a clearer link to be drawn between a child’s raw score and the theoretical developmental progression (Wu, Tam, & Jen, in press).
The PCM allows items that have more than two item steps (i.e., score levels) to be analyzed and assumes the difficulty of the item steps within an item to be of different intervals (Wu, Adams, Wilson, & Haldane, 2007). Mathematically, with
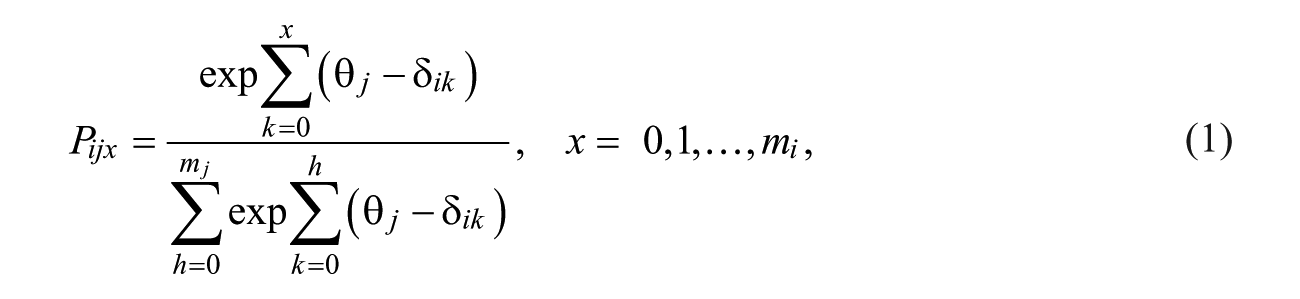
where
As the PCM allows the item step parameters
In the current study, year level (preschool or first year of school) was used as an independent variable or predictor for the item responses using latent regression (Adams, Wilson, & Wu, 1997). Assuming that the primary school children would generally find the assessment tasks easier than the preschool children, the regression provided an additional validity check for the ELKS instrument.
The PCM with latent regression converged successfully. An examination of the item statistics found 24 out of the 30 items have at least one score category with a relatively small number of respondents (fewer than 15 children; 5% of the total sample). Such categories may not be very reliable for estimating the item difficulty or child ability. The provision of a large number of score categories (up to seven categories for an item) also makes the administration process less efficient. Following the procedure described by Wu and Adams (2007), the items were recoded and the score categories for items that had more than three levels were collapsed. The recoding process involved balancing the spread of the responses in each score level, the sizes of the point-biserial correlation and average ability estimates across the score levels, and the meaningfulness of the categories in differentiating children of different ability levels.
The item response analysis was rerun with the recoded score categories using the PCM with year level as the independent variable. Table 1 provides a list and a brief description of the items and item steps included in the analysis after the recoding.
A List of the ELKS Tasks, Item Code, Item Description, and Item Step Description.
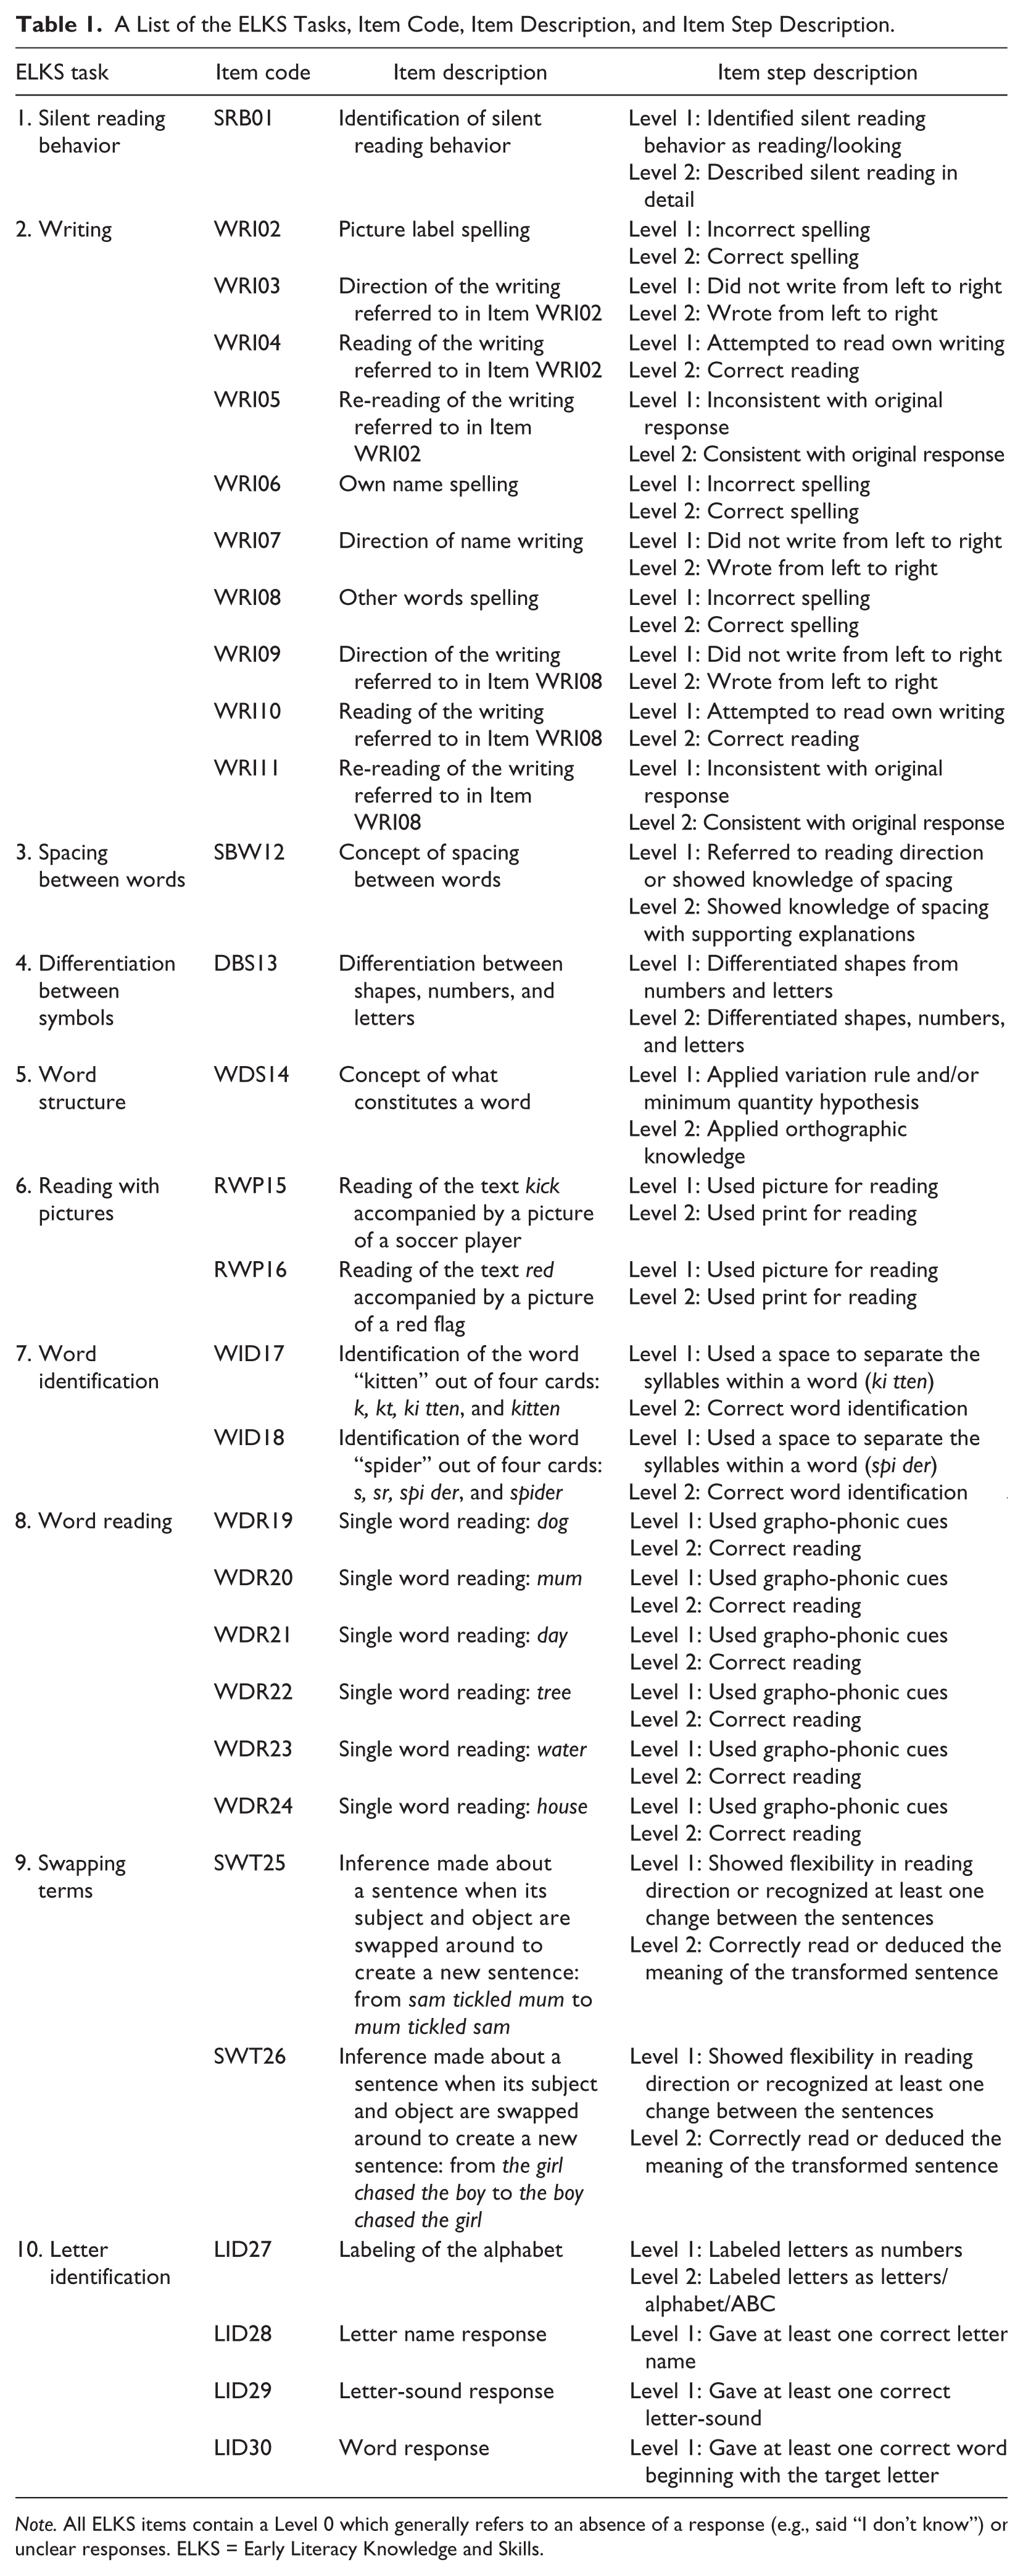
Note. All ELKS items contain a Level 0 which generally refers to an absence of a response (e.g., said “I don’t know”) or unclear responses. ELKS = Early Literacy Knowledge and Skills.
Results
Various indices were inspected to examine the psychometric properties of the ELKS instrument, including internal consistency reliability, the model-data fit, item discrimination index, and estimation of item difficulty.
Internal Consistency Reliability
The internal consistency of the ELKS instrument based on classical test theory statistics was examined. The index examines the agreement of scores between the items in a test (Allen & Yen, 1979). The alpha coefficient of the instrument was .95, indicating good reliability. However, as Kieftenbeld, Natesan, and Eddy (2011) pointed out, the coefficient does not reflect the precision of measurement at different levels of the latent trait, and a high value could also indicate item redundancy. The coefficient therefore needs to be interpreted in light of other psychometric properties of the instrument.
Model-Data Fit
Item fit statistics were inspected to examine the dimensionality of the ELKS items and the model-data fit. According to item response theory, items that fit a unidimensional model are generally assumed to measure the same construct or latent trait (Wu & Adams, 2007). Items that do not fit the model well may be measuring a different construct, although the misfitting could also be due to other reasons, such as poor item design, or random errors associated with items or population sampling (Embretson & Reise, 2000; Wilson, 2005).
Model-data fit can be assessed using statistical means by examining the mean square fit statistics for individual assessment items. The unweighted fit mean square statistic (also known as outfit mean square) proposed by Wright and Masters (1982) is defined as follows:

where N is the total number of respondents, xni is the observed score for person n on item i, and zni is the standardized residual. As the unweighted fit mean square statistic is sensitive to unexpected responses made by persons when item i is too easy or too difficult, Wright and Masters (1982) proposed the weighted fit mean square (infit) statistic as an alternative for examining item fit:
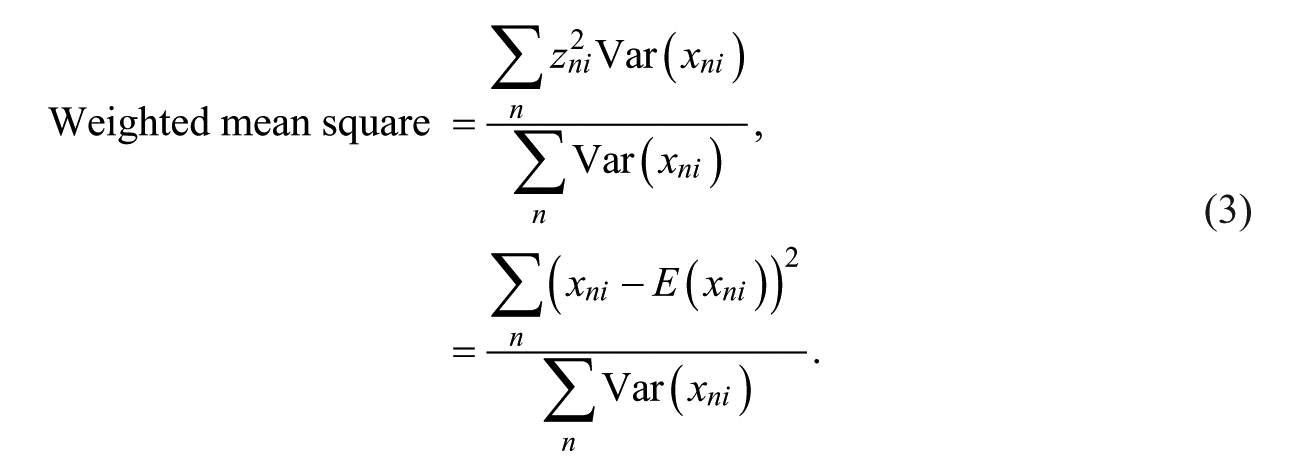
Table 2 presents the unweighted and weighted fit statistics for the 30 ELKS items based on the unidimensional PCM. The values in the table are sorted from low to high according to the weighted t-statistics. Applying the recommendations of Wright and Linacre (1994) and Wu et al. (2007), values that exceed the suggested thresholds for the weighted mean square (i.e., 0.5-1.5) and t-statistics (i.e., ±2) are in bold.
Weighted Mean Square Fit Statistics.

Note. Values that exceed the suggested thresholds for the weighted mean square (i.e., 0.5-1.5) and t-statistics (i.e., ±2) are in bold.
Constrained item parameter.
The weighted t-statistics were first examined to identify mean square values that fell outside of the confidence interval of 95% (two-tailed test). Items with weighted mean square values that exceed the recommended range indicate item misfitting. As can be seen from the table, out of the 30 ELKS items, 12 items have t values that are less than −2 or greater than 2. Out of these 12 items, 2 (WID17 and LID27) have a weighted mean square value that is greater than 1.5. The fit statistics suggest that on the whole, the majority of the ELKS items were measuring the same construct and fit the unidimensional PCM.
Item Discrimination Index
Other than item fit statistics, the psychometric properties of individual items can also be examined in terms of the item discrimination index based on classical test theory. An item discrimination index is the correlation between each child’s item score and the child’s total score (Fan, 1998). The index ranges from −1 to 1 and shows how well the items differentiate between children of different ability levels. Wu and Adams (2007) suggested that items with a discrimination index of less than 0.2 are not useful for measurement and recommended the inclusion of items with an index of above 0.4 in tests.
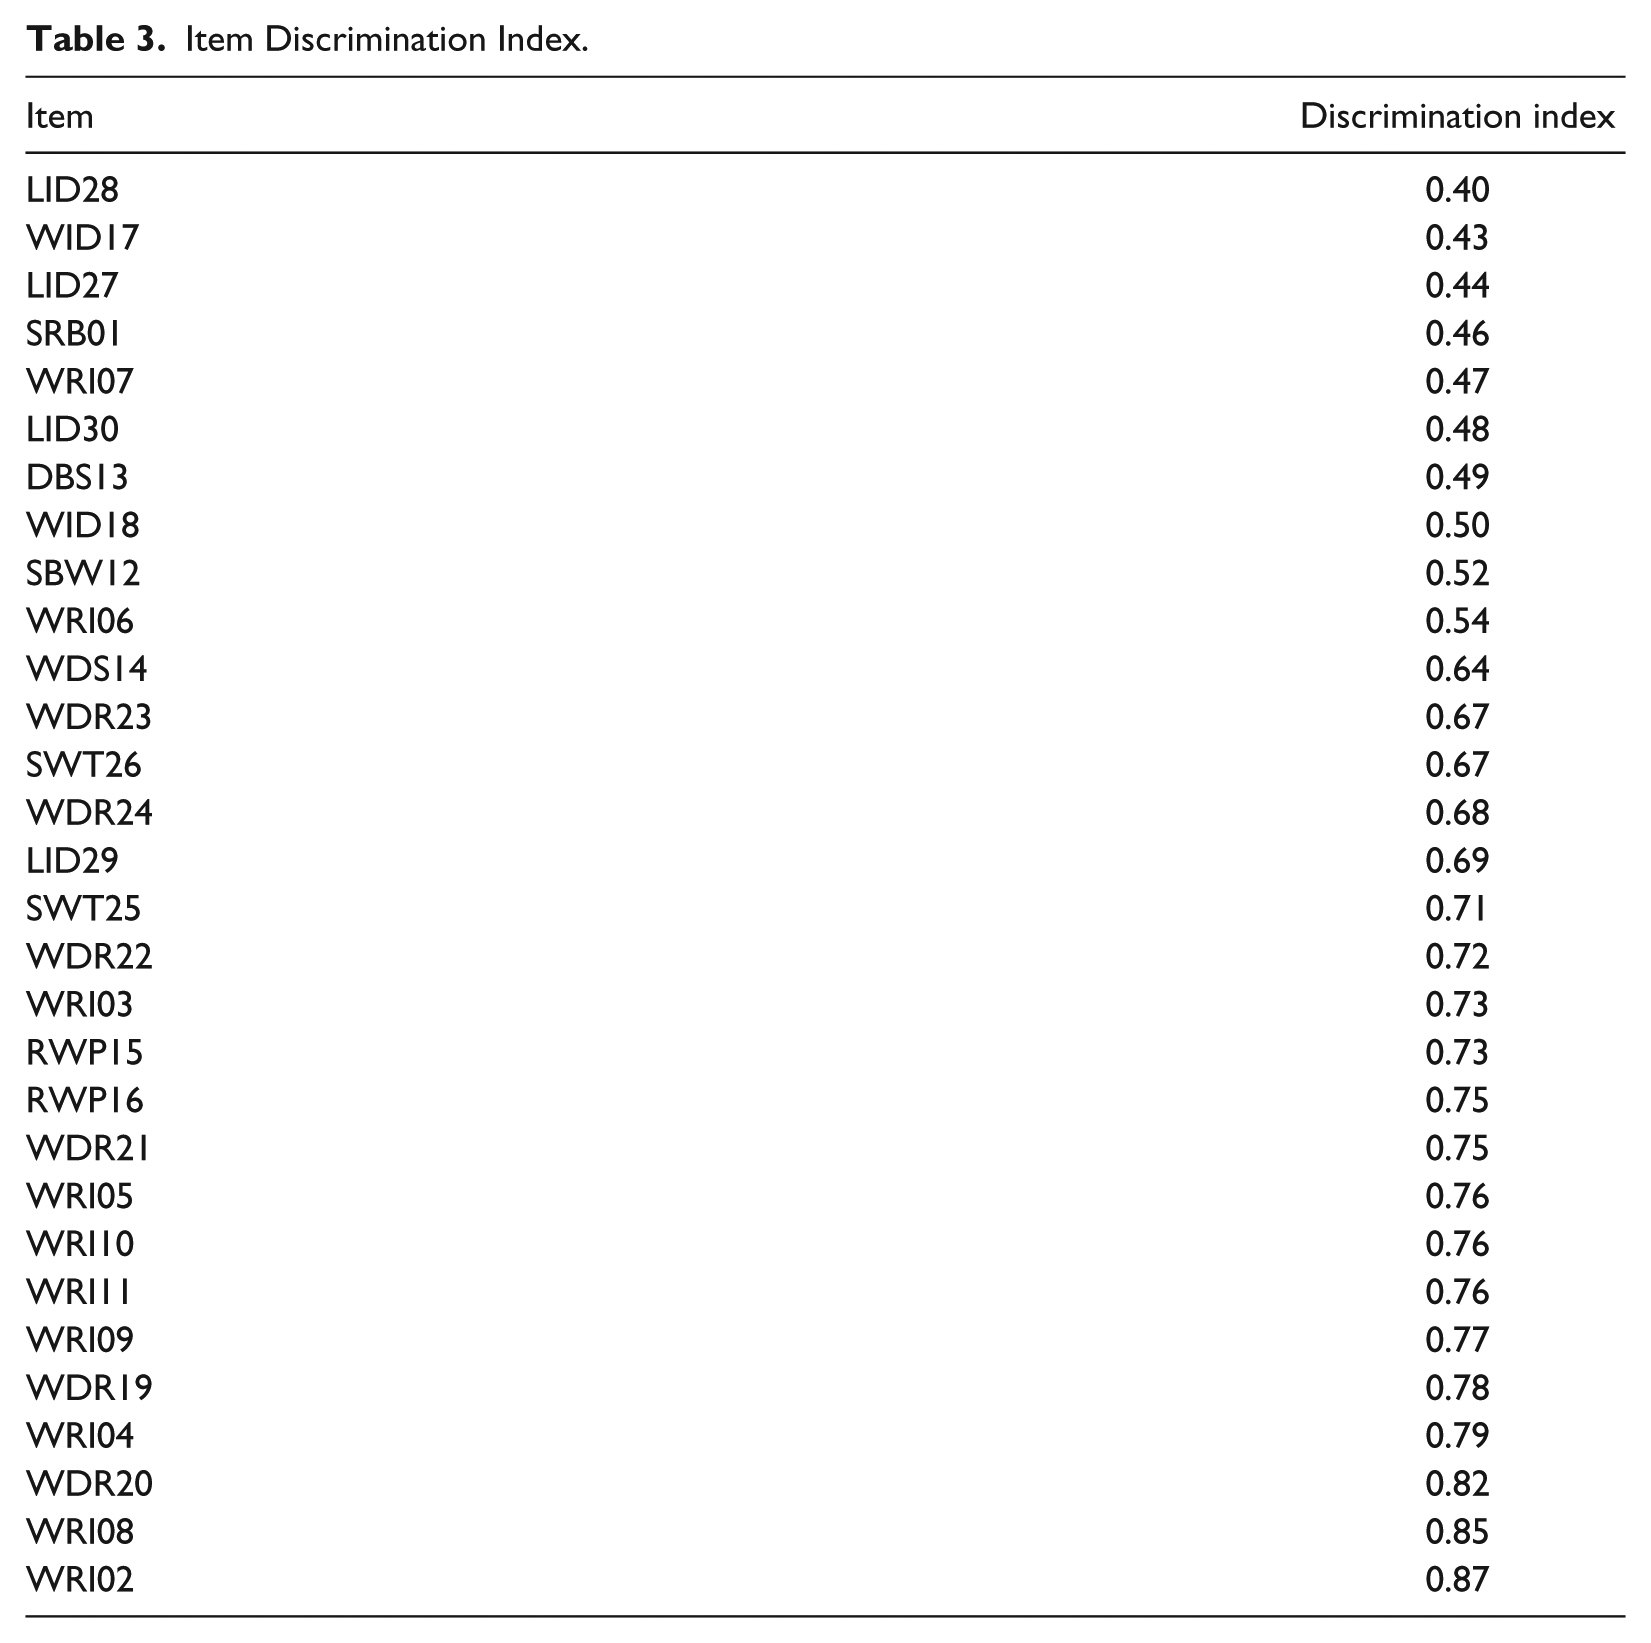
Table 3 shows the discrimination index of the ELKS items. The discrimination of the items was generally good, ranging between 0.40 and 0.87. As expected, the two items that showed relatively poor fit (WID17 and LID27) have a lower discrimination index. LID28, which refers to the ability of children to name at least one letter, had the lowest discrimination index. This could be because the majority of the children in the sample (91.1%) could do so, and so the item did not differentiate well between children of different ability levels.
Item Discrimination Index.
Item Difficulty
Item response theory conceptualizes the ability level of different people (person ability) and the difficulty level of different items (item difficulty) as being distributed along the same continuum. Figure 1 shows the item step difficulty map based on the item response modeling, where the numbers on the left represent a scale in logits (log odd units) shared by both child ability and item step difficulty. The Xs in the middle of the map represent the 293 children in this study, and the item steps are listed on the right. The suffixes .1 and .2 represent the second and third item steps of the particular item, respectively. Three of the four letter identification task responses only have two item steps and so only one item step is shown on the map for each of those three items. The item step difficulty map is presented in numerical form in Table 4 by showing the ordering of the items from high to low difficulty.

Map of child ability and item step difficulty estimates.
Item Step Difficulty.
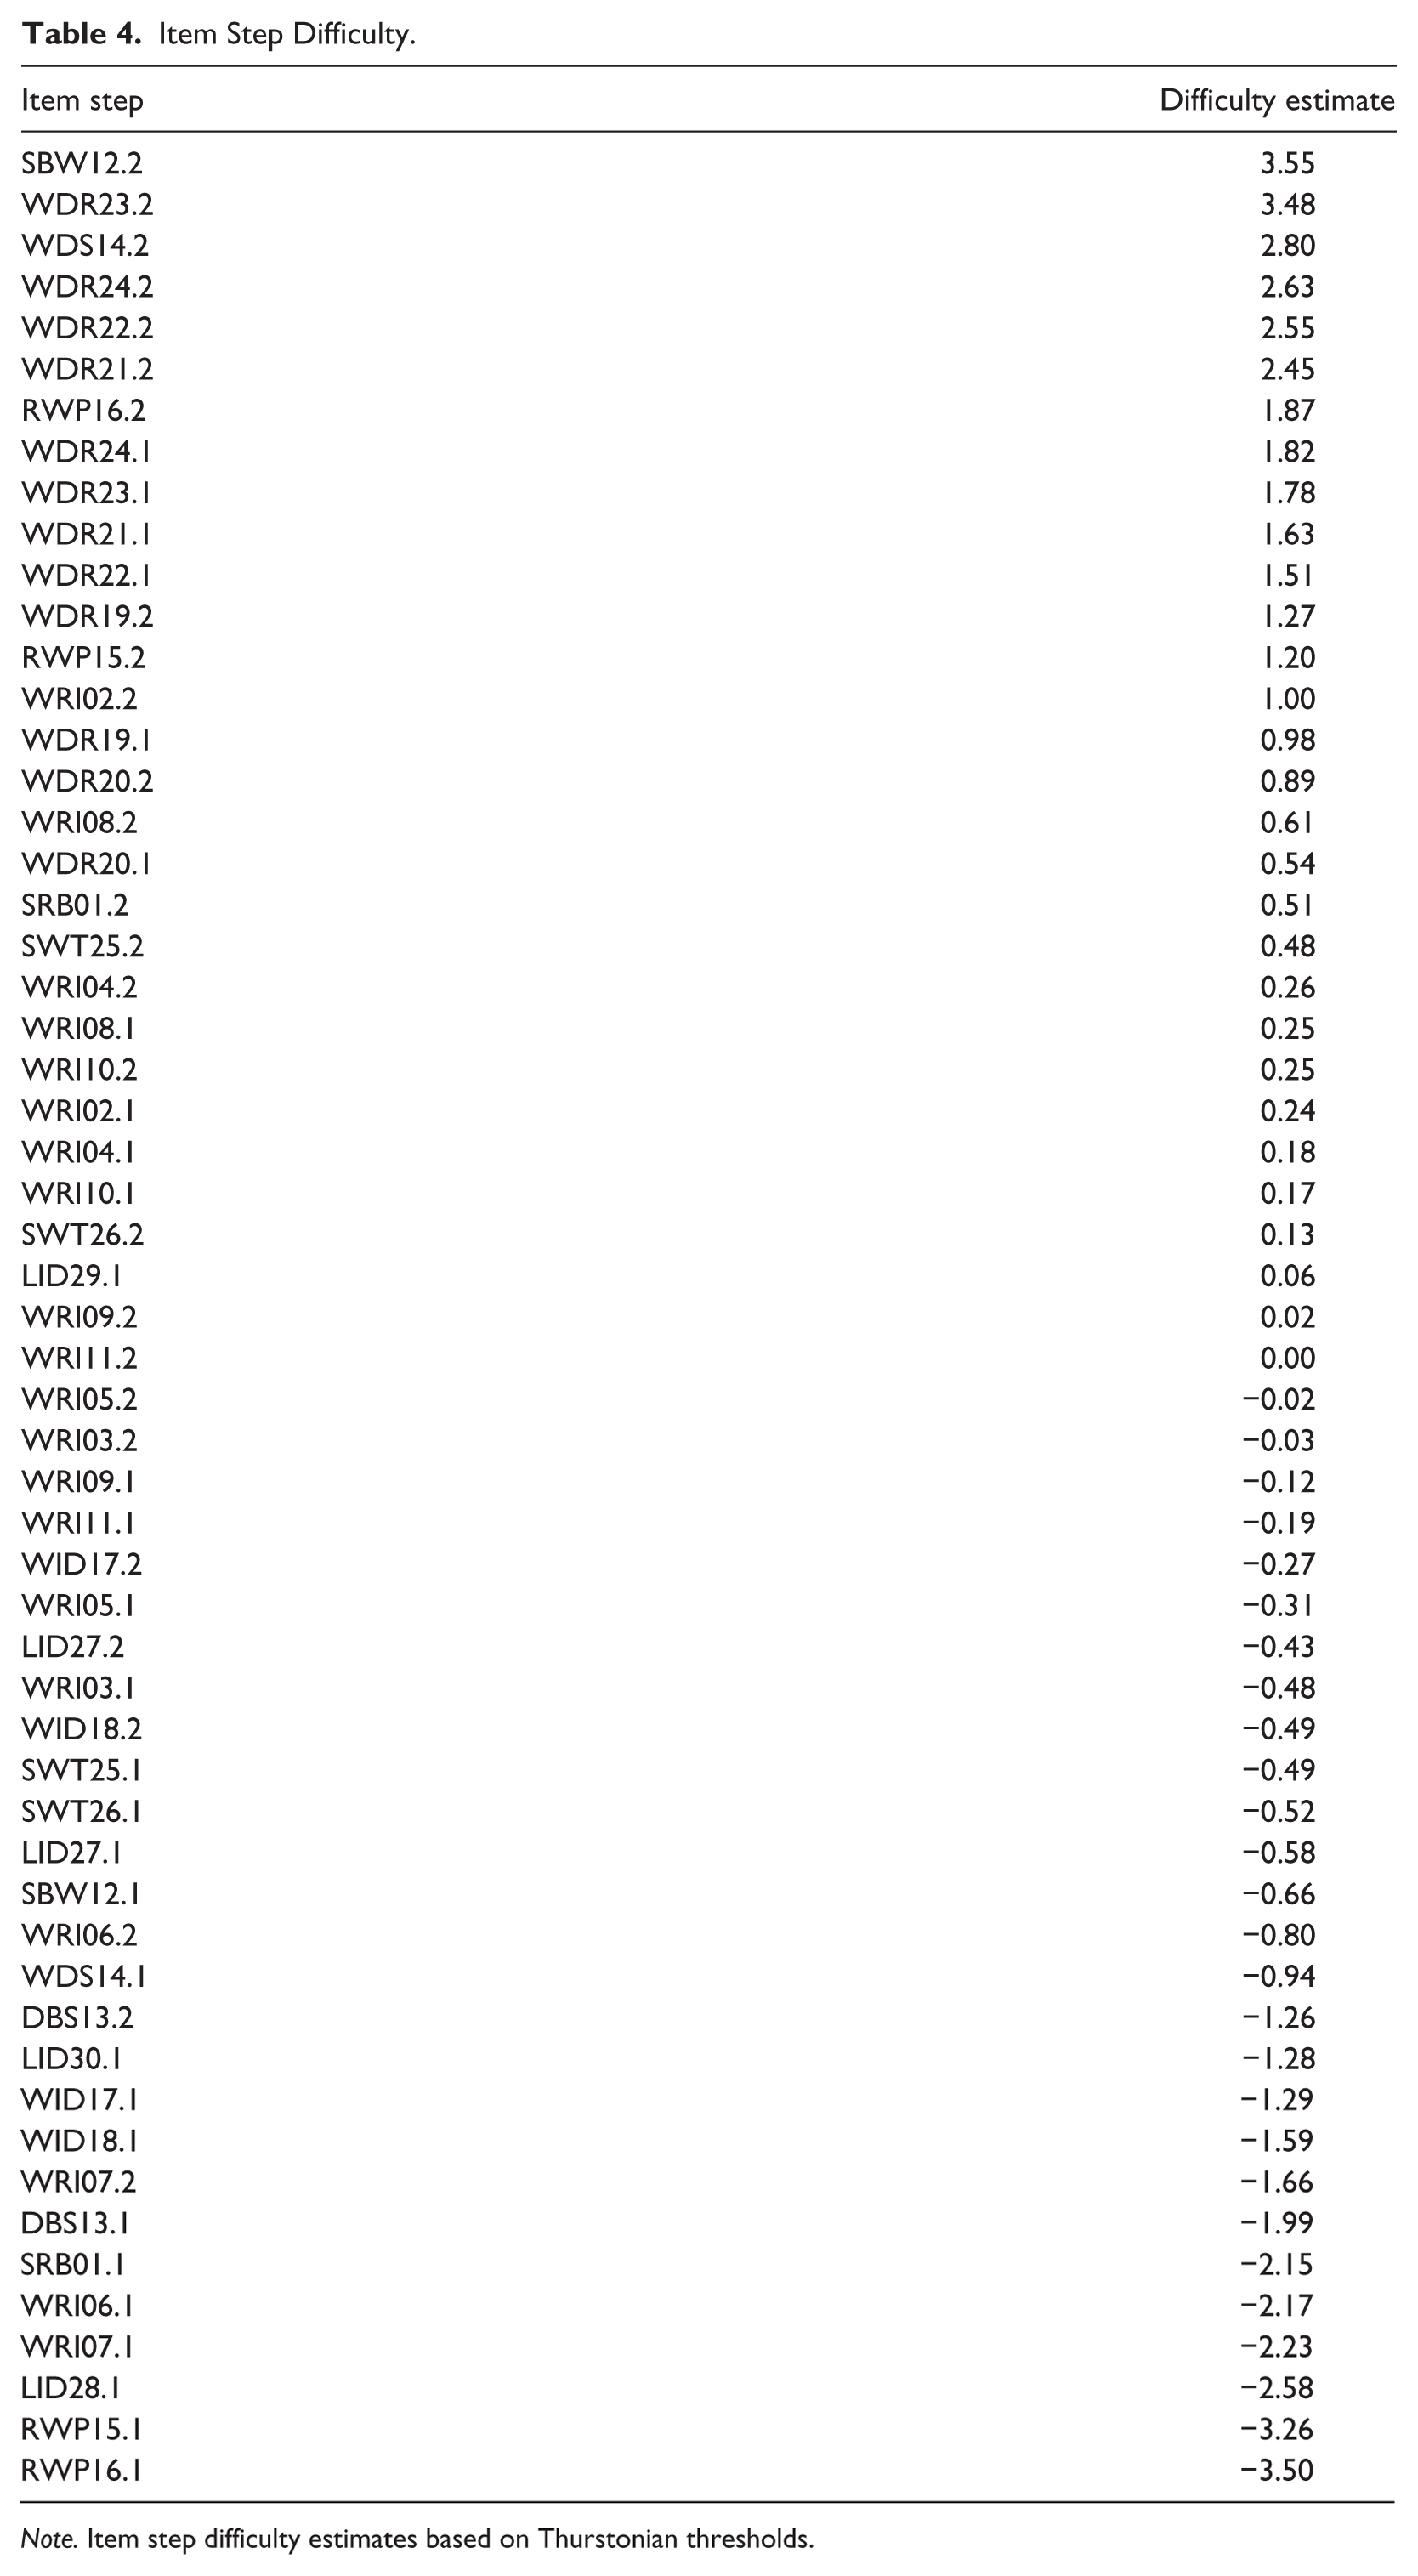
Note. Item step difficulty estimates based on Thurstonian thresholds.
In terms of interpreting the item step difficulty map (Figure 1), the children are positioned along the logit scale according to their ability level while the item steps are placed according to their difficulty level. The more able children and more difficult item steps are located further up the scale, whereas the less able children and easier item steps are located lower down the scale. As can be seen from the figure, the ordering of all of the item steps seemed to follow the PCM where the higher item step was more difficult (at a higher position) than the lower item step within an item. This implied that the ordering of the item steps followed the conceptual framework underpinning the score categories.
The average ability estimates of the children who were in preschool and the first year of school were −0.41 logit and 2.30 logits, respectively. The variance in the latent variable for each group of children was estimated to be 1.07. Technically, if the difficulty of the ELKS item steps matches the overall ability level of the children, the distribution of the item steps on the scale should be at the same level as that of the children (Wilson, 2005). This was supported through an inspection of the test information curve (Figure 2), which illustrates the different quality of information that a test provides at different ability levels (Furr & Bacharach, 2008). The figure shows that overall the ELKS items provided the greatest information at the average ability level of
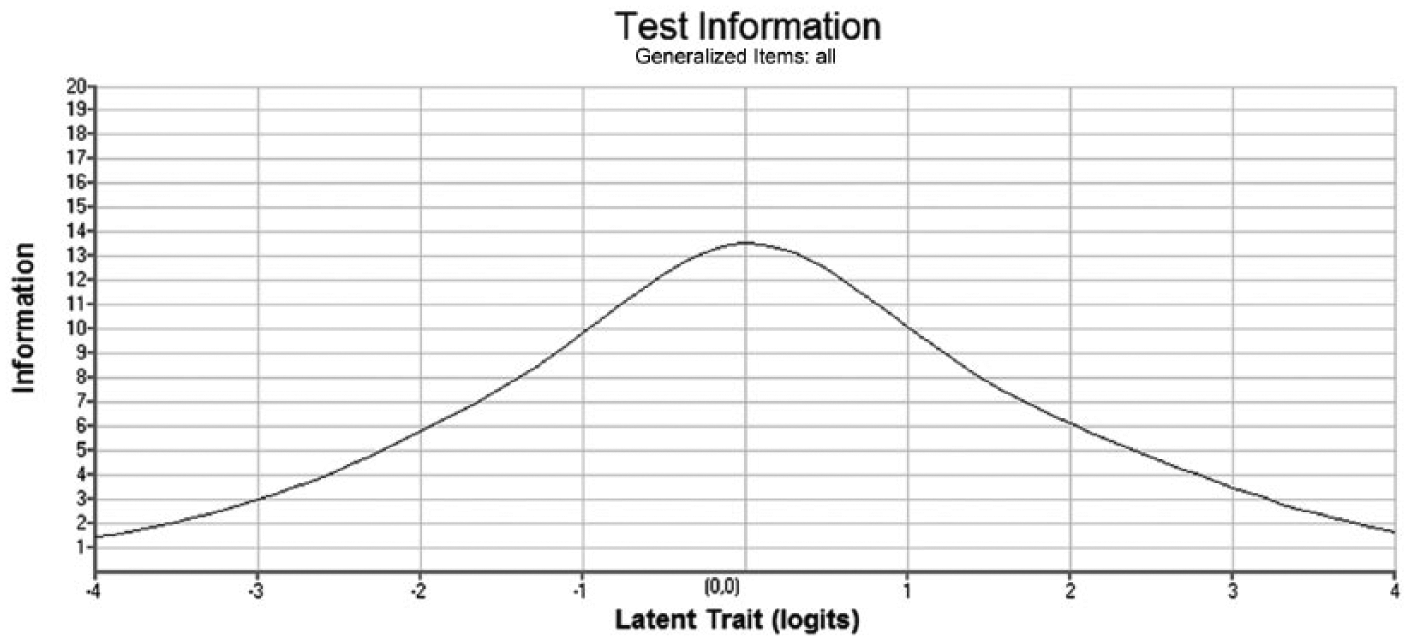
Test information curve.
The construct validity of the ELKS instrument can also be inspected through the examination of item step difficulty according to Ferreiro and Teberosky’s (1979/1982) theory of early literacy development. Supporting their theory, the difficulty estimates of the item steps demonstrated a progression of early literacy concepts. Children at a lower literacy ability level were found to rely more on contextual information such as pictures when they read (RWP15.1 and RWP16.1). The children were able to identify shapes among different symbols (DBS13.1), but tended to mix up numbers and letters (DBS13.2). At a higher ability level, children tended to apply stringent rules such as the minimum quantity hypothesis or the variation rule (WDS14.1). Children at the highest ability level tended to notice more text features such as spaces between words (SBW12.2), reading direction (SBW12.1), subject-object position (SWT25.2 and SWT26.2), and letter-sound relationships (LID29.1). They were also more likely to utilize their knowledge of these features when attempting literacy tasks.
Discussion
Based on the findings from the statistical analysis, overall the ELKS instrument showed good psychometric properties, although two items in particular may require further investigation or revision.
The results from the item difficulty analysis were generally consistent with Ferreiro and Teberosky’s (1979/1982) conceptualization of early literacy development. The lower end of the progression included item steps that were relatively less sophisticated, such as using the accompanying pictures to derive the meaning of text when reading. Responses in the middle section of the progression generally related to the application of rules such as the minimum quantity hypothesis or the variation rule. The upper end of the progression included responses that demonstrated a more sophisticated understanding of the rules of written language, such as the use of spacing, syntax, reading direction, subject-object position, and letter-sound relationships. At the item level, the difficulty ordering of the items seems reasonable when taking into account the nature of the tasks. For instance, children tended to find correctly writing their own names (WRI06) easier than writing other words (WRI02 and WRI08). Writing words that the children chose themselves (WRI08) tended to be easier than writing words that the assessment administrator prescribed (WRI02). Identifying the correct words from a range of choices (WID17 and WID18) was generally easier than pronouncing a word correctly (WDR19-WDR24).
In terms of model-data fit, the majority of the items (28 out of 30) in the ELKS instrument showed relatively good fit with the unidimensional PCM. All of the items generally discriminated well between children of different ability levels, and the measure as a whole had high internal consistency. Further investigations are needed to understand the reasons for the relatively poor fit showed by the two items (WID17 and LID27). These investigations may include examining the model-data fit in a larger sample to determine the replicability of the findings.
In terms of the match between item difficulty and person ability in the sample, as expected, the children who were in the first year of school generally performed better than the preschool children on the ELKS instrument. Although the ELKS item steps appear to cover a range of ability levels, the instrument may be more suitable for assessing children in preschool than the first year of school as the item steps appear to be too easy for the more able children at the top of the scale.
Regarding the possible applications of the ELKS instrument in the classroom, although the analysis of this study only examined the properties of the instrument at the group rather than at individual child level (Chan, 2013), the summative results from the assessment could help teachers to differentiate their teaching in small group teaching. For example, children who are at a lower ability level according to the item response modeling could engage in group activities that would encourage them to pay more attention to the textual cues when reading than to rely on pictures. For children who are at a higher ability level, teachers could challenge their thinking by examining exceptions to rules such as the minimum quantity hypothesis and draw their attention to the letter-sound correspondence in words at the syllabic level. For children who are at the highest ability level, formal literacy tasks that are more difficult or complex than those in the ELKS instrument may be needed to assess their ability. The developmental progression inferred from the item step difficulty map can also be used as a “road map” or a criterion-referenced framework that links curriculum, assessment, and pedagogy, as suggested by Black, Wilson, and Yao (2011).
Rather than focusing on a single correct answer, the ELKS instrument provides an important contribution to early literacy assessment as an assessment tool that more finely differentiates children in terms of different levels of understanding. As stated in the introduction, this study provides the initial step to evaluate psychometrically whether the data drawn from the instrument can be useful for informing early literacy teaching. Further investigation is needed to determine how the responses of individual children to the ELKS instrument may change over time and how they relate to other learning outcomes.
In conclusion, this initial investigation of the psychometric properties of the ELKS instrument suggests the developmental progression generated from the data generally supports Ferreiro and Teberosky’s (1979/1982) theory of early literacy development. This article demonstrates how item response modeling can be useful for examining the psychometric properties of the instrument in relation to a theorized developmental progression. Although more work is needed to refine the ELKS instrument, the analysis helps to highlight areas in the instrument that may require further investigation. Further research is also needed to determine how the instrument can be used to inform early literacy teaching in practice.
Footnotes
Acknowledgements
This article is based on the author’s doctoral thesis titled Standardised Assessment in Early Literacy: Reconciling Different Perspectives and Methods. The author wishes to thank Associate Professors Esther Care and Margaret Brown for their support in this research. The parents, children, and teachers who participated in this research and members of the Young Learners’ Project are gratefully acknowledged. The helpful comments from Professor Margaret Li-min Wu on prior drafts of this article are greatly appreciated.
Declaration of Conflicting Interests
The author(s) declared no potential conflicts of interest with respect to the research, authorship, and/or publication of this article.
Funding
The author(s) disclosed receipt of the following financial support for the research, authorship, and/or publication of this article: This research was funded by the Australian Research Council in conjunction with its partner organizations the University of Melbourne and the Australian Scholarships Group. The author was a recipient of the Australian Postgraduate Award (Industry) supported under the Australian Research Council’s Linkage Projects funding scheme (Project No. LP0883437).