
Abstract
Self-determination theory (SDT) has contributed greatly to our understanding of human motivation. Based on SDT, the Academic Motivation Scale (AMS) was developed to assess students’ motivation to learn. AMS has been successfully applied to the educational context in Western cultures. However, no psychometrically validated version is available in China. The present study aimed to revise and validate AMS in China. The AMS was administered to 882 traditional high school students and 419 vocational high students. A retest was administered to 67 traditional high school students 2 months later. Confirmatory factor analysis (CFA) demonstrated that the seven-factor model fitted the data well in both samples. Further analysis revealed that each subscale showed satisfactory Cronbach’s alpha and test–retest reliability. The AMS also showed significant correlations with criteria such as basic psychological needs, school satisfaction, perceived autonomy in the classroom, and other motivational counterparts, demonstrating good criterion-related validity. Group comparison showed that traditional high school students were more intrinsically motivated, less extrinsically motivated, and less amotivated than vocational high school students, providing support for its discriminant validity. In conclusion, the Chinese version of AMS was psychometrically sound and could be applied in China.
Introduction
As one of the most studied topics in educational psychology over the past 30 years, motivation has been demonstrated to have significant influences on various academic outcomes, such as academic achievement (Côté & Levine, 2000; Fortier, Vallerand, & Guay, 1995a; Meece, Anderman, & Anderman, 2006; Zimmerman, Bandura, & Martinez-Pons, 1992), intention to drop out (Alivernini & Lucidi, 2011; Legault, Green-Dermers, & Pelletier, 2006; Vallerand, Fortier, & Guay, 1997), and absenteeism (Moore, Armstrong, & Pearson, 2008; Otis, Grouzet, & Pelletier, 2005). Many motivation theories have been proposed, and one of the most far-reaching theories is the self-determination theory (SDT; Deci, Vallerand, Pelletier, & Ryan, 1991; Ryan & Deci, 2000).
SDT is a macro-theory that concerns the function of personality and human development in different contexts (Deci & Ryan, 1985). Self-determination refers to the sense of choice an individual feels when he can initiate and control his actions or behaviors. Theorists consider motivation as a continuum of self-determination. Amotivation constitutes one end of the motivational continuum with the lowest level of self-determination. Amotivated individuals believe that their actions are determined by things out of their control, and they therefore lose the intent or drive to pursue an activity. Extrinsic motivation makes up the middle part of the motivational continuum. Extrinsically motivated individuals pursue an activity for a sense of obligation or as a means to an end. Lying at the other end of the motivational continuum is intrinsic motivation. Intrinsically motivated individuals engage in an activity just for the satisfaction or pleasure directly derived from it (Ryan & Deci, 2000). Researchers further distinguished between different forms of extrinsic motivation (Deci & Ryan, 1985) and intrinsic motivation (Vallerand, Blais, Brière, & Pelletier, 1989). Specifically, they divided extrinsic motivation into External Regulation (EMER), Introjected Regulation (EMIN), and Identified Regulation (EMID). Intrinsic motivation was divided into Intrinsic Motivation to Know (IMTK), Intrinsic Motivation to Accomplish (IMAC), and Intrinsic Motivation to Experience Stimulation (IMTE). It should be noted that, however, while the three extrinsic motivations are ordered along the continuum, the three intrinsic motivations are “conceptually at the same level on the self-determination continuum” (Carbooneau, Vallerand, & Lafrenière, 2012). Their relative locations on the continuum are shown in Figure 1.

Motivational continuum.
The application of SDT in academic contexts resulted in the construction of the Academic Motivation Scale (AMS; Vallerand et al., 1989; Vallerand et al., 1992). AMS consists of an amotivation subscale, three extrinsic motivation subscales, and three intrinsic motivation subscales. The psychometric properties of AMS have been examined in several countries, including Canada (Guay, Morin, Litalien, Valois, & Vallerand, 2015; Vallerand et al., 1992), the United States (Cokley, 2000; Cokley, Bernard, Cunningham, & Motoike, 2001; Fairchild, Horst, Finney, & Barron, 2005), Britain (Baker, 2004), Greece (Barkoukis, Tsorbatzoudis, Grouios, & Sideridis, 2008), Argentina (Stover, Iglesia, Boubeta, & Liporace, 2012), and Ghana (Akoto, 2014). Most studies found acceptable reliability and temporal stability for each subscale. Regarding its structural validity, although most studies championed the seven-factor structure over the five-factor structure or three-factor structure, some studies found inadequate model fit (Cokley et al., 2001; Vallerand et al., 1992). Furthermore, if the motivational continuum hypothesis does hold true, namely, the simplex structure, stronger positive correlations between adjacent than distant motivations are to be expected (Vallerand et al., 1993). However, previous studies produced mixed results (Guay et al., 2015; Vallerand et al., 1993). More evidences are needed to further clarify these problems.
We must be aware that most of the studies mentioned above were conducted in Western contexts. Will the seven-factor structure hold in eastern cultures, such as China? What is the correlation pattern like in Chinese culture? Because researchers’ enthusiasm on academic motivation would never fade, a cross-culturally validated instrument is a prerequisite for a deeper understanding of academic motivation itself and its impact on academic outcomes. In addition, a cross-cultural examination of AMS will also contribute to the validity of SDT.
Therefore, the present study attempted to revise the AMS into Chinese and examine its psychometric properties. Specifically, we aimed to address four research questions: (a) the factor structure underlying AMS; (b) the reliability of each subscale, including the Cronbach’s alpha and test–retest reliability; (c) the correlation pattern between subscales; and (d) criterion-related validity.
As for the criterion-related validity of AMS, we mainly focused on its relationship with motivational antecedents, consequences, and counterparts. In accordance with SDT, the fulfillment of three basic psychological needs, namely, the need for competence, the need for autonomy, and the need for relatedness, is a necessary precursor to intrinsic motivation (Deci & Ryan, 1985; Fortier, Vallerand, & Guay, 1995b). It can be predicted that students whose basic psychological needs are better satisfied are more likely to be intrinsically motivated. More specifically, if students’ school-related basic psychological needs are satisfied, they are likely to show higher level of intrinsic academic motivation. Therefore, the general fulfillment of basic psychological needs and perceived autonomy in learning environments were adopted as motivational antecedents. As defined, intrinsic motivation means doing an activity for its inherent satisfaction (Vallerand et al., 1992). Therefore, the more students are intrinsically motivated, the more they will enjoy school life and thus be more satisfied (Ryan & Deci, 2000). For example, Ratelle, Guay, Vallerand, Larose, and Senécal (2007) found that when moving from external regulation to intrinsic motivation, the predictive power of motivation on school satisfaction increased monotonically. In addition, evidence found in organizational research provided further evidence for the relationship between motivation and satisfaction. For example, researchers found that intrinsically motivated workers were more likely to be satisfied with their work than extrinsically motivated workers (Gagné et al., 2010; Millette & Gagné, 2008; Stringer, Didham, & Theivananthampilla, 2011). Accordingly, we predicted that intrinsic academic motivation would be more predictive of school satisfaction than extrinsic motivation. Therefore, school satisfaction was chosen as a motivational consequence. Furthermore, the Extrinsic and Intrinsic Motivation subscales of Motivated Strategies for Learning Questionnaire (MSLQ) were chosen as counterparts of AMS to examine its construct validity. Higher positive correlations are expected between the same constructs. Previous studies have also shown that vocational students study for more extrinsic reasons than intrinsic ones (Berings & DeFruyt, 1991; Jacobs, 1994). Many of them are even amotivated (Creten, Lens, & Simons, 2001). Therefore, these differences are expected to be revealed by AMS as well.
Method
Participants
The sample consists of 882 Grade 10 students (478 female) from three traditional high schools and 419 Grade 10 students (132 female) from two vocational schools, Mage-traditional = 15.89, SDage-traditional = 0.97, Mage-vocational = 16.07, SDage-vocational = 1.02.
Measures
The AMS and Learning Climate Scale (LCS) were translated into Chinese, blindly back-translated into English, and then translated into Chinese again by two researchers proficient in Chinese and English to avoid any potential misunderstandings and ensure translation accuracy. Some slight modifications in phrasing were made to make items more appropriate for Chinese students.
Academic Motivation Scale (AMS)
The AMS contains 28 items, 4 items per subscale. Participants rated how those statements apply to them on a 7-point Likert-type scale. A higher score indicates higher level of academic motivation, except for the Amotivation subscale, in which a higher score indicates lower level of motivation. Its psychometric properties were reported in the “Results” section in detail.
School Satisfaction (SS)
The SS is an eight-item one-factor scale designed to measure students’ satisfaction with school life. It is adopted from the Multidimensional Students’ Life Satisfaction Scale (MLSSS, Huebner, 1994). Its psychometric properties have been established in Chinese culture (Leung, McBridge-Chang, & Lai, 2004; Liu, Tian, & Gilman, 2005). Participants rated to what degree they agreed with those statements on a 6-point Likert-type scale. A higher total score indicates higher level of school satisfaction. The alpha coefficient was .86 in the present study.
Learning Climate Scale (LCS)
The LCS is a 15-item SDT-based one-factor scale that measures the perceived autonomy provided by instructors (Williams & Deci, 1996). The LCS has been used in many studies (Black & Deci, 2000; Williams, Saizow, Ross, & Deci, 1997). Participants rated to what degree they agreed with those statements on a 7-point Likert-type scale. A higher score reflects higher level of perceived autonomy in learning environments. The alpha coefficient was .93 in the present study. Confirmatory factor analysis (CFA) showed that a single factor model fitted the data well in the present study, Satorra–Bentler chi-square (S-B χ2) = 632.95, df = 90, comparative fit index (CFI) = .92, and root mean square error of approximation (RMSEA) = .07.
Basic Psychological Needs Scale (BPNS)
The BPNS is also an SDT-based 21-item scale that measures the degree to which individuals’ basic psychological needs are satisfied (Gagné, 2003). It contains three subscales that measure the need for autonomy, the need for competence, and the need for relatedness. The BPNS has been used in several domains (Deci et al., 2001; Milyavskaya & Koestner, 2011; Weinstein & Ryan, 2010). The three-factor structure demonstrated good fit to a Chinese sample (Guo et al., 2014). Participants rated to what degree they agreed with those statements on a 7-point Likert-type scale. The alpha coefficients were .62, .62, and .76 for the Autonomy subscale, Competence subscale, and Relatedness subscale, respectively, in the present study.
Intrinsic and Extrinsic Motivation Scale (IEMS)
The eight-item IEMS assesses students’ intrinsic and extrinsic academic motivation. It is adopted from the Motivated Strategies for Learning Questionnaire (MSLQ; Pintrich, Smith, García, & McKeachie, 1993). Its psychometric properties have been validated in both Western (Hilpert, Stempien, van der Hoeven Kraft, & Husman, 2013) and Chinese culture (Rao, Moely, & Sachs, 2000; Rao & Sachs, 1999). Each item is scored on a scale ranging from 1 (strongly disagree) to 7 (strongly agree). A higher score reflects higher level of academic motivation. The alpha coefficients were .73 for the Intrinsic Motivation subscale and .75 for the Extrinsic Motivation subscale in the present study.
Procedure
School coordinators arranged the time for all participants to complete the questionnaire battery at a fixed time. Each class was equipped with a trained research assistant. Standardized instruction about the purpose of the study was delivered first. Students were reminded to complete the battery all by themselves. The head teacher of each class was also present to keep order. When they finished, students handed in the battery directly to the research assistant. Two months later, 67 traditional high school students participated in the retest, which followed the same procedure.
Statistical Analysis
Data missing rate in this study was below 2%. To avoid reduction in variances/covariances among observed variables, we adopted the multiple imputation method proposed by Schafer (1997) to handle missing data, which is by default in Mplus 7.1. We first conducted three CFAs to compare competing theoretical models to explain the relationships among observed variables using Mplus 7.1. For its robustness to possible violations of normality assumption, estimation was based on the maximum likelihood estimation with robust standard errors (MLM; Muthén & Muthén, 1998-2012). The S-B chi-square, RMSEA, and CFI were adopted as three primary indexes to evaluate model fitness. RMSEA less than .06 and CFI more than .90 indicate adequate fit (Hu & Bentler, 1999). No residual correlations were allowed, and correlations among factors were freely estimated.
In addition to CFA, researchers examined the internal consistency reliability and test–retest reliability of each subscale. Criterion-related validity was also examined by relating it to various criteria. All analyses were performed using SPSS 17.0.
Results
Factor Analysis
Three competing CFA models were tested: (a) a seven-factor model based on Vallerand et al.’s (1992) proposal; (b) a five-factor model in accordance with Deci and Ryan’s (1985) definition of theory of self-determination, which made no differentiation of intrinsic motivation; and (c) a three-factor model with an amotivation factor, a general intrinsic motivation factor, and a general extrinsic motivation factor. Two sets of CFAs were performed in the traditional high school sample and vocational high school sample separately. Factor analysis results were shown in Table 1. As observed, the seven-factor model fitted the data best in both samples, which supported the original proposal. Examination of the factor loadings revealed that only factor loadings of Item 1 and Item 7 fell below .60 (.57 and .59, respectively) in the traditional high school sample. In the vocational high school sample, only factor loadings of Item 1 and Item 21 fell below .60 (.53 and .54, respectively). Most of the factor loadings were above .70 (see Table 2) in both samples.
Model Fit Statistics for the Three Competing Academic Motivation Models.
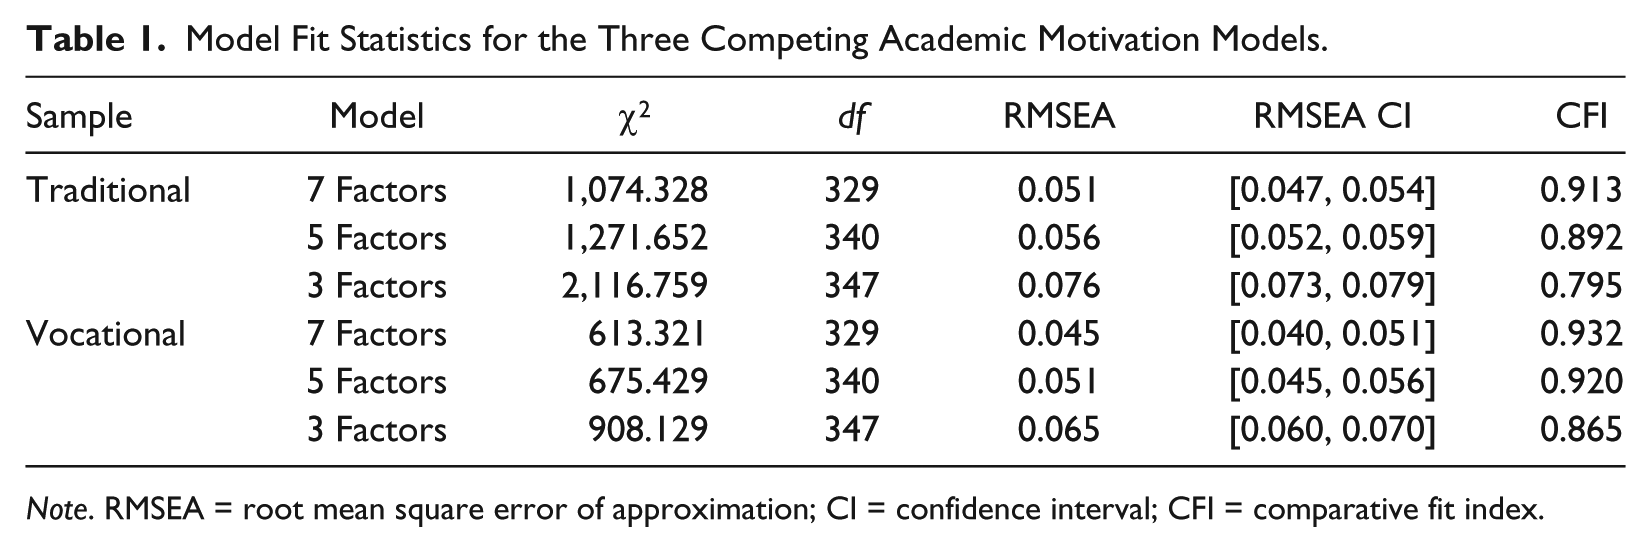
Note. RMSEA = root mean square error of approximation; CI = confidence interval; CFI = comparative fit index.
Standardized Factor Loadings for Each Sample.

Note. Values in parentheses are standard errors of factor loadings. AM = Amotivation; EMER = External Regulation; EMIN = Introjected Regulation; EMID = Identified Regulation; IMTK = Intrinsic Motivation to Know; IMAC = Intrinsic Motivation to Accomplish; IMTE = Intrinsic Motivation to Experience Stimulation.
Reliability
Given the adequate fitness of the seven-factor model, Cronbach’s alpha and test–retest correlations were calculated for the seven subscales (see Table 3). The seven subscales demonstrated acceptable internal consistency reliability and temporal stability, except the EMID subscale, whose test–retest reliability was .57.
Reliability, Means, Standard Deviations and Correlation Matrix of the Seven Subscales.

Note. Latent variable correlations were reported. Correlations above the diagonal were computed from the vocational high school sample and correlations below the diagonal were computed from the traditional high school sample. MT refers to the mean of the traditional sample; MV refers to the mean of the vocational sample. AM = Amotivation; EMER = External Regulation; EMIN = Introjected Regulation; EMID = Identified Regulation; IMTK = Intrinsic Motivation to Know; IMAC = Intrinsic Motivation to Accomplish; IMTE = Intrinsic Motivation to Experience Stimulation.
p < .01.
Simplex Structure
To test the motivational continuum hypothesis, we investigated the correlation pattern between the AMS subscales. Correlations among latent constructs were obtained from CFAs to reduce measurement error. In both samples, external regulation showed equal or stronger correlation with EMID (rt = .59 and rv = .73 1 ) than with EMIN (rt = .59 and rv = .65). At the same time, EMIN showed higher correlations with IMAC (r = .70) than with identified motivation (r = .59) in the traditional sample. In the vocational sample, EMIN showed higher correlations with IMTK (r = .85) and IMAC (r = .94) than with EMID (r = .83). In total, the results did not support the motivational continuum hypothesis.
Criterion-Related Validity
In accordance with previous sections, we also computed correlations between AMS subscales with different criteria separately. Descriptive statistics are shown in Table 4.
Correlational Statistics of AMS and Criterion.

Note. AM = Amotivation; EMER = External Regulation; EMIN = Introjected Regulation; EMID = Identified Regulation; IMTK = Intrinsic Motivation to Know; IMAC = Intrinsic Motivation to Accomplish; IMTE = Intrinsic Motivation to Experience Stimulation; LC = Learning Climate; AU = Autonomy; CO = Competence; RE = Relatedness; SS = School Satisfaction; IN = Intrinsic Motivation; EM = Extrinsic Motivation.
p < .05. **p < .01.
In both samples, AM showed stronger negative correlation with IN (rt = −.33 and rv = −.37) than with EM (rt = −.06 and rv = −.23). The three intrinsic motivation subscales showed higher correlations with IN (rt = .49–.57 and rv = .56–.62) than with EM (rt = .13–.26 and rv = .41–.44). EMER showed a stronger correlation with EM (rt = .46 and rv = .47) than with IN (rt = .06 and rv = .34). In the traditional sample, EMIN showed stronger correlation with EM (rt = .47) than with IN (rt = .33). In the vocational sample, EMIN showed nearly the same degree of correlation with both EM (r = .52) and IN (r = .58). However, EMID showed a higher correlation with IN (rt = .34 and rv = .54) than with EM (rt = .29 and rv = .44), which is contrary to our expectation. In addition, amotivation showed significant negative correlations with both motivational antecedents (rt = −.43−.30 and rv = −.38−.28) and motivational consequences (rt = −.61 and rv = −.53). When moving from amotivation to the more self-determined end of the continuum, correlation magnitude between AMS subscales and motivational antecedents/consequences displayed a monotonically increasing pattern in the traditional sample. Although the correlation pattern was not strictly monotonic in the vocational sample, the general pattern still showed an increasing trend.
Differences Between Student Types
As shown in Table 5, vocational high school students displayed higher level of amotivation than traditional high school students (t = 8.09, p < .001, Cohen’s d = 0.45). In addition, vocational students were more externally regulated (t = 3.81, p < .001, Cohen’s d = 0.21) than traditional high school students. Traditional high school students were found to be more intrinsically motivated than vocational school students (t = 2.95–6.21, ps < .01, Cohen’s d = 0.16–0.36), as anticipated. Contrary to expectation, however, traditional high school students scored higher on the EMID subscale (t = 2.54, p = .01, Cohen’s d = .24). They showed the same level of introjected motivation (p = .23).
Test of Group Differences.
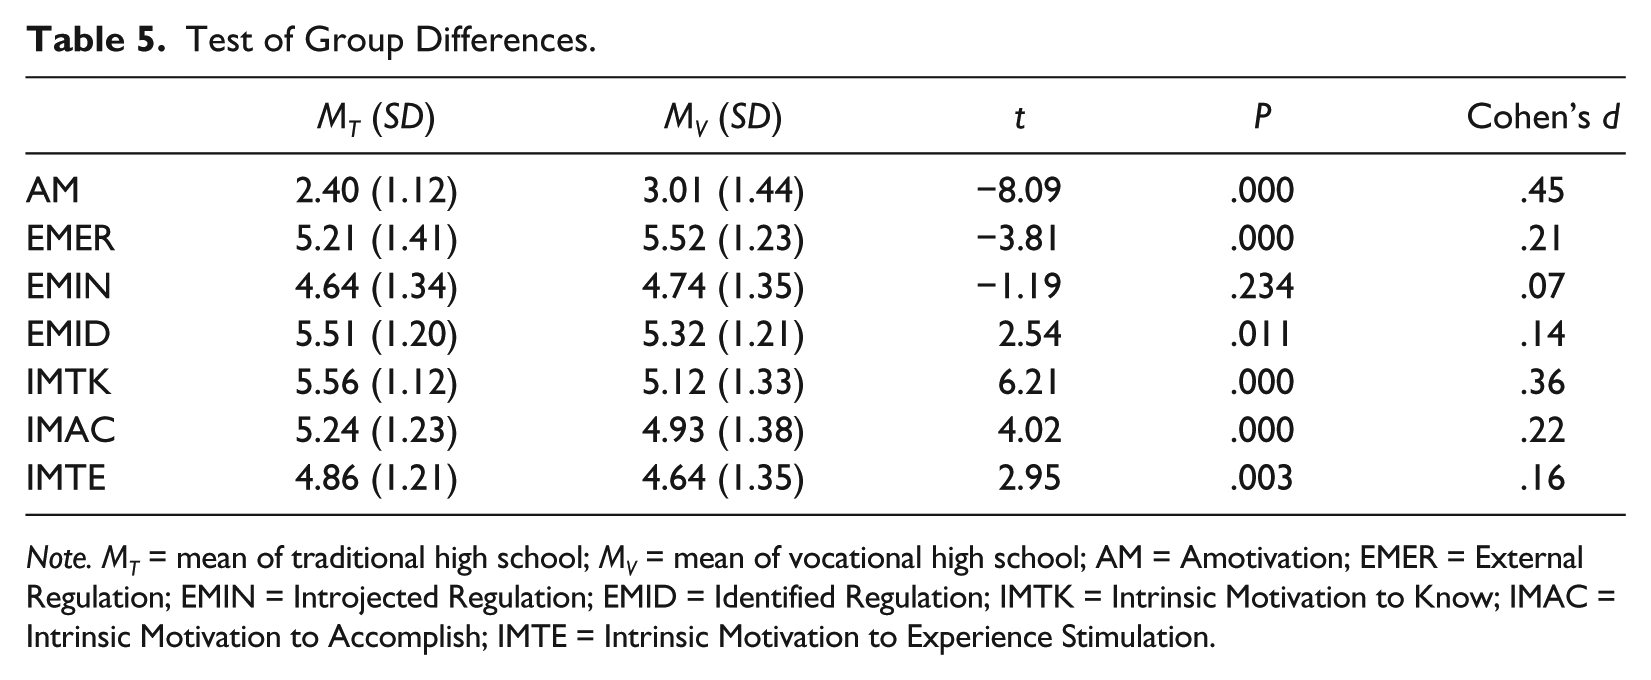
Note. MT = mean of traditional high school; MV = mean of vocational high school; AM = Amotivation; EMER = External Regulation; EMIN = Introjected Regulation; EMID = Identified Regulation; IMTK = Intrinsic Motivation to Know; IMAC = Intrinsic Motivation to Accomplish; IMTE = Intrinsic Motivation to Experience Stimulation.
Discussion
Although the factorial structure of AMS has been extensively studied in Western countries, little information is available about AMS in eastern cultures. The current study investigated the factorial structure, reliability, and validity of the AMS in China and found support for its use in Chinese culture.
Consistent with the original hypothesis (Vallerand et al., 1992), two separate sets of CFAs both demonstrated that the seven-factor model outperformed the five-factor and three-factor models. Unlike results of some previous studies (Stover et al., 2012; Vallerand et al., 1992), adequate fitness of the seven-factor model was achieved without the addition of any error covariances, let alone the deletion of items. Inspection of factor loadings revealed that 18/28 and 19/28 loadings exceeded .70 in the two samples, respectively, and the lowest loading was .53, indicating that most items adequately measure the construct. Therefore, the seven-factor model fits in Chinese culture as well.
Acceptable Cronbach’s alpha was found for each subscale. Furthermore, higher Cronbach’s alpha was found for EMID than in many previous studies (Cokley et al., 2001; Stover et al., 2012; Vallerand et al., 1992, 1993), where the EMID subscale was usually proven to be less reliable. Considering the long test-retest interval, the present study also found acceptable test–retest reliability for the three intrinsic motivation subscales, EMIN, EMER, and AM, which is in accordance with previous studies (Barkoukis et al., 2008; Vallerand et al., 1992). Also consistent with previous studies (Ratelle, Guay, Larose, & Senécal, 2004), relatively lower test–retest reliability was found for the EMID subscales. This difference may be explained by the longer test–retest interval of the present study. A longer interval may lead to greater fluctuations in students’ extrinsic motivation (Allen & Yen, 1979/2002).
As with many previous SDT-based motivation studies (Chemolli & Gagné, 2014; Fairchild et al., 2005; Guay et al., 2015; Webb, Soutar, Mazzarol, & Saldaris, 2013), this study also called the motivational continuum hypothesis into question. Many explanations could account for this result, such as the indistinctiveness of the three intrinsic motivation subscales (Carbonneau, Vallerand, & Lafrenière, 2012), or the inappropriate analytic techniques (Guay et al., 2015). However, the fact that much more evidences are against the motivational continuum than supporting it leads us to believe that the hypothesis itself may be untenable. If motivational regulations indeed differ in degree instead of kind, they should be clustered into one dimension, which is apparently not the case (Guay et al., 2015; Vallerand et al., 1992). Even recent neuroscientific evidences supported qualitative differences instead of quantitative differences among different motivational regulations (Lee, Reeve, Xue, & Xiong, 2012; Ryan, Kuhl, & Deci, 1997). Therefore, different motivational regulations should reflect different motivation types.
As expected, amotivation showed negative correlations with both motivational antecedents and consequences. When the learning environment is less autonomy-supportive or individuals’ basic psychological needs are less satisfied, their behaviors are less self-determined. Therefore, they would fail to see the contingencies between their actions and the consequences (Pelletier, Fortier, Vallerand, & Briére, 2001). Amotivated individuals had no sense of purpose, no expectation of reward, and no expectation that the present course of events could be changed; thus, they were less satisfied with their surroundings (Lachapelle et al., 2005). When moving from external regulation to the three intrinsic motivation types, correlations with all validity criteria followed a strict monotonically increasing pattern in the traditional sample and a general increasing trend in the vocational sample as well. In sum, the evidence strongly supported the validity of inferences made from AMS scores.
The finding that vocational students are more amotivated is consistent with previous studies. Researchers found that vocational students displayed more amotivated behaviors such as disrupting classrooms activities and truancy (Molnar & Lindquist, 1989; Olweus, 1993). In line with a previous study (Jiang & Yu, 2006), vocational students are also more externally regulated and less intrinsically motivated. It is in accordance with reality. Students who are from relatively low-income families or underachieve in traditional school are more likely to attend vocational school (Yu, 2010). On one hand, they have to acquire necessary work skills to make a living, which is definitely an external drive. On the other hand, researchers found that they usually show low interest in learning challenging knowledge, which may account for their lower level of intrinsic motivation (Creten, Lens, & Simons, 1998). As the EMID subscale measures the internalized extrinsic motives (e.g., a student is willing to devote much extra effort to C++ because he believes it is important for continuing success at programming), an identified regulator has attributed personal value to their behaviors (Vallerand et al., 1992). It is no surprise, therefore, that traditional high school students scored higher on this subscale.
Although the current study provided some initial evidences for the cross-cultural applicability of AMS, much more work is needed. First, cross-cultural measurement invariance should be an important issue for future studies. Measurement invariance refers to the extent to which item responses preserve their meaning across populations (Millsap & Kwok, 2004). Equivalence of measurement model is a prequisite for further theoretical interpretations of group differences and examination of cross-cultural applicability of theories and models (Sue, 1999). Meanwhile, correlations among the three intrinsic motivation subscales were very high and there was no substantial difference of fit indexes (e.g., RMSEA) between the seven-factor model and five-factor model, indicating lack of discriminant validity of the three subscales. We chose to conform to the well-documented seven-factor structure because the present study was mainly intended to introduce the AMS into Chinese culture. Future studies, however, should delve further to explore the feasibility and necessity of dividing intrinsic motivation into sub-dimensions from a psychometric perspective.
In summary, the present study revised the AMS into Chinese and validated its psychometric properties against various criteria. The results are consistent with studies performed in other countries. Therefore, we conclude that the Chinese version is sufficiently suitable for research with Chinese high school students.
Footnotes
Acknowledgements
We sincerely thank Xiang Qin Shen from the Affiliated High School of Beijing Normal University, Jing Yi Liu from Chaoyang Branch of Beijing Institute of Education, and You Peng Chen from Beijing Xinxian Hutong Elementary School, without whose help the present research would not be carried out so fluently. Also, we deeply appreciate the help of the Affiliated High School of Beijing University of Technology Beijing No. 17 High School, Beijing Electrical Engineering School, and Beijing Qiushi Vocational School.
Declaration of Conflicting Interests
The author(s) declared no potential conflicts of interest with respect to the research, authorship, and/or publication of this article.
Funding
The author(s) disclosed receipt of the following financial support for the research, authorship, and/or publication of this article: This research was supported by Beijing Higher Education Young Elite Teacher Project YETP0247 and Ministry of Education in China Project of Humanities and Social Sciences Project 09YJCXLX001.