



Abstract
This comprehensive evaluation of the Dynamic Indicators of Basic Early Literacy Skills Sixth Edition (DIBELS6) set of measures gives a practical illustration of signal detection methods, the methods used to determine the value of screening and diagnostic systems, and offers an updated set of cut scores (decision thresholds). Data were drawn from a sample of 13,507 English-proficient students in kindergarten through Grade 3, with more than 4,500 students per grade level. Results indicate that most DIBELS6 measures accurately predict comprehensive test performance and that previously published decision thresholds for DIBELS6 are generally appropriate with some key exceptions. For example, the performance of phoneme segmentation fluency did not always meet expectations. The revised DIBELS6 decision thresholds can satisfactorily identify students who may require additional supports.
Keywords
Screening instruments have risen to prominence in education due to the need to identify students as being at risk of poor reading and other outcomes. The practical benefits of universal screening include efficient measurement and the opportunity to prevent more serious deficits. Screening systems can help teachers make more efficient and effective instructional decisions (e.g., Stecker, Fuchs, & Fuchs, 2005) and reduce disproportionality in special education referrals (Marston, Muyskens, Lau, & Canter, 2003). This article uses signal detection methods to evaluate and select optimal cut scores (decision thresholds) for Dynamic Indicators of Basic Early Literacy Skills (DIBELS) Sixth Edition (DIBELS6, Good & Kaminski, 2002) using a large sample of English-proficient students from kindergarten through Grade 3.
The complete evaluation of the DIBELS6 diagnostic system involves a description of the overall accuracy of the measures and a selection of specific scores that optimally identify students with reading difficulties. An evaluation of DIBELS6 measures is needed because schools continue to utilize the DIBELS6 materials, despite the release of DIBELS Next. The data system at the University of Oregon (https://dibels.uoregon.edu/), for example, included DIBELS6 scores for approximately 336,000 students in 2,100 schools from the 2013-2014 school year; many more have been assessed with DIBELS6 by schools that use a different or no data system. The wide use of DIBELS6 and its highly publicized benchmark goals for decision making have continued without published, peer reviewed works that examine cut points for all measures from kindergarten to Grade 3. Finally, since the release of DIBELS Next in 2010, no peer reviewed research had evaluated the goal-setting procedures or thresholds. A search of the PsycINFO database from 2010 to 2015 produced four publications that reported on DIBELS Next measures, and none explored the topic of decision thresholds.
This article presents the first thorough evaluation of DIBELS6 as a diagnostic system and offers accuracy standards that competing screening systems would ideally exceed. With 13,507 students proficient in English, 4,600 to 5,600 per grade, our analysis offers high precision and reduced potential confounding related to English language ability.
Prevention-Oriented Universal Screening
Universal screening for risk in the domain of educational achievement was relatively novel at the turn of this century, although screeners were common in special education. The more widespread use of screening in regular education was catalyzed by federal legislation, based in part on research showing that achievement deficits became increasingly intractable after Grade 4 (Juel, 1988). Universal screening was codified in a practice guide distributed by the Institute of Education Sciences (Gersten et al., 2008) that lists universal screening as the first step in any Response to Intervention model. Key features include assessment of all students at the beginning and middle of each school year, measures that efficiently capture essential academic skills, and empirically derived cut scores that accurately identify students at risk of poor academic outcomes. The primary aim of cut scores is to improve the objectivity and consistency of decisions about potential deficits and allow for remediation as early as possible. Many screening systems, however, do not have published, empirically evaluated decision thresholds conducted with appropriate methods (Smolkowski & Cummings, 2015).
Evolution of DIBELS
Good, Simmons, and Kame’enui (2001) described the use of reading measures that would align to the critical areas in beginning reading (see also Kaminski & Good, 1996, 1998) and predict end-of-year state test performance. Their results underscored the importance of screening all students, an early call to the use of predictive cut scores in the fall and winter as a way to identify students in need of instructional support. The methods in their article were not new (cf. Swets, 1973) but transformed how teachers used assessment data for decisions.
The use of DIBELS in schools has since evolved to include, by conservative estimates (Cummings, Park, & Bauer Schaper, 2012), participation of nearly one in six U.S. public school students in kindergarten through Grade 3. Widespread use warrants an updated investigation of the optimal cut scores for DIBELS6. The basic procedures used to determine the initial decision thresholds in Good et al. (2001) and Good, Simmons, Kame’enui, Kaminski, and Wallin (2002) were determined by multiple and sometimes ambiguous criteria. For example, Good et al. (2001) specified that all Grade 1 students should read 40 correct words per minute by the end of the year, a standard that served as the anchor for the system. The choice of this standard, however, was not empirically derived. The authors stated that “a second criterion of an effective goal is rigor or ambitiousness” (Good et al., 2001, p. 267), but the criteria used to translate this goal into cut scores were unclear.
Without knowing the precise criteria for “healthy” performance, it is impossible to gauge the quality of any screener or its cut points (Smolkowski & Cummings, 2015). Good et al. (2001) and Good et al. (2002) often used a later DIBELS6 assessment as a criterion-referenced tool to distinguish the two underlying populations: typically achieving students and students with reading difficulties. This dependence between the diagnostic system under evaluation and the criterion measure, however, likely inflates the appearance of accuracy and may therefore bias decision thresholds (Smolkowski & Cummings, 2015). Good et al. also characterized the overall accuracy of measures with correlations mostly between different DIBELS6 measures collected at different times. Finally, Good and colleagues’ (2001) evaluation of scatterplots essentially relied on predictive values to confirm chosen decision thresholds, which depend on the relative number of students in the samples used to represent each of the two populations of interest (i.e., base rate; Smolkowski & Cummings, 2015).
Research Aims
The present analyses evaluate the ability of DIBELS6 to predict reading problems determined by comprehensive, end-of-year reading assessments in kindergarten through Grade 3. These analyses extend prior research by using external reading tests as criterion measures, drawing on many students from 34 schools across multiple districts, examining only students proficient in English to reduce the potential influence of language proficiency, and providing new decision threshold recommendations. We also introduce the concept of target performance on DIBELS measures. Current thresholds for reading screeners determine levels of risk for reading difficulties. It is natural, however, to anchor expectations on the highest cutoff available (e.g., benchmark; Jacowitz & Kahneman, 1995)—even if it represents minimally acceptable performance. This may lead some teachers to believe that students who meet the highest threshold read at a satisfactory level. As we demonstrate below, some students just above the benchmark threshold may still achieve below the 40th percentile on comprehensive tests. We therefore offer teachers a target performance level that corresponds to a degree of proficiency at which students are likely to meet or exceed standards set by districts or states.
The article addresses four research questions. First, can DIBELS6 measures accurately predict risk levels on comprehensive reading measures administered in the spring of the same year? Second, what are optimal decision thresholds, and do they offer acceptable classification performance? Third, how do optimal thresholds compare with previously established cut scores? Finally, can we produce a target level of performance that teachers can use to motivate a higher level of overall reading skill?
Method
Each Oregon Reading First (ORRF) school collected DIBELS6 data from 2003-2004 to 2005-2006 and administered the Stanford Achievement Test–10th Edition (SAT10; Harcourt Educational Measurement, 2002) at the end of kindergarten and Grades 1 and 2 and the Oregon Assessment of Knowledge and Skills (OAKS; Oregon Department of Education [ODE], 2008) section on reading and literature at the end of Grade 3.
Participants and Setting
This study included students from 34 Oregon schools funded in the first cycle of Reading First (see Baker et al., 2008; Baker et al., 2011; Fien et al., 2008) from 16 independent school districts, half in urban areas and the rest approximately equally divided between mid-size cities and rural areas. Approximately 10% of the students received special education services, 69% of students qualified for free or reduced lunch, and 27% of third graders did not pass minimum proficiency standards on the OAKS when schools enrolled in Reading First. Across Oregon at the same time, 44% qualified for free reduced lunch and 18% of the Grade 3 students did not pass the third-grade OAKS.
Our sample included 13,507 English-proficient students who provided scores on the high-stakes criterion tests. About 32% of the students in the sample were identified as English learners. The 20% of the students who received services for limited English proficiency were removed. As 6,544 students provided data in multiple years, the sample includes a total of 20,051 criterion test scores (see Table 1 for n by grade). Half of the students, 49%, were female, and 6.7% were eligible for special education. Students fell into the following racial-ethnic categories: 57% Caucasian, 22% Hispanic or Latino/Latina, 11% African American, 5% American Indian, 4% Asian, and less than 1% Alaskan Native, Hawaiian, Pacific Islander, or “Other.”
Descriptive Information for English-Language-Proficient Students.
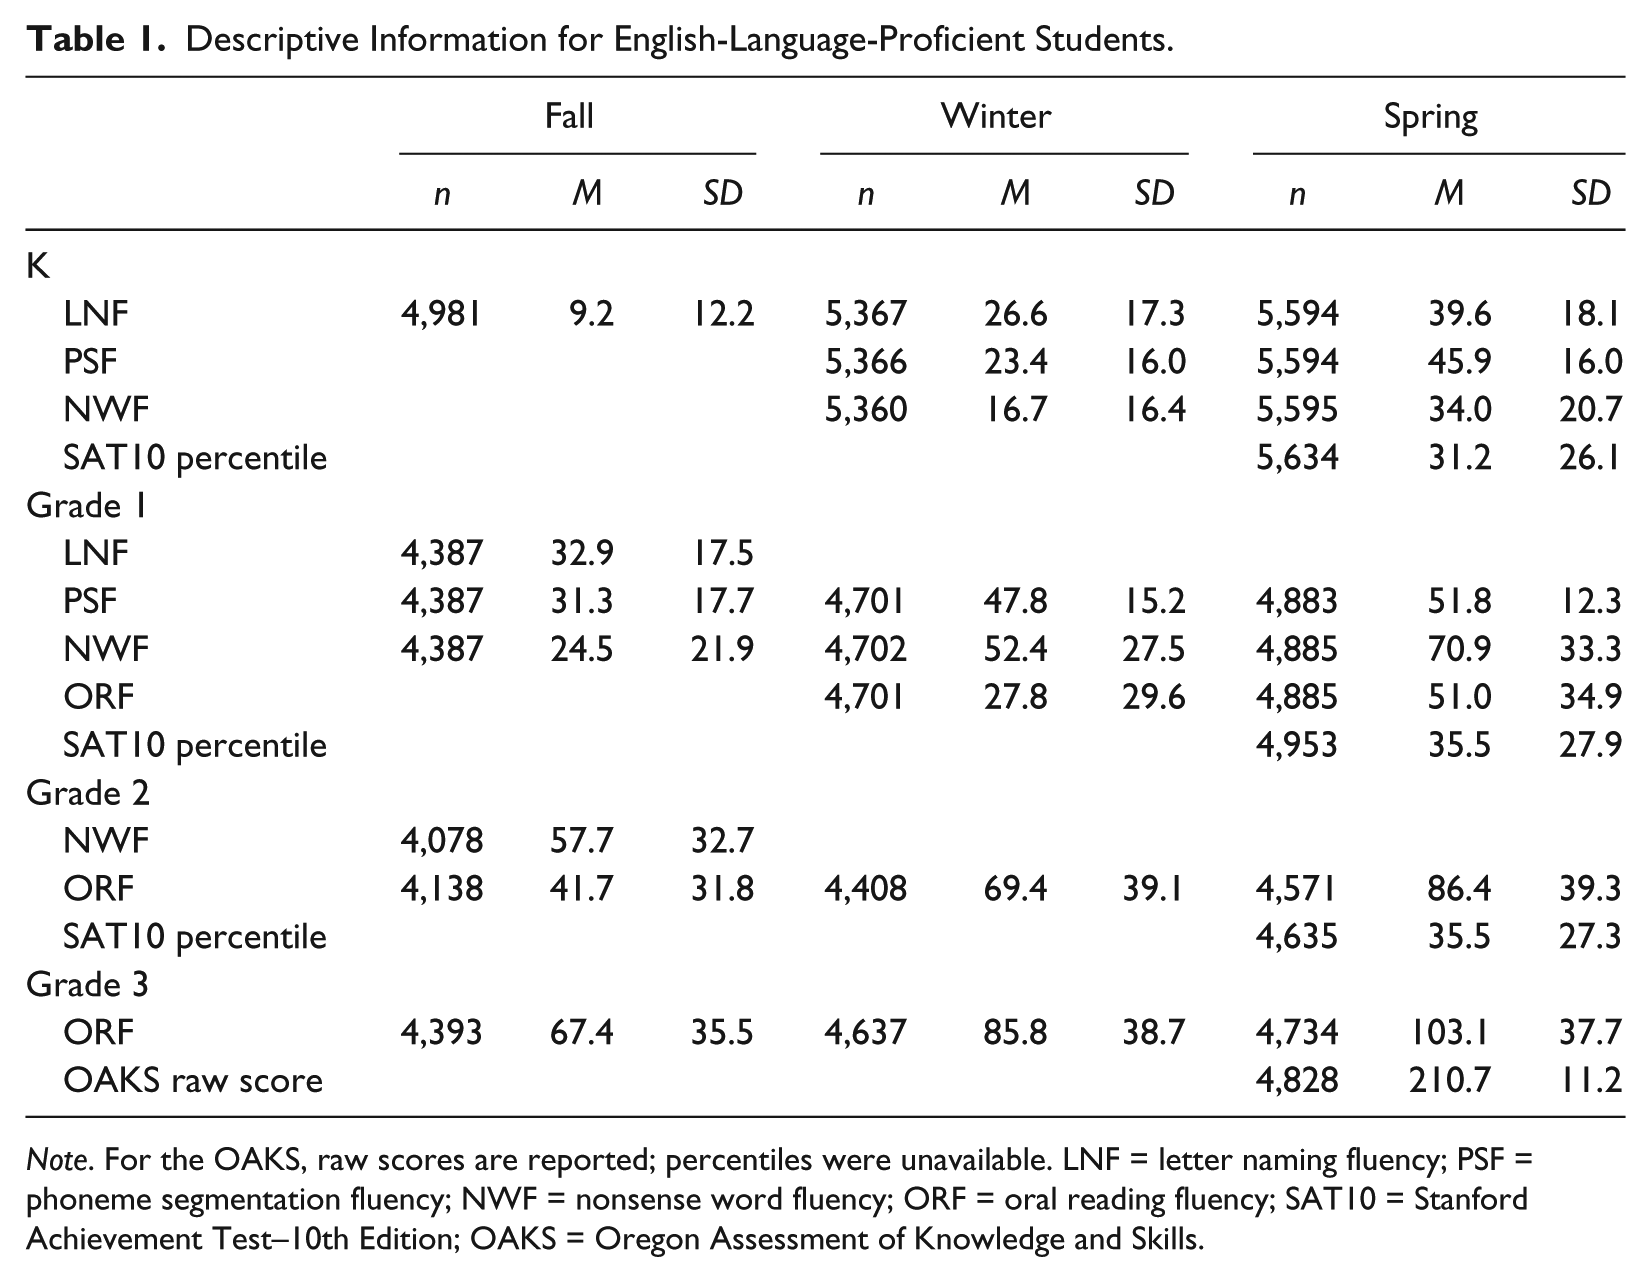
Note. For the OAKS, raw scores are reported; percentiles were unavailable. LNF = letter naming fluency; PSF = phoneme segmentation fluency; NWF = nonsense word fluency; ORF = oral reading fluency; SAT10 = Stanford Achievement Test–10th Edition; OAKS = Oregon Assessment of Knowledge and Skills.
In the fall, winter, and spring, students were administered DIBELS6 measures (Good & Kaminski, 2002), and 88% to 99% of students in kindergarten through Grade 3 participated in the assessments. In the spring, students were administered comprehensive reading tests; about 3% to 4% were excluded due to absences.
Criterion Measures
Stanford Achievement Test, 10th Edition
The SAT10 (Harcourt Educational Measurement, 2002) is a group-administered, norm-referenced test of overall reading proficiency. The measure is not timed. Kuder–Richardson reliability coefficients for total reading scores were .97 at Grade 1 and .95 at Grade 2. Correlations between the total reading score and the Otis–Lennon School Ability Test ranged from .61 to .74. We used the total reading score as our criterion with 2007 norms based on a representative sample of the U.S. student population.
Oregon Assessment of Knowledge and Skills (OAKS)
The OAKS, developed by the ODE (2008), is an untimed, multiple-choice test administered yearly to all Grade 3 students in Oregon. Reading passages represented literary, informative, and practical selections that students might encounter in school settings and other reading activities. Individual subtests require students to understand word meanings in the context of a selection; locate information in common resources; answer literal, inferential, and evaluative comprehension questions; recognize common literary forms, such as novels, short stories, poetry, and folk tales; and analyze the use of literary elements and devices, such as plot, setting, personification, and metaphor. ODE reported criterion validity of .75 with the California Achievement Tests and .78 with the Iowa Tests of Basic Skills. The scores from the four alternate test forms used for the OAKS demonstrated Kuder–Richardson reliability of .95.
DIBELS6
Below, we describe each measure and present technical adequacy. Table 1 indicates administration times. Dynamic Measurement Group (DMG; 2008) summarized test–retest and alternate-form reliability and concurrent and predictive validity estimates for DIBELS6 measures from 26 studies with 29 criterion tests (please consult DMG, 2008, for details).
Letter naming fluency (LNF)
LNF measures the number of randomly ordered uppercase and lowercase letters students name in 1 min. Score reliabilities ranged from .86 to .98 and validity estimates from .31 to .74 (DMG, 2008).
Phoneme segmentation fluency (PSF)
PSF measures phonemic awareness. Students are scored on the number of correct individual phonemes segmented from words read aloud by the examiner in 1 min. Score reliabilities ranged from .74 to .90 and validity coefficients from .43 to .59 (DMG, 2008).
Nonsense word fluency (NWF)
NWF measures alphabetic understanding and phonological recoding ability (Cummings, Dewey, Latimer, & Good, 2011). Students are scored on the number of phonemes they correctly identify from consonant–vowel and consonant–vowel–consonant pseudowords (either individual sounds or whole pseudowords) in 1 min. Score reliabilities ranged from .84 to .98 and validity coefficients from .33 to .82 (DMG, 2008).
Oral reading fluency (ORF)
DIBELS ORF measures fluency with connected text. Students read sets of three passages, 1 min each, and are scored on the median number of correctly read words. Score reliabilities ranged from .89 to .99 and validity estimates from .31 to .97 (DMG, 2008).
Data Collection
DIBELS measures were administered to students by school-based assessment teams in the fall, winter, and spring. Teams received 1-day trainings on DIBELS6 administration and scoring with additional calibration sessions from reading coaches at each school. Test–retest reliabilities ranged from .60 to .83 for PSF scores, .83 to .90 for NWF scores, and .93 to .97 for ORF scores.
Teachers administered the SAT10 and the OAKS each spring. SAT10 testing was monitored by Reading First coaches trained by the ORRF Center. Coaches trained teaching staff in their building on test administration and monitoring. Coaches documented testing procedures with an 18-item implementation fidelity checklist; median fidelity was 98.3%. Teachers administered the OAKS according to procedures established by the school, district, and state.
Analysis Approach
These analyses followed the methods outlined in Smolkowski and Cummings (2015). We first generated receiver operating characteristic (ROC) curves and calculated the area under curve, A, for each measure administered at each time point to evaluate overall accuracy with respect to end-of-year criterion tests. An excellent screener should produce values of A at or above .950, for a good screener, A should range from .850 to .949, and reasonable screeners yield moderate A values from .750 to .849 (Swets, 1988). Values below .75 represent relatively poor diagnostic utility. We believe teacher judgments may be more valuable than the results of a reading screener with A < .75 (Martin & Shapiro, 2011).
The selection of a decision threshold for each level of risk should depend on the anticipated consequences of four potential outcomes: false and true positives and negatives. In situations such as reading, where useful approximations of the full costs and benefits associated with outcomes are unavailable, Swets, Dawes, and Monahan (2000) suggested setting decision thresholds based on sensitivity or specificity. We set decision thresholds based on the complement of sensitivity, the false-negative fraction, so no more than 20% of students from the reading-difficulty population were incorrectly identified as typically achieving (sensitivity = .80). For most decision thresholds, this criterion produced greater sensitivity than specificity, which will allow teachers to generally capture more false positives than false negatives. We believe it is more ethical to provide supplemental instruction that some students may not require than fail to offer such instruction to students who truly need help. At-risk students with false-negative scores will not likely receive intensive supports, but they will still likely have a true-positive score for the some-risk threshold and consequently receive some supplemental instruction. Teachers might also catch typically achieving students incorrectly assigned to small-group instruction (false positive), whereas a student with reading difficulties assigned to standard instruction (false negative) may go unnoticed (Smolkowski & Cummings, 2015).
Our choice of decision thresholds also hinges on the observation that most reading screeners are not highly accurate (i.e., A < .95). Specificity seldom exceeds .80 for the thresholds chosen for sensitivity value .80. Finally, this approach to establishing decision thresholds allows for a consistent interpretation of the cut scores for all measures at all administrations, unlike more ambiguous approaches.
All analyses were conducted with SAS (SAS Institute, 2009) PROC LOGISTIC to estimate A and PROC FREQ for other statistics. For reporting, we followed the STAndards for the Reporting of Diagnostic accuracy studies (STARD; http://www.stard-statement.org/).
Results
Table 1 provides descriptive information for the SAT10, OAKS, and DIBELS6 measures. Tables 2 through 4 present the A, the decision threshold, classification statistics, base rates, ρ, and the proportion screened positive (τ) for each measure. The statistics were defined for students with criterion values at the 20th normative percentile (at risk), 40th percentile (benchmark), and 60th percentile (target) on comprehensive tests collected at the end of the same year each screener was administered. We describe the level of precision surrounding estimates of A, sensitivity, and specificity in table notes.
Optimal Letter Naming Fluency and Phoneme Segmentation Fluency Cut Scores.
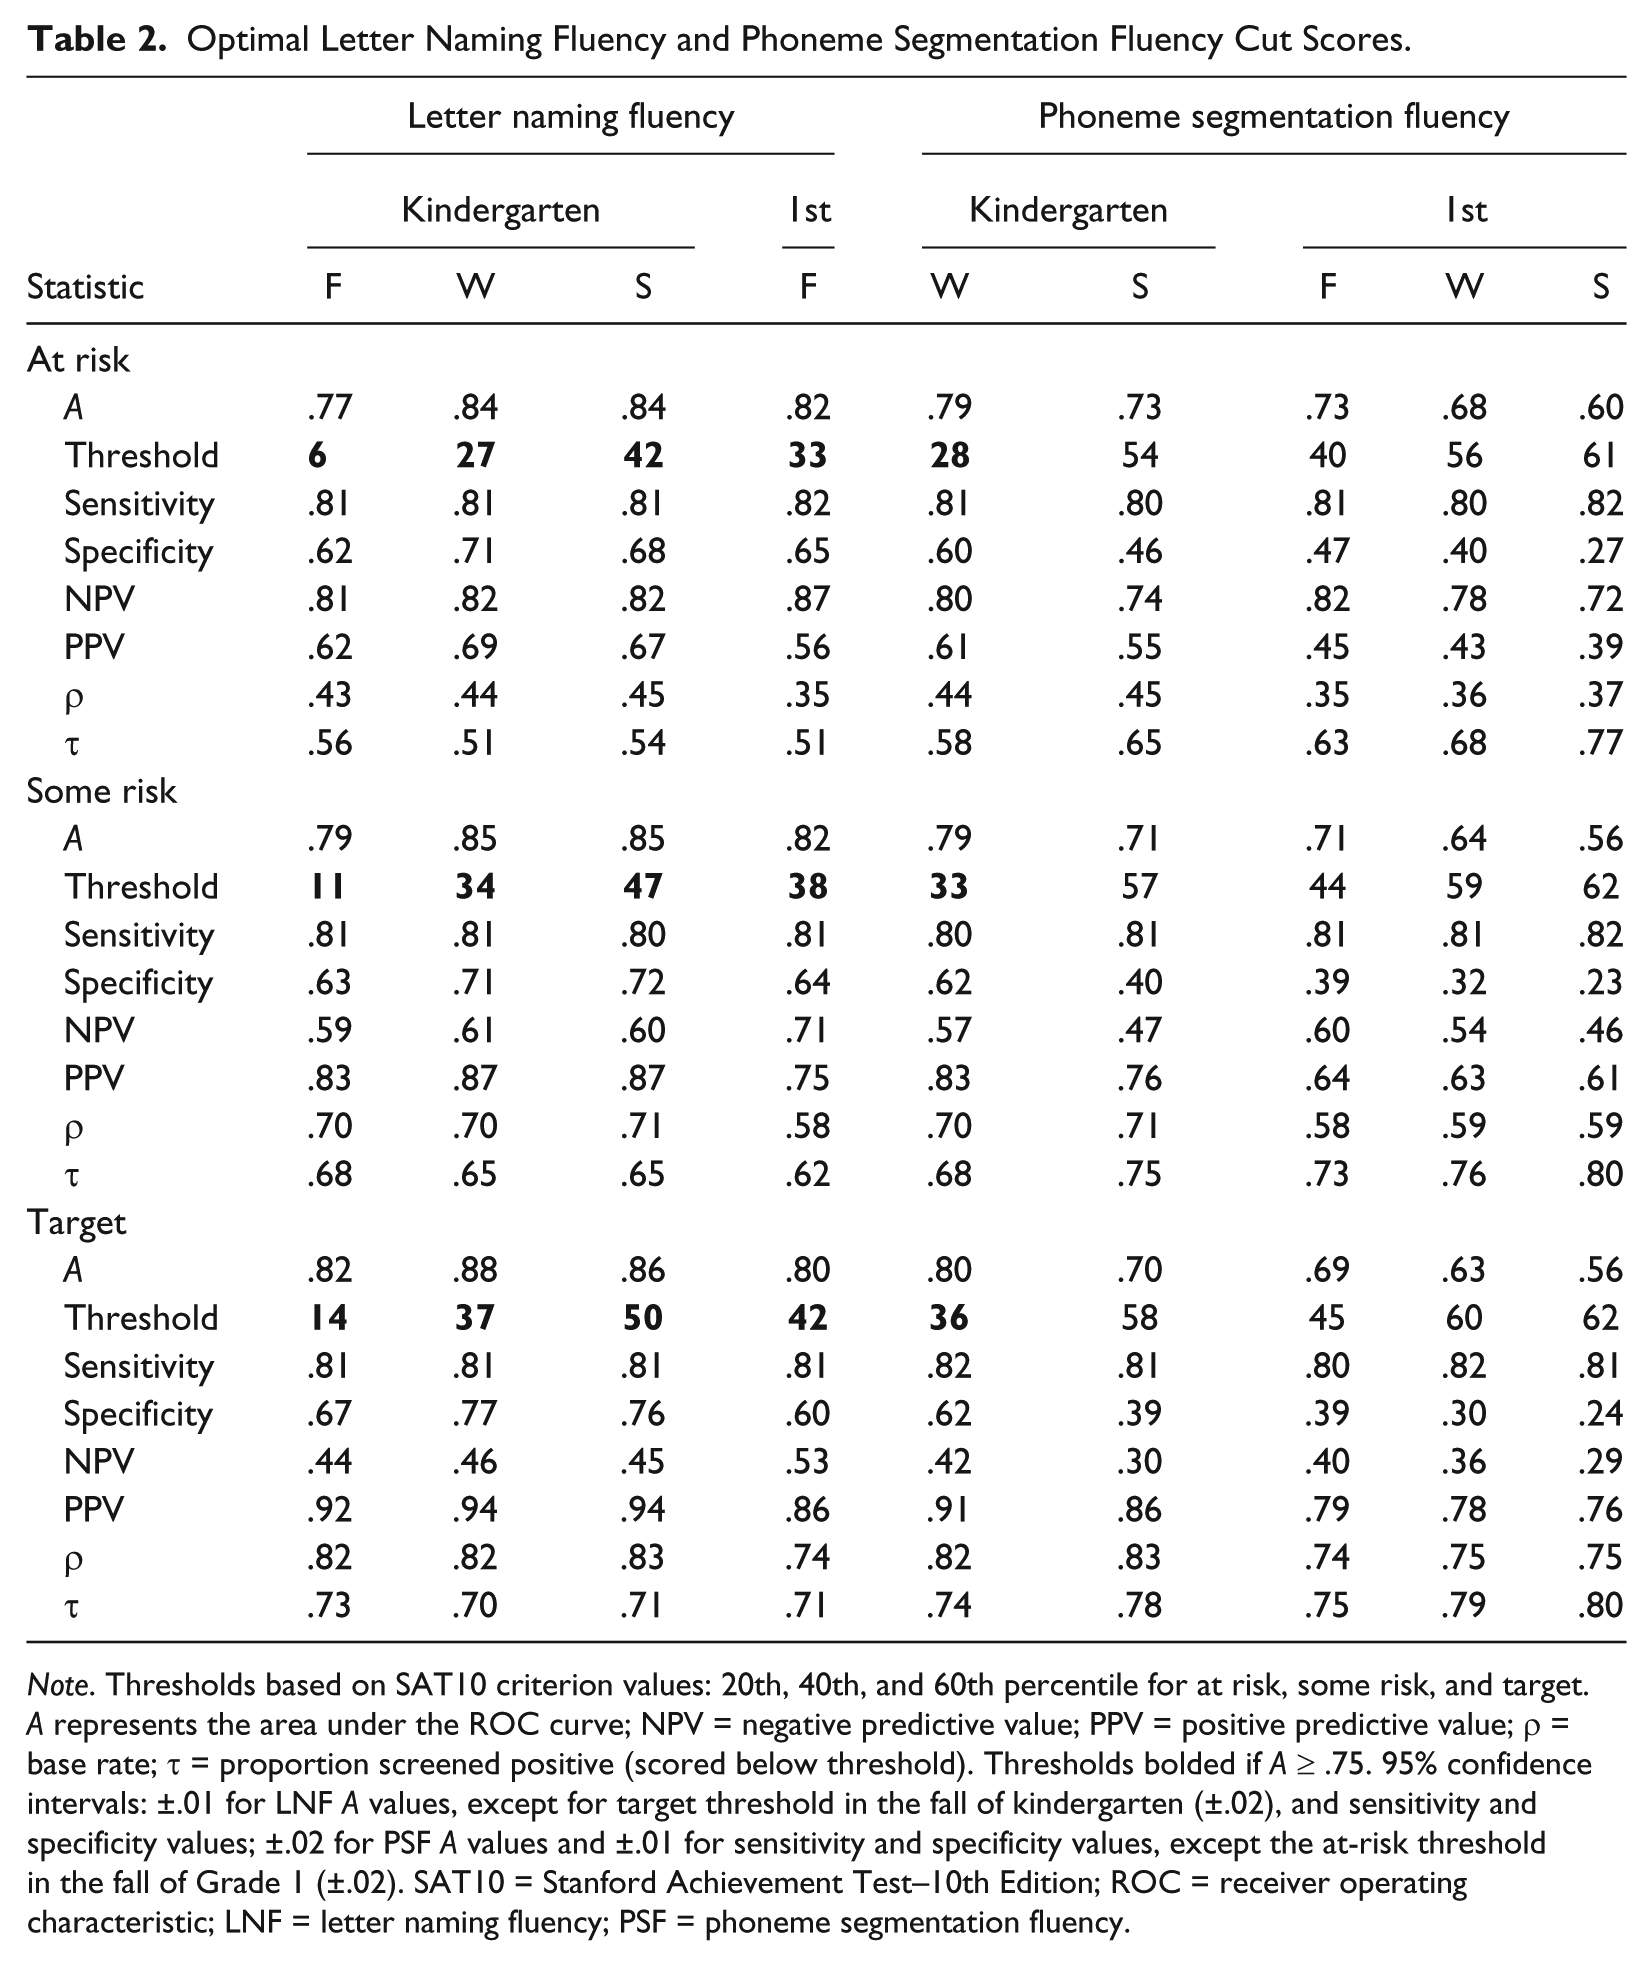
Note. Thresholds based on SAT10 criterion values: 20th, 40th, and 60th percentile for at risk, some risk, and target. A represents the area under the ROC curve; NPV = negative predictive value; PPV = positive predictive value; ρ = base rate; τ = proportion screened positive (scored below threshold). Thresholds bolded if A ≥ .75. 95% confidence intervals: ±.01 for LNF A values, except for target threshold in the fall of kindergarten (±.02), and sensitivity and specificity values; ±.02 for PSF A values and ±.01 for sensitivity and specificity values, except the at-risk threshold in the fall of Grade 1 (±.02). SAT10 = Stanford Achievement Test–10th Edition; ROC = receiver operating characteristic; LNF = letter naming fluency; PSF = phoneme segmentation fluency.
Optimal Nonsense Word Fluency Thresholds.

Note. Thresholds based on SAT10 criterion values: 20th, 40th, and 60th percentile for at risk, some risk, and target. A represents the area under the ROC curve; NPV = negative predictive value; PPV = positive predictive value; ρ = base rate; τ = proportion screened positive. Thresholds bolded if A ≥ .75. 95% confidence intervals: ±.01 for A values, except target in the fall of Grade 2 (±.02), and sensitivity and specificity values, except for specificity for thresholds in the fall of Grade 2 (±.02). SAT10 = Stanford Achievement Test–10th Edition; ROC = receiver operating characteristic.
Optimal Oral Reading Fluency Thresholds.
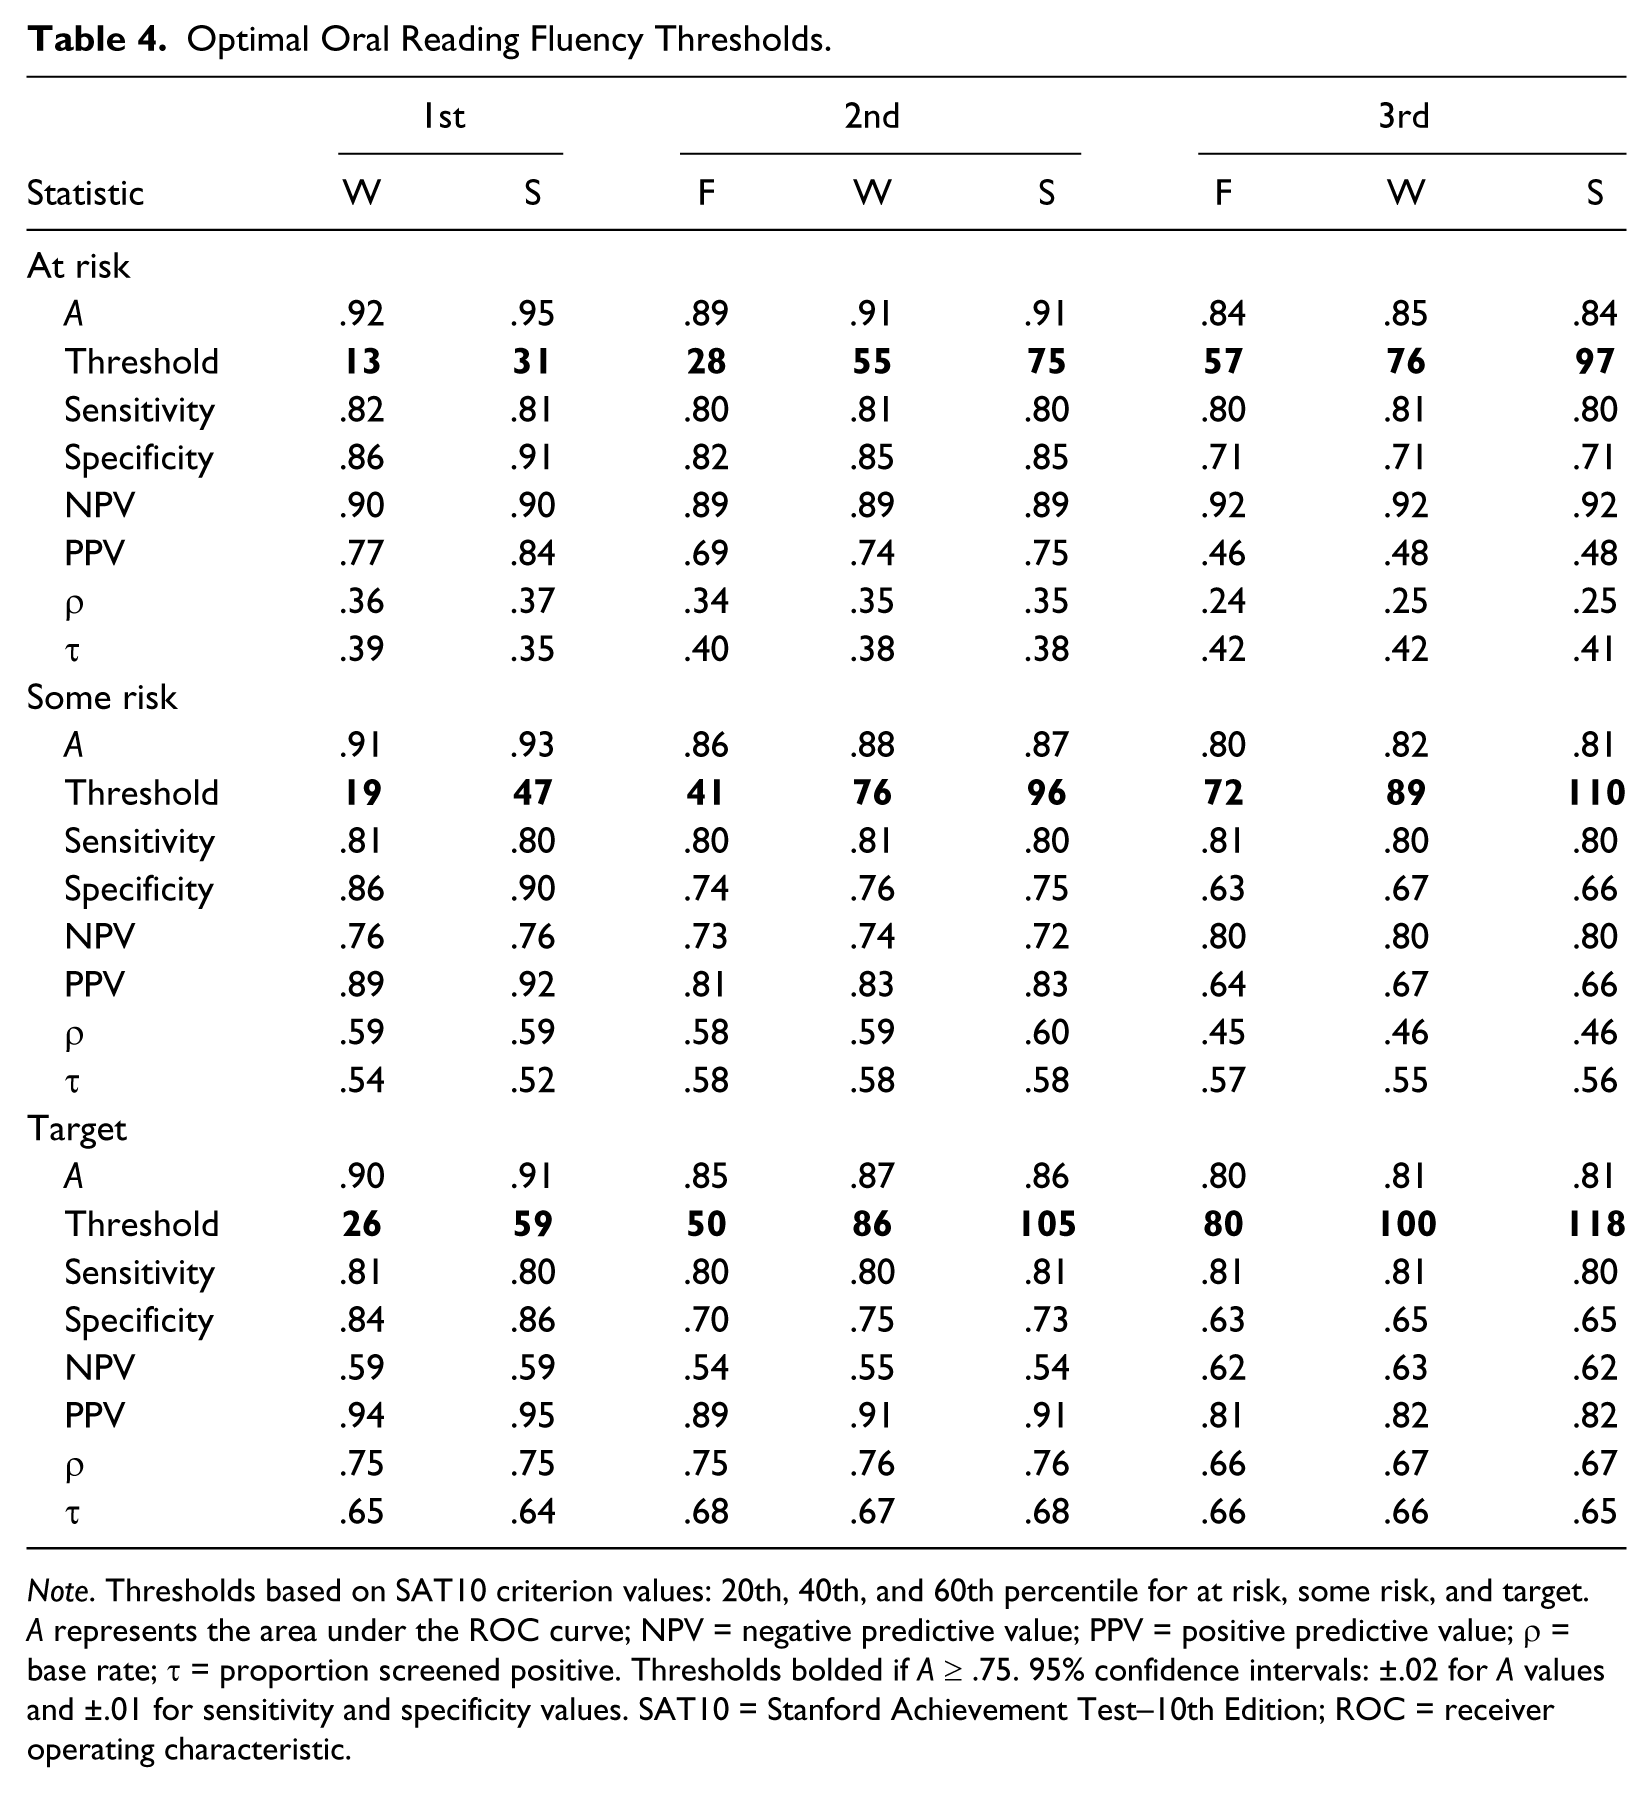
Note. Thresholds based on SAT10 criterion values: 20th, 40th, and 60th percentile for at risk, some risk, and target. A represents the area under the ROC curve; NPV = negative predictive value; PPV = positive predictive value; ρ = base rate; τ = proportion screened positive. Thresholds bolded if A ≥ .75. 95% confidence intervals: ±.02 for A values and ±.01 for sensitivity and specificity values. SAT10 = Stanford Achievement Test–10th Edition; ROC = receiver operating characteristic.
Results Example: LNF
In Table 2, we report the results for LNF; the remaining results (i.e., Tables 2-4) would be interpreted similarly. For the at-risk level, the accuracy for DIBELS LNF in the fall of kindergarten was low, A = .77 with 95% confidence interval of [.76, .78], just above .75, the value chosen as minimally acceptable for a screener. Students who were truly at risk of reading failure on the SAT10 had an 81% chance (sensitivity, [.80, .82]) of being identified as at-risk on the LNF screener if they scored below 6 (threshold). Specificity values were less than ideal; of students at or above the 20th percentile on the SAT10, 62% [.61, .63] were identified as true negatives. This implies that 38% of students who did not fall below the 20th percentile on the SAT10 were falsely identified as a positive. A different threshold for LNF could improve specificity but only at the expense of reduced sensitivity. The winter administration of LNF in kindergarten had a higher level of accuracy for the at-risk decision threshold, A = .84 [.83, .85], and consequently a more acceptable specificity value, .71 [.70, .72], for our chosen level of sensitivity. Nonetheless, the overall accuracy of LNF rarely exceeded the moderate range, A from .75 to .85.
Predictive values suggest the “clinical” significance of the screener (Pepe, 2003). Among the 56% of students (τ) who scored below 6 on the fall assessment of LNF in kindergarten and thus screened positive, the positive predictive value (PPV) shows that 62% will likely fall below the 20th percentile on the SAT10 in the spring. The negative predictive value (NPV) indicates that 81% of students who screened negative will likely score at or above the 20th percentile on the SAT10 in the spring. For a school with a similar base rate, the predictive values quantify the clinical implications of leaving students unsupported. They depend, however, on the base rate (ρ): PPV ranges between ρ and 1, NPV ranges between ρ – 1 and 1. For the at-risk threshold in the fall of kindergarten, PPV must lie between .43 and 1 and NPV values between .57 and 1. Hence, NPV will always be fairly high for risk levels with a low base rate, and the PPV will be high for criteria with high base rates.
Because most schools have different base rates from those reported here, the predictive values in Table 2 will not likely generalize. It is possible to recalculate predictive values and the proportion screened positive, τ, for different base rates using the sensitivity and specificity values from the tables (Pepe, 2003):

For the winter LNF assessment in kindergarten in a school with just 15% of its students below the 20th percentile, the PPV decreases to .33, the NPV increases to .95, and τ changes to .36 from the values reported in Table 2. Note that A, sensitivity, and specificity do not depend on base rates as predictive values do (Smolkowski & Cummings, 2015).
Overall Accuracy of DIBELS
Figure 1 displays three representative ROC curves for each measure with their level of precision. LNF, NWF, and ORF demonstrated adequate accuracy (A > .75), with some administrations of ORF reaching accuracy levels above .90. Conversely, only the winter kindergarten administration of PSF achieved A ≥ .75, with some administrations barely surpassing chance (A = .50), such as the spring of Grade 1, where A = .56. Confidence bounds provide information about precision and uncertainty, and confidence intervals for all A values fell within ±.02 of the reported values (see notes to Tables 2-4).
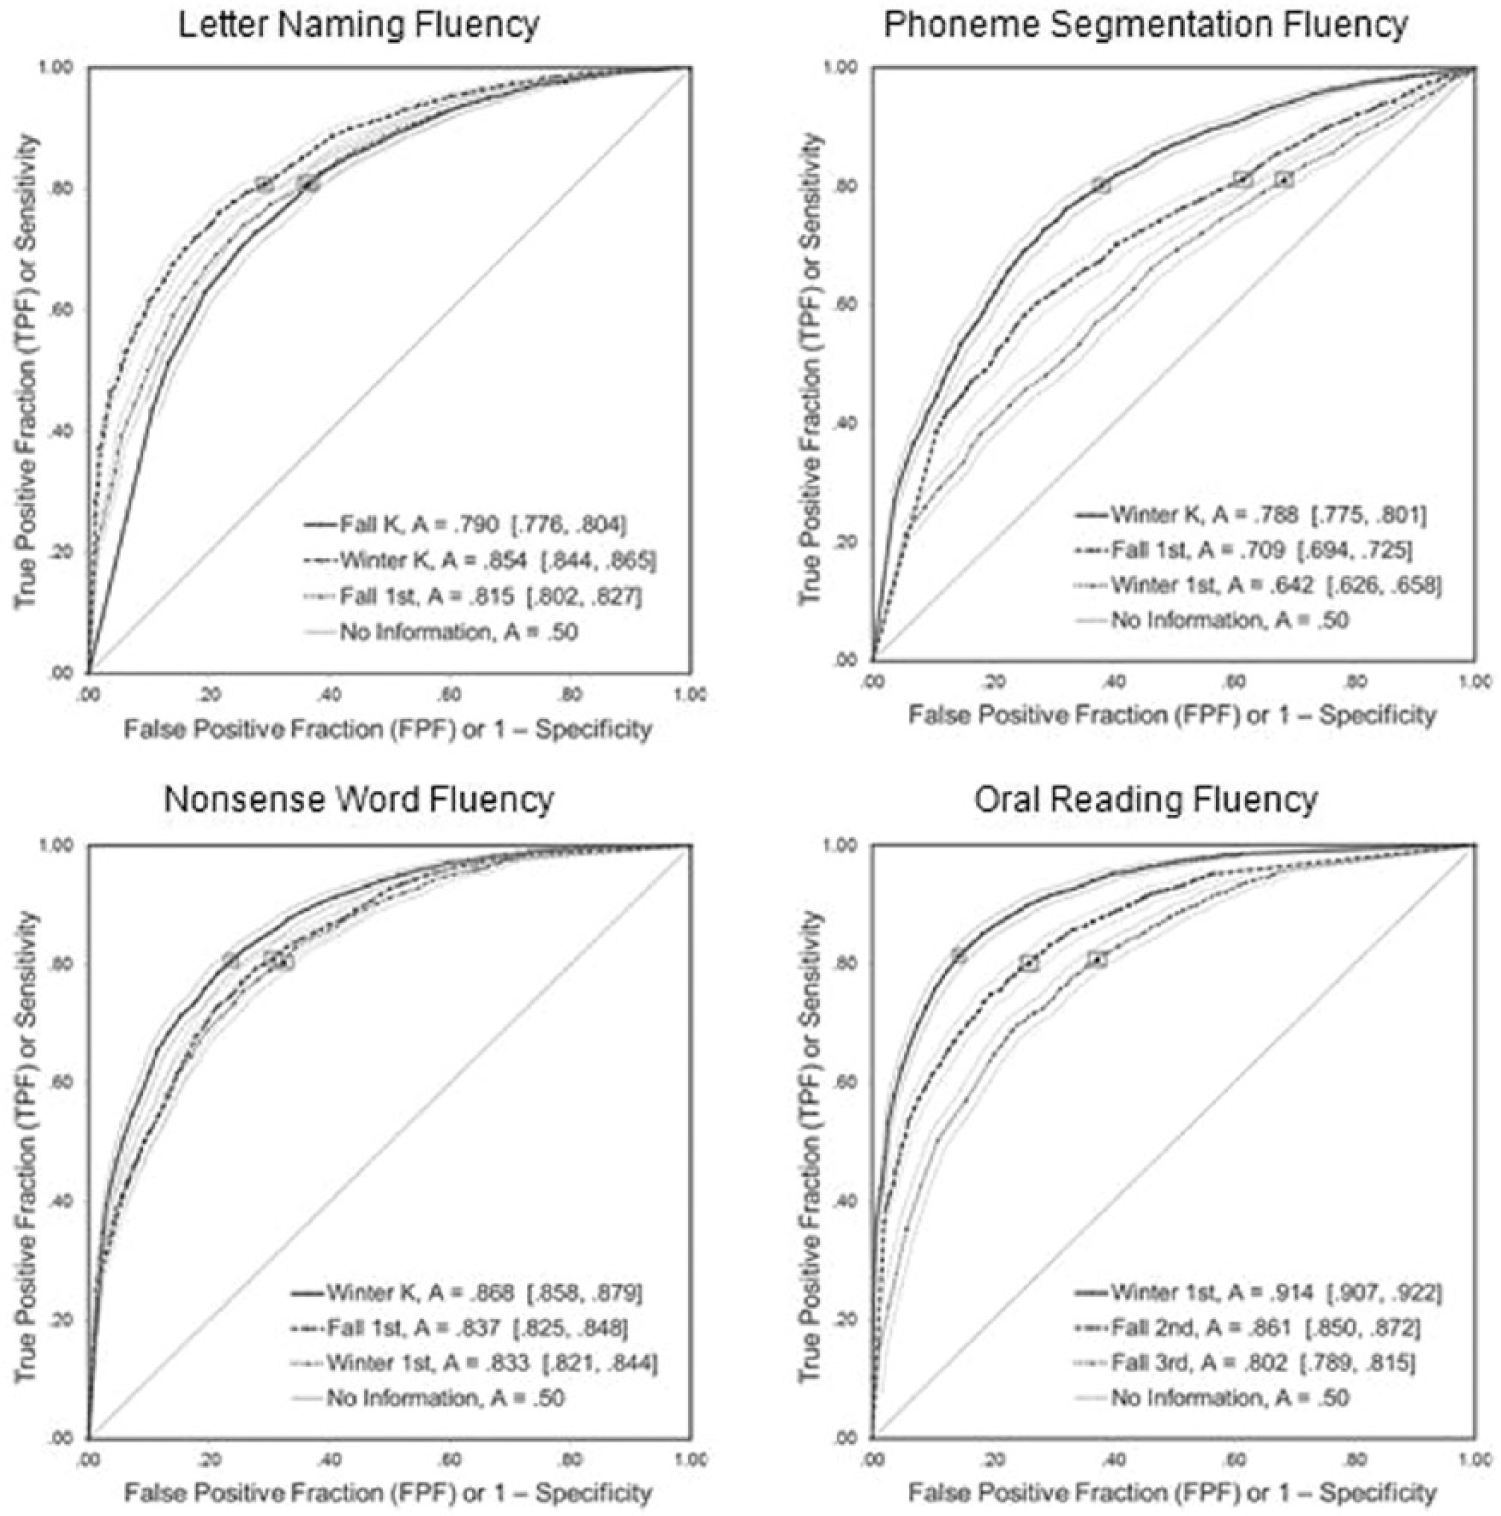
Representative ROC curves for LNF, PSF, NWF, and ORF with the 40th percentile (benchmark) on the SAT10 (OAKS in Grade 3) at the end of the school year as the criterion.
Decision Thresholds
Figures 2 and 3 depict the NWF and ORF decision thresholds from Tables 3 and 4 by grade level and administration time. The thresholds increased substantially across each school year and dropped during the summer breaks. The figures also present the thresholds originally recommended by Good et al. (2001) and Good et al. (2002), and some differed markedly. The original thresholds to identify students at risk with NWF (dashed lines in Figure 2) underestimated the performance that students require to reach criterion levels on the SAT10. Some of the original cut scores were maintained at a constant level, such as for NWF in the spring of Grade 1 and fall of Grade 2. Our results suggest that teachers should focus on improving student performance throughout Grade 1.

NWF decision thresholds determined with (ORRF; solid lines) data and those determined by Good, Simmons, Kame’enui, Kaminski, and Wallin (2002; dashed lines).

ORF decision thresholds determined with (ORRF; solid lines) data and those determined by Good, Simmons, Kame’enui, Kaminski, and Wallin (2002; dashed lines).
Discussion
The present article applied signal detection methods to DIBELS6 as a diagnostic system for students from kindergarten through Grade 3. The ability of DIBELS6 to identify unsuccessful students was tested within an effective, research-based, tiered model of reading instruction (Baker et al., 2011). Results demonstrated that most DIBELS6 measures were accurate with a notable exception: for PSF, the area under the ROC curve was insufficient to recommend that teachers base decisions on this measure after the winter of kindergarten. Low correlations between PSF and later measures have been reported previously (e.g., Good et al., 2001), but reports had not included diagnostic accuracy. The accuracy of the three other measures—LNF, NWF, and ORF—indicates that they likely improve teachers’ decision making.
The decision thresholds chosen for each of DIBELS6 measure in this study provide optimal cut scores based on a specific likelihood of known outcomes. For the two risk classifications, decision thresholds were chosen to accurately identify at least 80% of students who fall below the 20th percentile on the criterion measure administered at the end of the school year as having substantial risk of failure and at least 80% students who fall below the 40th percentile with reduced but nonetheless some risk of failure. These decision thresholds improve the likelihood that students with similar deficiencies in reading skills will be treated consistently across classrooms, schools, and districts.
Some of the decision thresholds reported here differ from those previously recommended (Good et al., 2001; Good et al., 2002), as shown in Figures 2 and 3. Previous approach to recommended cut scores used ambiguous methods and a different criterion. The results in Good et al. (2001) also relied on fewer cases—302 to 378, depending on the grade level. Good et al. (2002) drew on a larger sample, but the report provided mostly descriptive information about performance in the various risk categories. The present analysis produced LNF cut scores considerably higher than past recommendations, especially after the fall of kindergarten. For NWF, the original cut scores remained constant after the winter of first grade. Gains in predictive utility, however, are available in the winter and spring of Grade 1, especially for students at risk. Finally, for ORF, the present results generally agree with those in Good et al. (2001) and Good et al. (2002) except when predicting at-risk students in Grades 1 and 3. Past cut scores, especially for those markedly below the present thresholds, may offer false hope to students and teachers. Differences between the decision thresholds in Good et al. (2001) and Good et al. (2002) and those reported here indicate that an update in screener performance standards may improve the efficiency of supplemental instruction delivery.
Target Performance
The present investigation introduces a new concept: target performance. The target threshold was intended to help teachers focus on more ideal performance. It shows teachers how much better students must perform to minimize the likelihood of performing below standards, in this case, the 40th percentile, on comprehensive tests.
Limitations
The data for this study were generated from English-proficient students attending ORRF schools (Baker et al., 2011) assessed with their respective criterion measures. Decision thresholds presented here may not generalize to all children in all schools. The use of sensitivity to set decision thresholds is not sensitive to base rates and, unlike predictive values, should minimize differences across any schools that aim to achieve the same criterion level of performance.
Future Directions
Many published evaluations of screening systems use small samples that result in limited precision (e.g., Hintze, Ryan, & Stoner, 2003). Nelson (2008) presented the classification results for DIBELS6 with 177 kindergarten students but no estimates of precision. For a test of NWF that produced sensitivity of .62, we calculated a confidence interval of ±.14 or [.48, .76] (Harper & Reeves, 1999), which covers the range from very poor to moderate sensitivity. The broad confidence bounds demonstrate why reporting precision is important.
Researchers may combine multiple screeners to choose a decision threshold. In areas of literacy and numeracy, however, many of the available measures assess specific skills and identify important skill deficits (e.g., decoding versus phonemic awareness; number operations versus problem solving), suggesting that a combination score may not yield the most useful information for educators. Evaluations of combinations of tests may be conducted with a number of methods (Pepe, 2003). Gigerenzer and Goldstein (1996) suggested the Take the Best heuristic, but McGrath (2008) showed that “the best single predictor often can perform better than do multiple predictors when the predictors are combined using methods common in applied settings” (p. 195). The costs and benefits of combined or chained screeners and screener/comprehensive-test combinations have yet to be evaluated in education.
Research should also account for the scope and sequence of curricula, which could influence the validity of the decision thresholds. Although PSF was recommended for the winter of kindergarten, it assumes students received relevant instruction. Some curricula do not teach phoneme segmentation until after the winter assessment (e.g., Read Well Kindergarten; Sprick, Jones, Dunn, & Gunn, 2008). The validity of academic screeners depends in part on their alignment with instruction, an issue that requires further investigation.
Implications for Practice
DIBELS6 measures are generally accurate, and specific and decision thresholds can identify students who require supports. Because the decision thresholds presented here were rigorously evaluated, schools may choose to update their standards based on these findings and possibly reduce the use of PSF. The present analysis relied on statistics not affected by base rates and the large sample provided narrow confidence bounds. We thus believe the results are generalizable to many schools nationwide. The results of this study do not, however, prescribe the supports required by struggling students. Some students may need only minimal supports, whereas others may benefit from intensive instruction. Schools must determine the level of supports based on the needs of students and resources available.
Many other screening systems exist, with others sure to arrive soon, but new does not guarantee better. Like instructional fads (Slavin, 1989), schools, districts, and states are quick to adopt the next assessment system. Schools have begun to adopt DIBELS Next, for example, which does not yet have a peer reviewed evaluation. Publishers of newer systems should strive to the best results herein. Until then, many of the DIBELS6 measures can continue to serve students well.
Footnotes
Acknowledgements
The authors acknowledge Drs. Scott Baker, John Seeley, and Hank Fien for their suggestions for the general approach and comments on manuscript drafts. We also acknowledge Lisa Strycker for her comments, edits, and general help with the manuscript.
Authors’ Note
The data used in this report were previously published in Baker et al. (2011); Baker et al. (2008); and  . The opinions expressed are those of the authors and do not represent views of Oregon Research Institute, the University of Maryland, or the U.S. Department of Education.
Declaration of Conflicting Interests
The author(s) declared no potential conflicts of interest with respect to the research, authorship, and/or publication of this article.
Funding
The author(s) disclosed receipt of the following financial support for the research, authorship, and/or publication of this article: This research was supported by an Oregon Reading First subcontract from the Oregon Department of Education to the University of Oregon (8948). The original Oregon Reading First grant was made from the U.S. Department of Education to the Oregon Department of Education (S357A0020038). This research was also supported by two grants (R324A090111, R324A090104) from the Institute of Education Sciences, U.S. Department of Education.