



Abstract
This longitudinal study of 78 Canadian English-speaking students examined the applicability of the stability, cumulative, and compensatory models in reading comprehension development. Archival government-mandated assessments of reading comprehension at Grades 3, 6, and 10, and the Canadian Test of Basic Skills measure of reading comprehension administered at Grade 10 were used. The probabilities of later-grade reading achievement based on earlier-grade reading achievement were computed, and tests of regression to the mean were conducted. Most changes in relative achievement were attributed to regression toward the mean. Overall, results suggest considerable stability across time.
Keywords
Although the past 40 years have seen the extensive examination of the development of word reading skills, the development of reading comprehension has received less attention (RAND Reading Study Group, 2002). Research devoted to understanding the patterns of stability and change in reading comprehension performance is central to understanding reading development. Knowledge of children’s different growth patterns may allow us to ascertain the extent to which early performance is predictive of future outcomes, thereby encouraging the development of instructional and remedial programs.
Patterns of Reading Comprehension Growth
Three patterns or models have been suggested to explain the development of children’s reading comprehension: stability, cumulative growth, and compensatory growth (e.g., Pfost, Hattie, Dörfler, & Artelt, 2014). The stability model (e.g., Cunningham & Stanovich, 1997) argues that children who are successful in the early grades tend to remain at the top of the achievement distribution, whereas children who have difficulty in the early grades tend to remain at the bottom. Considerable stability has been reported in large samples, with correlations of .59 to .88 between measures of reading taken 01 and 6 years apart (Badian, 1999; Phillips, Norris, Osmond, & Maynard, 2002; B. A. Shaywitz et al., 1995). Correlation coefficients have been stronger when intervals are shorter and when the same measure of reading comprehension is used (e.g., Phillips et al., 2002).
The cumulative growth model, also known as a Matthew effect (Stanovich, 1986), a fan-spread pattern (Cook & Campbell, 1979), or a cumulative reading trajectory (Leppänen, Niemi, Aunola, & Nurmi, 2004), proposes that individual differences increase over time. Those with initial advantages in reading or its prerequisite cognitive and linguistic skills improve at a faster rate than those who begin with lower skill levels, whereas those lacking these initial advantages fall further behind. Given that individual differences in reading achievement among students in Grades 8 to 12 are larger than in Grade 1 (Daneman, 1996), this model is intuitively appealing. However, longitudinal studies investigating the cumulative model have had inconsistent results (e.g., Bast & Reitsma, 1998; Carreker et al., 2007; Parrila, Aunola, Leskinen, Nurmi, & Kirby, 2005; see also Protopapas, Parrila, & Simos, 2014, for a critical analysis of the issue).
The third, compensatory growth model, proposes that children with initially lower skill show faster growth than those with initially higher skill, thereby allowing them to reduce or close the achievement gap over time (e.g., Aarnoutse, van Leeuwe, Voeten, & Oud, 2001; Aunola, Leskinen, Onatsu-Arvilommi, & Nurmi, 2002; Parrila et al., 2005; Phillips et al., 2002; Scarborough, 1998). Compensation may occur because developmental delays are overcome or because of instruction in needed skills. Greater compensation for initially lower achievement has been observed in children with higher cognitive and linguistic abilities, from higher socio-economic status homes, who demonstrate positive instructional and motivational effects, and whose reading strategy use is more prevalent (Leach, Scarborough, & Rescorla, 2003; McCall, Hauser, Cronin, Kingsbury, & Houser, 2006). Some children with low initial performance levels improve sufficiently to perform within the average range on reading comprehension measures (Ghelani, Sidhu, Jain, & Tannock, 2004; Parrila, Georgiou, & Corkett, 2007; Phillips et al., 2002).
Summary and Limitations of Existing Studies
Pfost et al. (2014) conducted a meta-analysis of the reading development literature looking for evidence of these three growth patterns. Over all aspects of reading, 25% of the findings supported the stability model, 23% the cumulative growth model, and 42% the compensatory growth model; when only reading comprehension outcomes were analyzed, the compensatory pattern was found more than 66% of the time. However, the results were complicated by a variety of moderator variables; for example, the compensatory pattern was more apparent in languages with a transparent orthography (such as German or Finnish) and less so in English. Furthermore, it is likely that different children follow different pathways in their reading development.
There are a number of limitations in the existing studies. First, the majority of these studies investigated reading comprehension development in Grades 1 to 6, even though skill in reading comprehension continues to develop (e.g., Bast & Reitsma, 1998; Francis, Shaywitz, Stuebing, Shaywitz, & Fletcher, 1996; Parrila et al., 2005; Phillips et al., 2002). Second, one of the patterns predicted, that of improvement for low-starting children in the compensatory model, is consistent with the statistical artifact of regression toward the mean. This needs to be assessed (Phillips et al., 2002). Third, these studies used norm-referenced measures, comparing children only with others in the same study. However, school systems are increasingly using standards-based assessments that establish criterion-referenced levels of performance (Wixson & Carlisle, 2005) and categorizing student’s performance in terms of how well they have met these criteria. This approach underlies many government-mandated tests, such as those of Ontario’s Education Quality and Accountability Office (EQAO).
The Present Study
This study was a retrospective longitudinal investigation of the stability, cumulative, and compensatory models in the reading comprehension achievement of students in Grades 3, 6, and 10. The study addressed the following questions:
In Ontario, assessments of reading are administered to all students in Grades 3 and 6 (approximately, ages 8 and 11). Achievement in these grades is reported using four main performance levels: PL1, achievement falls much below the provincial standard; PL2, achievement approaches the provincial standard; PL3, achievement meets the provincial standard; and PL4, achievement exceeds the provincial standard (EQAO, 2003). The Ontario Secondary School Literacy Test (OSSLT), which includes reading and writing components, is administered in Grade 10 (age 15). These standard-based tests, designed and administered by EQAO, are intended to measure student achievement against curriculum expectations. Results yield individual, school, school board, and provincial data on achievement. During the period of this study (1999-2000 for Grade 3, 2002-2003 for Grade 6, and 2007 for Grade 10), however, EQAO did not maintain records in a manner to enable large-scale longitudinal analyses of student achievement at the individual level. Access was limited to files from which names, identification numbers, and other personal identifiers had been removed, and files were not linked across grades. Requests to access individual student records could be made to school boards, but required individual student and parental consent. We began with a group of Grade 10 students and obtained their Grade 3, 6, and 10 EQAO data. We administered an additional reading comprehension test in Grade 10.
The categorical nature of the data imposes some limitations on the testing of the three models of reading comprehension, but these models do yield different predictions. Students following the stability model should maintain their ability categorization across grades. The cumulative model should be apparent in below-average students (those in Level 2) declining to Level 1 and above-average students (Level 3) increasing to Level 4 (those in Level 1 cannot decline, and those in Level 4 cannot increase). Students demonstrating the compensatory model would be those in Levels 1 and 2 who increase in levels across grades.
Method
Participants
The participants were 78 Grade 10 students whose first language was English. In Grade 10, their mean age was 15 years 4 months (SD = 7.5 months); there were 48 girls and 30 boys. They were enrolled in a rural Ontario publicly funded Catholic high school serving approximately 1,000 students from a range of socio-economic backgrounds. This district is broadly representative of the province, though having more people employed in manufacturing and construction, fewer with higher education, more from aboriginal backgrounds but fewer from other visible minority backgrounds, and more from English-language backgrounds (for details, see Kwiatkowska-White, 2012). Eighteen percent (n = 14) had been identified with special learning needs: 7 learning disabled, 1 gifted, 1 mild intellectual disability, 1 behavioral, 1 mild hearing loss, and 3 unspecified. There were 57 students in the academic stream that prepares students for university and 21 in the applied stream that prepares students for vocational college or the workplace. Student and parental permissions were obtained.
Measures
Demographic questionnaire
Participants completed questions regarding their gender, level of academic study, first language learned, and age in Grade 10.
Reading comprehension
Archival data for the EQAO Grades 3 and 6 reading assessments were obtained. Each assessment included two reading passages followed by open-ended and multiple-choice questions. In Grade 3, there were 18 open-ended and 20 multiple-choice questions. In Grade 6, there were 19 open-ended and 21 multiple-choice questions. Students’ reading achievement was reported using four provincial levels (PL1-PL4). Four further designations were used: not enough evidence (not enough evidence of knowledge and understanding to be assigned Level 1), insufficient information to score (work deemed insufficient to be given a level, for example, if large sections of work were missing due to absence), exempt and no data (students formally exempted from participation), and non-exempt (completed assessment booklets not received; EQAO, 2000, 2003). For the purposes of this study, these four supplementary designations were recoded as PL1 (this affected nine scores in Grade 3, six in Grade 6).
The Grade 3 and 6 assessments took place over a 3-week period in May of 2000 and 2003 with 5 days (approximately 2.5 hr each day) devoted to the assessments of reading, writing, and mathematics. Students took part in introductory activities with their classmates and then worked independently to read the passages and answer questions. Inter-rater reliability was approximately 60% for the open-ended responses, based on re-marking approximately 15% of responses (M. Kozlow, EQAO, personal communication, February 11, 2009).
Grade 10 reading comprehension was assessed with the OSSLT and the Canadian Test of Basic Skills (CTBS). The OSSLT assesses both reading comprehension and writing skills and was administered in two 75-min sessions. Although students’ overall achievement is normally reported only as successful or unsuccessful, EQAO provided individual raw scores for the reading questions.
The 2007 OSSLT reading component had five reading selections (information paragraph, news report, dialogue, narrative, and graphic text) that varied in length from one paragraph to two pages. Students responded to 31 multiple-choice (1 mark each) and 4 open-response questions (3 marks each) that assessed their understanding of explicitly and implicitly stated ideas, and connections made between the text and students’ knowledge and experience (EQAO, 2007). EQAO reported an α reliability of .87 for the combined reading and writing items (M. Kozlow, EQAO, personal communication, January 30, 2008). In this sample, the alpha reliability for the reading items was .74.
The reading comprehension subtest of the CTBS (Nelson Education, 1998) assesses factual and inferential understanding with multiple-choice questions following reading passages. Following the instructions in the manual, this test was group administered with 40 min provided to answer 44 questions based on five reading passages (two narratives, one poem, and two expositions). The alpha reliability of .83 in this sample is similar to the KR-20 value of .89 reported in the manual.
Results
Table 1 reports descriptive statistics for the four reading comprehension measures. The mean grade equivalent for the CTBS was in the range expected for Grade 10 (M = Grade 10.2, SD = 3.7). The OSSLT reading measure was negatively skewed. Transformations improved its distribution but did not change its correlations with other variables. Therefore, we report analyses performed on raw scores.
Descriptive Statistics (N = 78).
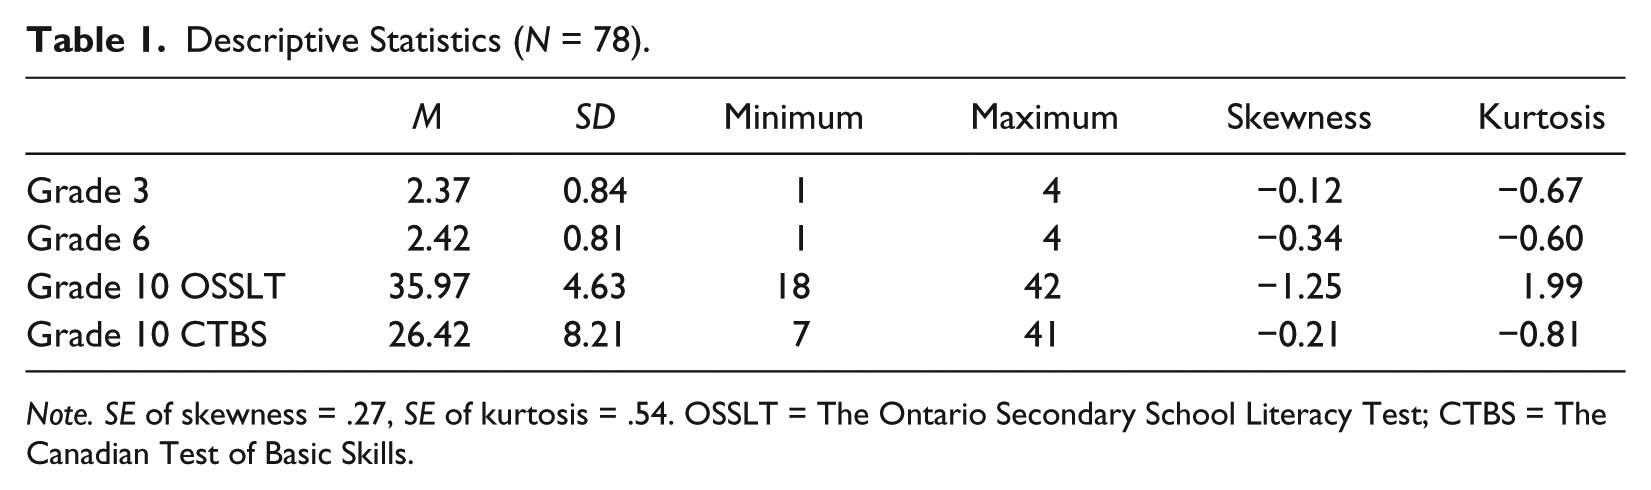
Note. SE of skewness = .27, SE of kurtosis = .54. OSSLT = The Ontario Secondary School Literacy Test; CTBS = The Canadian Test of Basic Skills.
To create a broader measure of Grade 10 reading achievement, a composite score was calculated by averaging z scores for the two Grade 10 tests. We used this composite to form Grade 10 groups that were equivalent in proportion to those in Grades 3 and 6; we used this categorical variable to determine how group membership changed over the years. Thus, 17.5% of the students were classified as poor in Grade 10 reading achievement (Grade 10 composite z score, range = −2.14 to −0.92), 31.2% as below-average (−0.90-0.09), 44.6% as average (0.12-1.19), and 6.7% as above-average (1.25-1.65). Table 2 presents the correlations between the four reading comprehension measures. All were significantly correlated (p < .001) in the moderate range (range = .54-.65).
Correlations Between Reading Comprehension Measures.

Note. OSSLT = The Ontario Secondary School Literacy Test; CTBS = The Canadian Test of Basic Skills.
p < .001, one-tailed.
Relationship Between Initial and Later Levels of Reading Comprehension Achievement
To investigate the relationship between initial and later reading comprehension levels, three sets of conditional probabilities were computed: (a) Grade 6 reading achievement categorization given Grade 3 reading achievement categorization (Table 3), (b) Grade 10 categorization given Grade 6 categorization (Table 4), and (c) Grade 10 categorization given Grade 3 categorization (Table 5). The four EQAO PLs were used to categorize students’ Grade 3 and 6 reading achievement. For Grade 10, students’ reading achievement was categorized using the four reading achievement categories (poor, below-average, average, and above-average as outlined above). For each of the resulting probabilities, 95% confidence intervals are also shown. Tables 4 and 5 include the mean performance of each of the Grade 3 and 6 groups on the two reading comprehension measures.
Probability of Reading Achievement Categorization in Grade 6 Based on Grade 3 Achievement Categories.

Note. Probabilities in
Probability of Grade 10 Reading Achievement Categorization and Grade 10 Performance Based on Grade 6 Achievement Categories.

Note. Probabilities in
Probability of Grade 10 Reading Achievement Categorization and Grade 10 Performance Based on Grade 3 Achievement Categories.

Note. Probabilities in
With some exceptions, the results reported in Tables 3, 4, and 5 show considerable stability. PL4 students showed low stability from Grade 3 to 6 and Grade 3 to 10 (range = .20-.40), but much greater stability from Grade 6 to 10 (.75). For the weakest starters (PL1 and PL2), there was some evidence of increase in achievement (range = .21-.46 moving up one level; .04-.08 moving up two levels). However, these students were more likely to maintain their previous category (range = .43-.69). There was less likelihood of the PL2 students decreasing (range = .11-.20). Students starting at PL1 could go no lower. The confidence intervals indicate some overlap between adjacent groups. The Grade 3 groups differed significantly on the two Grade tests; for OSSLT, F(3, 74) = 15.06, p < .001, ηp2 = .38, and for CTBS, F(3, 74) = 18.32, p < .001, ηp2 = .43; Bonferroni tests indicated that the Level 1 group in Grade 3 performed significantly worse than the other groups, who did not differ, on OSSLT, and that all groups differed on CTBS. The four Grade 6 groups also differed on Grade 10 achievement, for OSSLT, F(3, 73) = 10.01, ηp2 = .29, and for CTBS, F(3, 74) = 15.54, ηp2 = .39; Bonferroni tests indicated that Levels 1 and 2 did not differ, and that Levels 3 and 4 did not differ, but all other comparisons were significant on OSSLT, and that all groups differed on CTBS, except that Levels 2 and 3 did not differ.
The students who started adequately (PL3 and PL4) showed some decreases, especially from PL4 in Grade 3. Ignoring that (which concerns 5 students), the chances of moving down a level ranged from .13 to .25, and of dropping two levels ranged from .05 to .06. Although the chances of dropping a level were higher than those of increasing (range = .05-.13), it was much more likely that relative achievement would remain the same (range = .59-.68). Overall, there was considerable stability in achievement (Grades 3-6, 50%; Grades 6-10, 59%; Grades 3-10, 64%). We comment on the prevalence of the stability, cumulative, and compensatory development patterns in the “Discussion” section.
Regression Toward the Mean
Whenever change over time is analyzed, it is important to address regression effects. Regression toward the mean is the statistical trend for scores at one time to move closer toward the mean at a second time, due to errors of measurement (Campbell & Stanley, 1963). It is observed whenever the correlation between two variables is less than perfect (Furby, 1973), and the lower the correlation between the scores at the two times, the greater the regression toward the mean. Two methods were used to study the regression effects in the data, a time-reversed control analysis (Campbell & Stanley, 1963; Phillips et al., 2002) and a comparison between subgroup predicted and actual scores (Lord, 1958).
The time-reversed analysis involved calculating the later mean scores (e.g., in Grade 6) of students who had been grouped into the four achievement levels at an earlier time (e.g., Grade 3), and comparing the results with the earlier mean scores (in Grade 3) of students who had been grouped into the four achievement levels in the later period (Grade 6); the first of these is time-forward, the second, time-backward. If regression toward the mean were operating, children scoring above the mean at the earlier time would later obtain lower scores (a downward sloping time-forward line), and children scoring below the mean earlier would obtain higher scores later (an upward sloping time-forward line); the opposite trend would be expected in the time-backward analysis. Time-reversed analyses were conducted for the Grade 3 to 6, Grade 6 to 10, and Grade 3 to 10 periods (see Figure 1)

Comparison of Time-forward Analysis (solid lines) with Time-backwards Analysis (broken lines) for each Achievement Group for Grade 3 and 6, Grade 6 and 10, Grade 3 and 10.
Considering the time-forward analyses (solid lines) in all three periods, the higher groups (PL3, PL4) declined in achievement level and the lower groups (PL2, PL1) increased, as would be expected in regression toward the mean. The time-reversed analysis (broken lines in Figure 1) reveals the opposite picture. Students scoring higher at the later time had increased from the earlier time, and those scoring lower later had decreased, again as would be expected in regression toward the mean. In general, the magnitude of the forward changes is similar to those of the backward changes, with several exceptions. The largest of these discrepancies is for PL4 in Grade 6 to 10, for which there is less regression toward the mean than is shown in the backward analysis. The complementary pattern is shown for the PL1 students in Grade 6 to 10. Thus, the time-reversed analyses suggest that the majority of the observed changes were due to regression effects, and most of the exceptions were due to greater stability than expected.
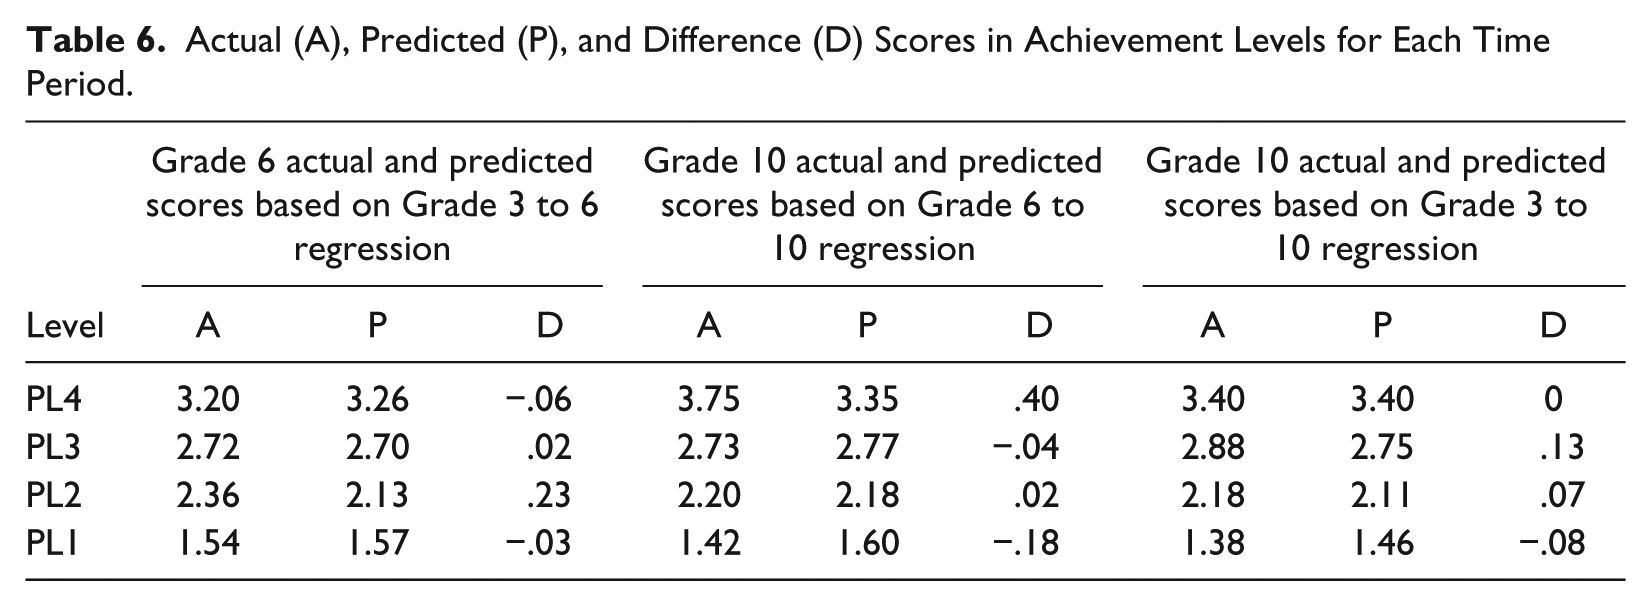
In the second analysis, the difference between actual and predicted scores was examined (Campbell & Stanley, 1963). Actual values were the mean later achievement for students classified in each earlier achievement group (e.g., Grade 6 scores for each of the Grade 3 groups), and predicted values were calculated by regression (e.g., predicting Grade 6 scores from Grade 3 scores). Given the imperfect correlation across years (Table 2), students with achievement above the mean earlier should regress downward at the later time, and those with achievement below the mean earlier should regress upward at the later time. If the actual changes are similar to the predicted changes, this suggests they are due to regression toward the mean. The actual, predicted, and difference scores (all expressed in achievement level units) are shown in Table 6. With three exceptions, the differences between the actual and predicted scores were small. The first exception was in the prediction of Grade 6 scores from Grade 3; the actual value for PL2 students was .23 of a level higher than predicted by regression, suggesting real improvement. The second exception was in the prediction of Grade 10 scores from Grade 6 for PL4 students (n = 5); the actual Grade 10 value was .40 of an achievement level higher than predicted, indicating more stability than expected from regression. The third exception was in the prediction of Grade 10 scores from Grade 6 for PL1 students, who showed less gain (−.18) than would be predicted from regression, again indicating more stability than predicted from regression. Thus, the overall changes are consistent with regression toward the mean, and only one of the exceptions indicates more growth than would be expected by regression.
Actual (A), Predicted (P), and Difference (D) Scores in Achievement Levels for Each Time Period.
Both techniques suggest that the majority of the changes across grades are due to regression toward the mean. Most of the exceptions to this pattern demonstrated more stability than expected. There was very little evidence of improvements by lower-performing students.
Discussion
We investigated the stability, cumulative growth, and compensation models of reading comprehension development in Grades 3, 6, and 10. We addressed three main issues: the relationships among the comprehension measures, the probability of later reading achievement given earlier achievement, and the effects of regression toward the mean.
The magnitude of the correlations between the reading comprehension measures indicates a moderate but substantial relationship between measures and across times (range = .54-.65). These correlations are consistent with those reported in other studies based on broad samples of children. For example, Cunningham and Stanovich (1997) reported a Grade 1 to 11 correlation of .58 using two different standardized tests of reading comprehension, and Phillips et al. (2002) a Grade 1 to 6 correlation of .59 using the same standardized reading comprehension test. With regard to the two Grade 10 measures, their correlation (.60) was in the lower range reported in other studies that have used more than one concurrently administered reading comprehension measure. Cutting and Scarborough (2006), for example, reported correlations of .64 to .79 for three commercially available tests with age controlled. However, our results are consistent with Rupp and Lesaux’s (2006) correlation in Grade 4 of .64 between a commercially available measure and a government standards-based assessment. Generally, lower correlations are to be expected when a limited number of achievement groupings are used (as in this study and by Rupp and Lesaux) rather than raw scores (as by Cutting and Scarborough). The correlation between the Grade 3 and 6 government-mandated assessments (.55) is comparable with that between two government-mandated assessments reported by Carreker et al. (2007) in a Grade 3 to 5 sample (.60). Overall, the present results support the findings of many studies indicating substantial stability in reading comprehension achievement, yet leaving considerable room for developmental changes.
The conditional probability analyses allowed us to examine the evidence for the stability, cumulative growth, and compensation models (Pfost et al., 2014). Previous studies have been inconsistent in their support for these models (e.g., Aarnoutse et al., 2001; Aunola et al., 2002; Badian, 1999; Bast & Reitsma, 1998; Carreker et al., 2007; Leppänen et al., 2004; Parrila et al., 2005; Phillips et al., 2002; Scarborough, 1998; B. A. Shaywitz et al., 1995). Some support for the compensatory path for some low-starting students was obtained from the conditional probabilities results: A substantial portion of low-starting students (defined in this study as achieving PL1 and PL2) improved their achievement by a later time. For example, 21% to 42% of those at PL1 in an earlier grade later moved to PL2 (Tables 3, 4, and 5). However, this support was tempered by our tests of regression toward the mean, which indicated that real compensation applied to the Grade 3 to 6 period only and was limited to a small percentage of PL2 students. It is important to note that these PL2-starting students would have been classified as average readers rather than poor readers had the commonly used cutoff of one standard deviation below the mean been used to establish low achievement groupings. Evidence that our lowest starting students (PL1 students representing the bottom 17% of our sample) demonstrated real compensation was not found.
With regard to the cumulative growth or Matthew effect model, we found a low probability for the performance of PL2 students to decrease or for that of PL3 students to increase (students starting at Level 1 could go no lower, and those starting at Level 4 could go no higher). The regression toward the mean analyses suggested that the great majority of the changes in achievement level across grades, both up and down, were due to this statistical artifact.
Explaining Stability
There are many potential explanations for the stability observed in students’ reading comprehension. A likely candidate is weakness in word reading skill and in the skills that support it (phonological, orthographic, and morphological awareness, and vocabulary; for example, Kirby, Desrochers, Roth, & Lai, 2008). Furthermore, because students who do not read well generally do not read very much, they have fewer opportunities for reading practice and for learning from what they read (Anderson, Wilson, & Fielding, 1988). Lower reading skill and less practice lead to a decrease in motivation to read, which further acts to counter remedial efforts (Kirby, Ball, Geier, Parrila, & Wade-Woolley, 2011). At the upper end of the distribution, these same factors work to maintain students’ initial advantages in reading comprehension: Increased skill leads to more reading practice, greater vocabulary, more content knowledge, and greater motivation to read. These influences are those described in the cumulative model (Leppänen et al., 2004; Stanovich, 1986), but can also be seen to support stability. Although little evidence was found here for the cumulative model, this may be due to the nature of the data. The four-category scoring system did not allow for the students in the top group to improve or those in the bottom group to decline. A second factor may be the time frame: Some cumulative growth spreading may occur early in reading development (i.e., before Grade 3) but may be followed by steady development after that (cf. Pfost et al., 2014).
Limitations, Future Directions, and Conclusion
There are certain limitations that need to be acknowledged. First, our sample was relatively small and consisted of students attending one rural high school. Second, the categorical nature of the data, although consistent with government-mandated approaches, made it difficult to fully assess the cumulative growth model. Third, our retrospective design meant that measures assessing word reading, vocabulary, and oral language were not available as predictors. Finally, and more importantly, these results only describe what is, not what may be; for example, research-based intervention programs may improve word reading skills and alter the pattern of subsequent reading comprehension development. Future research should address these limitations.
The finding of considerable stability in students’ reading comprehension development has several implications, especially for less able readers. The majority of those demonstrating poor reading ability in Grade 10 were identified as early as Grade 3; it is possible that other testing could have led to even earlier and more complete identification. If this is so, then early intervention is warranted. Previous studies have indicated that many children with reading difficulties can acquire grade-level reading skills if they receive early and intensive remediation (e.g., Fuchs & Fuchs, 2006). Remediation that is delayed until children are older is less likely to be successful (Roberts, Torgesen, Boardman, & Scammacca, 2008; S. E. Shaywitz, Morris, & Shaywitz, 2008).
Much previous research demonstrates that effective reading comprehension requires both efficient word reading and elaborate comprehension processes, the latter including vocabulary, conceptual knowledge, reasoning, inferential skills, and active comprehension strategies (Kirby & Savage, 2008; National Reading Panel, 2000). We suggest that increased early diagnostic assessment is required to determine which children are likely to develop reading difficulties and what the likely sources of those difficulties are, and that intervention that is early, focused on identified weaknesses, and intensive may lead to greater improvements in reading.
Footnotes
Declaration of Conflicting Interests
The author(s) declared no potential conflicts of interest with respect to the research, authorship, and/or publication of this article.
Funding
The author(s) received no financial support for the research, authorship, and/or publication of this article.