
Abstract
The present study examined the structure of the Comprehensive Test of Nonverbal Intelligence–Second Edition (CTONI-2) normative sample using exploratory factor analysis, multiple factor extraction criteria, and higher-order exploratory factor analytic techniques that were not reported in the in the CTONI-2 Examiner’s Manual. Results indicated that retention of the hypothesized CTONI-2 measurement model resulted in several theoretically inconsistent factor loadings, low factor loadings, and the retention of impermissible factors (e.g., factors with no salient loadings). Hierarchical exploratory analyses with the Schmid and Leiman procedure found that the second-order g factor accounted for large portions of total and common variance, in contrast to the two first-order factors that accounted for small portions of dimensional variance. Results suggest that the CTONI-2 provides a strong measure of general intelligence and clinical interpretation should be limited to that level of the measurement instrument.
The Comprehensive Test of Nonverbal Intelligence–Second Edition (CTONI-2; Hammill, Pearson, & Wiederholt, 2009a), a revision of the popular Comprehensive Test of Nonverbal Intelligence (CTONI; Hammill, Pearson, & Wiederholt, 1997), measures nonverbal reasoning abilities across the life span (ages 6-89). The CTONI-2 is composed of six subtests (Geometric Analogies, Geometric Categories, Geometric Sequences, Pictorial Analogies, Pictorial Categories, and Pictorial Sequences) that combine to form two subscale quotients (Geometric and Pictorial) as well as a higher-order full-scale composite which is thought to estimate Spearman’s (1904) general intelligence factor or g. All CTONI-2 test items are presented via matrix arrays that require examinees to point to the correct response rather than respond verbally. As a result, it is suggested that the CTONI-2 may be a more appropriate measure of intelligence for individuals with known or suspected language or motor difficulties (Hammill & Pearson, 2009). It should also be noted that despite the suggestion in the title, “nonverbal” intelligence is not a viable entity as the CTONI-2, and other related tests more accurately measure general intelligence through nonverbal means (Ortiz, Ochoa, & Dynda, 2012).
Despite the suggestion of a multifactored hierarchical assessment structure, the psychometric evidence provided in the Examiner’s Manual (Hammill, Pearson, & Wiederholt, 2009b) did not examine the actual hypothesized CTONI-2 assessment model. Examination of the internal structure of the measurement instrument was limited to subjecting the subtest intercorrelation matrix for the entire CTONI-2 normative sample (N = 2,287) to a principal components analysis (PCA) with a varimax rotation. Results suggested the retention of a single component, interpreted by the test authors as reflecting a general intelligence factor (g) that captured 98% of the variance in the manifest variables. These same procedures were also utilized to validate the original CTONI (Pearson, 2003). Despite the implication that the CTONI-2 is a one-factor test, multiple first-order factors were specified in the measurement instrument and users are encouraged to interpret individual performance along these dimensions. For instance, the Manual suggests that discrepant performance across the Pictorial and Geometric scales may be clinically noteworthy (p. 24) and base rates for observed differences are reported.
Although the aforementioned validation procedures have been referred to as a factor analysis in both the Manual and professional literature (e.g., McCallum, Bracken, & Wasserman, 2001; Pearson, 2003; Rossen, Shearer, Penfield, & Kranzler, 2005), PCA is not considered to be a factor analytic procedure due to the fact that its algorithm differs mathematically from the assumptions of the common factor model (Fabrigar & Wegener, 2012, Gorsuch, 1983). Although it has been argued that there are negligible differences between most principal components and factor analysis solutions (e.g., Fabrigar, Wegener, MacCallum, & Strahan, 1999; Velicer & Jackson, 1990), components analysis is computed without regard for the influence of latent variables and does not discriminate between different dimensions of variance in the manifest variables (e.g., shared and unique variance). As a result, the components derived from PCA should not be interpreted as reflecting latent dimensions such as the general factor (Bentler & Kano, 1990; Jensen, 1998; Preacher & MacCallum, 2003; Widaman, 1993).
Furthermore, the strength of the “general factor” loadings reported in the Manual (p. 76) may be an artifact of method variance as the authors utilized a varimax rotation to further orthogonalize the components derived from their PCA analysis. Components analysis is a data reduction procedure that results in components that are orthogonal to each other thus, an additional orthogonal rotation of the derived components can arbitrarily constrain the ability of subsequent components to account for meaningful variance that can result in a loss of valuable data (Costello & Osborne, 2005). In addition, when components are uncorrelated, it can inflate the values of variance accounted for by the retained components (Gorsuch, 1997; McArdle, 1990).
Also missing from the Manual were proportions of variance accounted for by the higher-order factor (g) and the two first-order factors, higher-order subtest loadings, and subtest specificity estimates. This information is vital given the fact that all cognitive measures are composed of reliable variance that is attributable to a higher-order general factor, reliable variance that is attributable to first-order group factors, and error variance (Carroll, 1993, 1995). In the absence of the variance decomposition procedures described above, clinicians do not have the information necessary for determining the relative importance of the CTONI-2 factor and subtest scores relative to the full-scale IQ. To date, the CTONI-2 has yet to be examined using higher-order variance partitioning procedures such as these.
Despite these limitations, additional examinations of the structural validity of the measurement instrument within the technical literature have been scarce. In the intervening period, since the publication of the original CTONI, published validity studies have largely been limited to examining concurrent and predictive relationships between CTONI/CTONI-2 variables and external measures (e.g., Beaujean et al., 2011; Lassiter, Harrison, Matthews, & Bell, 2001; Lassiter, Matthews, & Feeback, 2007; Rossen et al., 2005). Despite the information provided by these researchers, these procedures are inadequate for validating the internal structure of a measurement instrument (Clark & Watson, 1995; Cronbach & Meehl, 1955). As a result, the underlying factor structure of the CTONI-2 is presently unknown.
Purpose of Current Study
To address these gaps in the literature, the present study examined the latent structure of the CTONI-2 using exploratory factor analysis (EFA) to examine the tenability of the proposed two-factor measurement model as well as the proportions of CTONI-2 subtest variance attributed to the higher-order general dimension and to the two first-order dimensions using the hierarchical exploratory factor analytic techniques described by Carroll (1993, 1995). Given the fact that the CTONI-2 measurement model was not designed to comport with any particular theory of cognitive abilities (Hammill et al., 2009b, p. 2), these procedures are appropriate as a first step in validating and generating hypotheses about the structure of the measurement instrument (Gorsuch, 2003; Kellow, 2005). Although these higher-order procedures have been utilized extensively to evaluate the technical properties of many traditional cognitive assessment measures (see Canivez, 2013, for a review), their application to nonverbal measures such as the CTONI-2 have been less frequent. It is believed that the results from the current study will provide important information for the dissemination of empirically supported interpretive strategies for the CTONI-2.
Method
Participants and Measurement Instrument
The CTONI-2 was standardized on a nationally representative sample of 2,827 participant’s ages 6 to 89 years closely approximating the 2005 U.S. Census estimates for geographic region, gender, race, and parent education level. The CTONI-2 has six subtests (M = 10, SD = 3) that form two first-order factor scales (M = 100, SD = 15): Pictorial Quotient and Geometric Quotient. In addition, the sum of scores from the CTONI-2 subtests combine to form a higher-order full-scale nonverbal IQ (NIQ) composite (M = 100, SD = 15). Average internal consistency estimates range from .83 to .87 for the subtests and from .90 to .95 for the composite scores. Additional psychometric information is provided for the CTONI-2 in the Manual (Hammill et al., 2009b) and an independent test review is available (Delan, Kaya, & Ritter, 2012).
Data Analyses
The intercorrelation matrix of the six CTONI-2 subtests for the entire normative sample (Hammill et al., 2009b, p. 71) was subjected to principal axis EFA) using higher-order validation procedures endorsed by Carroll (1995) using SPSS version 21 for Windows. As recommended by Gorsuch (1983), multiple criteria for determining the number of factors to retain were examined. These procedures included eigenvalues >1 (Guttman, 1954), the visual scree test (Cattell, 1966), standard error of the scree (
For higher-order exploratory analyses, the current study limited iterations in first-order principal axis factor extraction to two in estimating final communality estimates. According to Gorsuch (2003), limiting iterations to two provides an optimal balance between sampling and measurement error in estimating communality, providing stable parameter estimates while protecting against the problem of capitalizing on chance estimation of parameters (MacCallum, Roznowski, & Necowitz, 1992). The correlation matrix for the CTONI-2 normative sample was subjected to a first-run EFA (principal axis extraction of two factors), followed by a promax (oblique) rotation (k = 4; Gorsuch, 2003). Because an indirect hierarchical measurement model was implied for the CTONI-2, higher-order factor analysis using the Schmid–Leiman (1957) procedure was applied to oblique first-order factors to elucidate the structure of the CTONI-2 using the MacOrtho program by Watkins (2004). This procedure allows for the extraction of a second-order factor from a first-order factor correlation matrix. According to Schmid and Leiman (1957), this transforms “an oblique solution containing a hierarchy of higher-order factors into an orthogonal solution which not only preserves the desired interpretation characteristics of the oblique solution, but also discloses the hierarchical structuring of the variables” (p. 53).
Also missing from the Manual were estimates for model-based reliabilities that more accurately reflect the multidimensional nature of the first-order factor scores specified on the measurement instrument (i.e., Carroll, 1993, 1995). In psychometrics, it is common for reliability to be estimated by conventional coefficients such as alpha. However, Chen, Hayes, Carver, Laurenceau, and Zhang (2012) noted that “for multidimensional constructs, the alpha coefficient is complexly determined, and McDonald’s (1999) omega–hierarchical (ωh) provides a better estimate for the composite score and thus should be used” (p. 228). ωh is the model-based reliability estimate for the hierarchical general intelligence factor independent of the variance of group factors. Omega subscale (ωs) is the model-based reliability estimate of a group factor with all other group and general factors removed (Reise, 2012). Omega estimates (ωh and ωs) may be obtained from EFA Schmid–Leiman solutions and were produced using the Omega program (Watkins, 2013). For dimensional variance to be considered sufficiently reliable, Omega coefficients should exceed .50 (Reise, 2012; Reise, Bonifay, & Haviland, 2013).
Results
Factor-Extraction Criteria
Parallel analysis (Horn, 1965) and the MAP (Velicer, 1976) criterion suggested that one factor be retained for the CTONI-2 normative sample. In addition, a visual scree test (Figure 1) indicated evidence for one strong general factor. In sum, none of the extraction tests supported the retention of two factors, as suggested by the CTONI-2 measurement model with the exception of publisher theory/conjecture. Despite factor extraction criteria suggesting extraction of only one factor, two factors were extracted to comport with the proposed test structure indicated in the Manual. Similar procedures have been utilized in higher-order examinations of other cognitive measures (e.g., Dombrowski, Watkins, & Brogan, 2009; Nelson, Canivez, Lindstrom, & Hatt, 2007) in which extraction tests did not support the retention of additional first-order factors. It is believed that these methods provide for a direct examination of publisher theory with results that are potentially relevant for clinicians who utilize the CTONI-2 in practice.

Scree plot of parallel analysis for Comprehensive Test of Nonverbal Intelligence–Second Edition (CTONI-2) subtests (ages 6-89).
First-Order EFA: Two-Factor Extraction
First-run EFA results produced a Kaiser–Meyer–Olkin Measure of Sampling Adequacy coefficient of .854 and Bartlett’s Test of Sphericity χ2(15) = 4,480.58, p < .001. Communality estimates ranged from .312 (Pictorial Categories, Geometric Categories) to .529 (Geometric Sequences). Based on these obtained values, it was determined that EFA procedures were appropriate (Tabachnick & Fiddell, 2007). Obtained pattern and structural coefficients are provided in Table 1. Consistent with previous research (e.g., Gorsuch, 1997; McArdle, 1990), the first eigenvalue accounted for significantly less variance in the CTONI-2 variables (50.61%) when compared with the explained variance attributed to the first component reported in the CTONI-2 Manual. Whereas the subtest loading patterns permitted the identification of first-order Geometric and Pictorial factors, Geometric Analogies cross-loaded on both latent dimensions and Pictorial Sequences migrated from the Pictorial factor and was associated with a theoretically inconsistent factor. Correlations between the first-order factors was .83 based on the promax rotation (k = 4), and indicated the presence of a higher-order dimension.
Factor Pattern and Structure Coefficients From Principal Axis Extraction of Two CTONI-2 Factors With Promax Rotation (k = 4) and Factor Correlations.
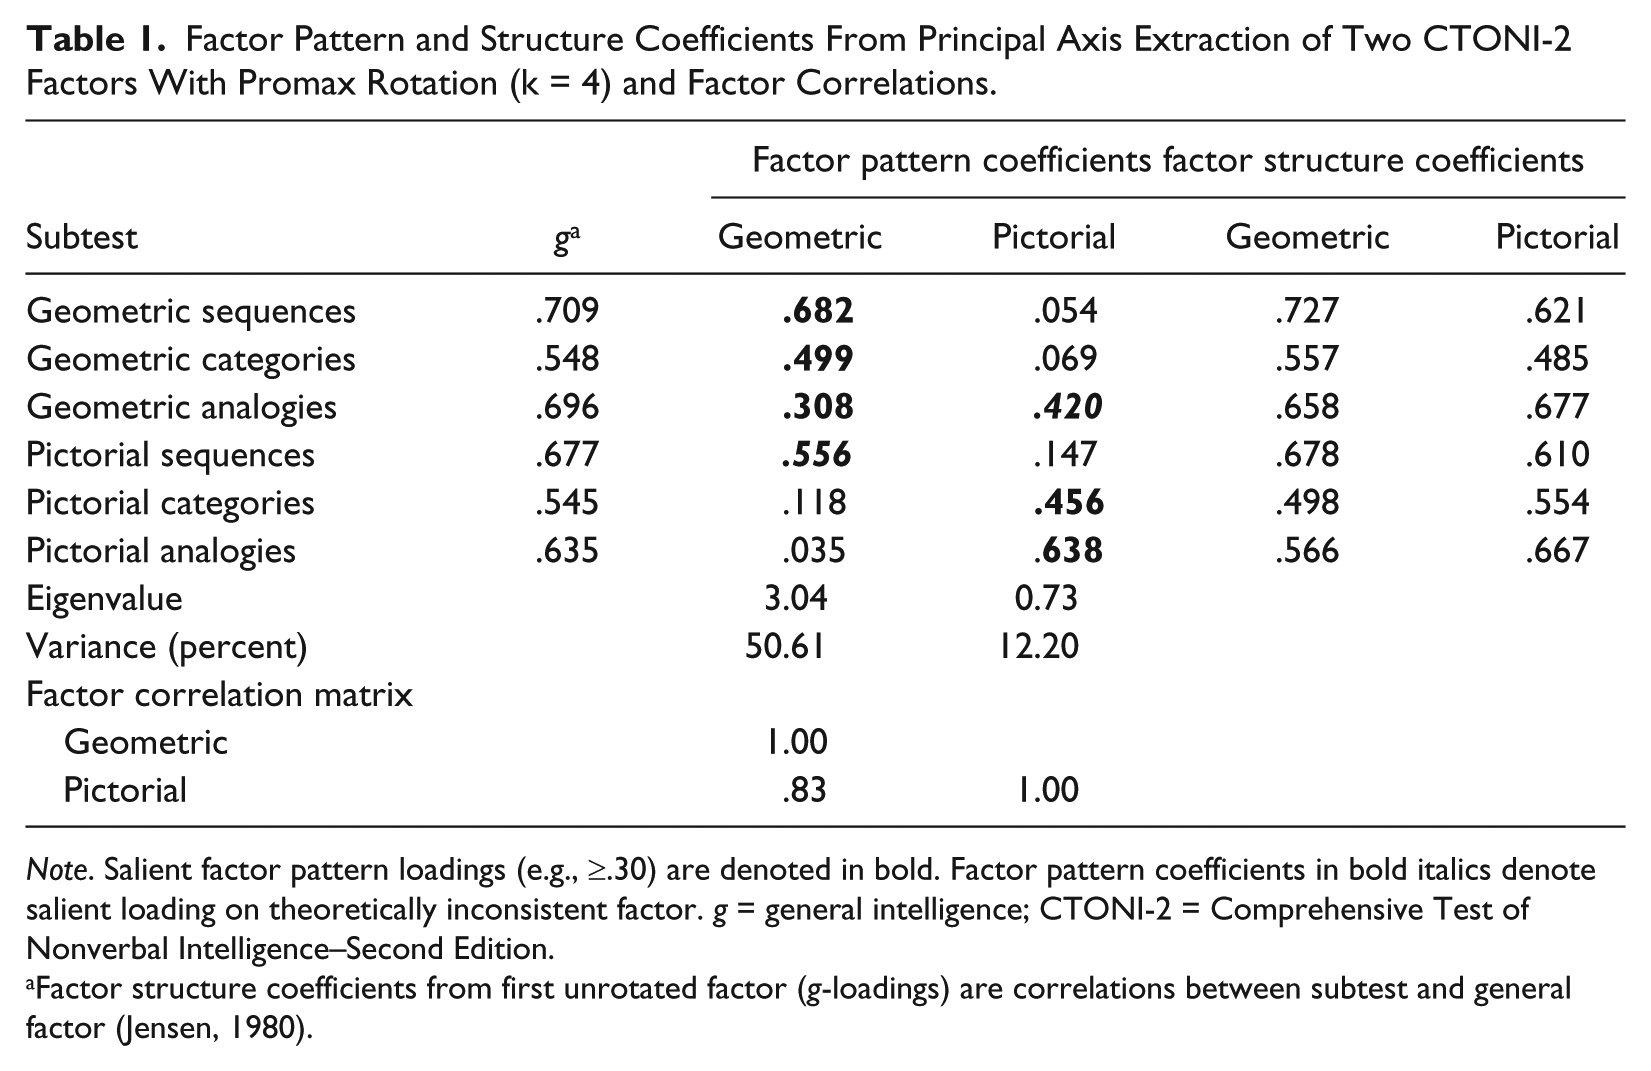
Note. Salient factor pattern loadings (e.g., ≥.30) are denoted in bold. Factor pattern coefficients in bold italics denote salient loading on theoretically inconsistent factor. g = general intelligence; CTONI-2 = Comprehensive Test of Nonverbal Intelligence–Second Edition.
Factor structure coefficients from first unrotated factor (g-loadings) are correlations between subtest and general factor (Jensen, 1980).
Schmid–Leiman Higher-Order Analysis: Two-Factor Solution
Higher-order analyses using the Schmid–Leiman (1957) procedure are presented in Table 2. The second-order g factor accounted for 37% of the total variance and 87.1% of the common variance. The general factor also accounted for 27% to 45% (Mdn = 39%) of the individual subtest variability. At the first-order level, Geometric Ability accounted for an additional 3.2% of the total variance and 7.5% of the common variance, and Pictorial Ability accounted for an additional 2.3% of the total variance and 5.4% of the common variance. The first- and second-order factors combined to measure 44.3% of the variance in CTONI-2 scores resulting in 55.7% unique variance (combination of specific and error variance). Subtest specificity (reliable variance unique to the individual measures) ranged from .33 to .56.
Sources of Variance in the Comprehensive Test of Nonverbal Intelligence–Second Edition (CTONI-2) for Ages 6 to 89 (N = 2,287) According to an Orthogonalized (Schmid & Leiman, 1957) Higher-Order Factor Model.
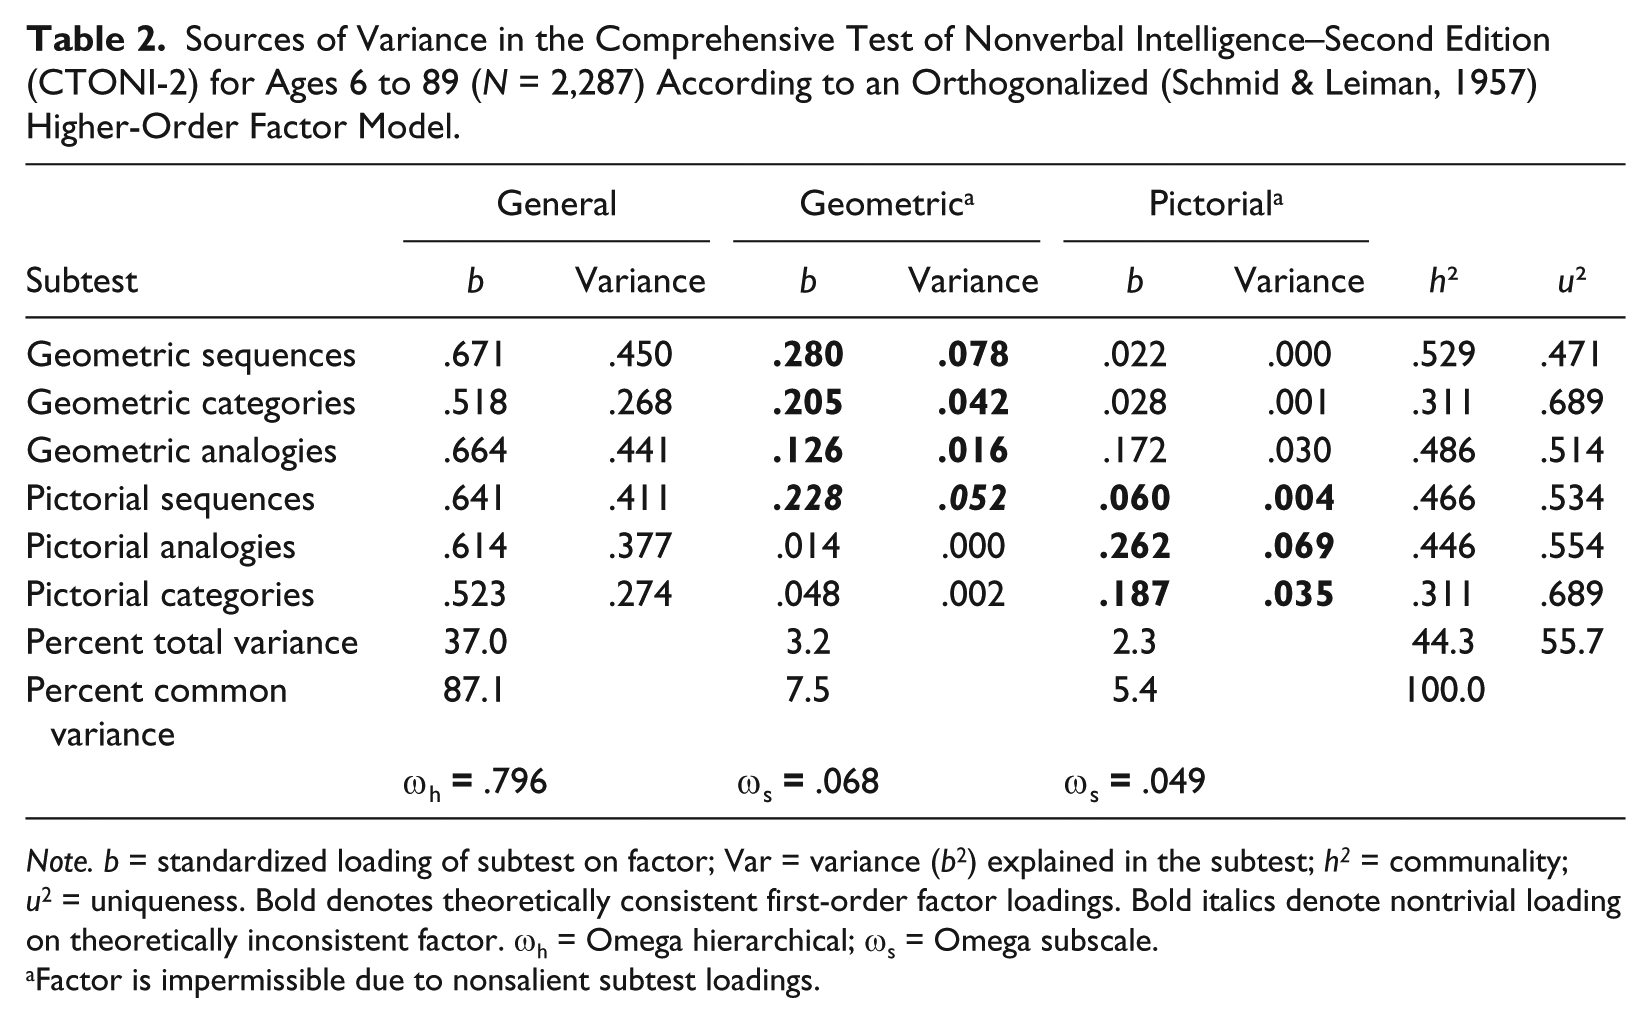
Note. b = standardized loading of subtest on factor; Var = variance (b2) explained in the subtest; h2 = communality; u2 = uniqueness. Bold denotes theoretically consistent first-order factor loadings. Bold italics denote nontrivial loading on theoretically inconsistent factor. ωh = Omega hierarchical; ωs = Omega subscale.
Factor is impermissible due to nonsalient subtest loadings.
Model-Based Reliability Estimates
ωh and ωs coefficients were estimated based on the Schmid–Leiman results in Table 2. To examine latent factor reliability of the theoretically based scores, Picture Sequences was included in the Pictorial factor for estimation of ωs. The ωh coefficient for general ability (.796) was high and sufficient for scale interpretation. However, the ωs coefficients for the two implied CTONI-2 group factors (Geometric and Pictorial) were considerably lower (.068 and .049, respectively), each possessing too little true score variance for confidant clinical interpretation (Reise, 2012; Reise et al., 2013).
Discussion
The recently revised joint standards for educational and psychological testing (American Educational Research Association [AERA], American Psychological Association [APA], & The National Council on Measurement in Education [NCME], 2014) stipulate that the dimensions purported to be measured by a psychological test must be supported with appropriate psychometric evidence (e.g., reliability and validity studies). Although the CTONI-2 is designed to measure two first-order factors, its hypothesized multilevel structure was not examined in the Manual. Given the absence of relevant construct validity information available in the CTONI-2 Manual and in the available technical literature, additional information is needed to support the clinical interpretation procedures advocated for the CTONI-2 in applied practice (e.g., Hammill & Pearson, 2009). Accordingly, the purpose of the present study was to examine the structural validity of the CTONI-2 using exploratory factor analytic procedures that take into account the higher-order structure of the measurement instrument. The present study sought to clarify the structural validity of the CTONI-2 scores and to apportion subtest variance correctly according to higher-order and lower-order dimensions (e.g., Carroll, 1995). It is believed that the results from these analyses will better inform interpretive practice for the measurement instrument.
Inspection of oblique pattern coefficients for the first-order factors (Table 1) indicated that retention of two factors resulted in subtest migration (subtest that loads higher on a theoretically inconsistent factor) and cross-loading (subtest with salient loadings on both latent dimensions). In considering these results, it is worth noting that in higher-order studies of the Reynolds Intellectual Assessment Scale (RIAS; Dombrowski et al., 2009; Nelson et al., 2007), where researchers proceeded to examine publisher theory despite lack of empirical support from extraction tests, no theoretically inconsistent factor loadings were observed. That is, those constructs were at least supported by oblique subtest loadings that aligned with theoretically consistent first-order factors. This was not observed for the CTONI-2, indicating that evidence for the viability of the Pictorial and Geometric factors was questionable prior to commencing with appropriate higher-order analysis (e.g., Carroll, 1995).
When applied to the CTONI-2 normative sample, the Schmid–Leiman (1957) transformation demonstrated that the reliable variance for each CTONI-2 subtest can be sourced to multiple dimensions. The most important of these dimensions was general intelligence which accounted for substantially more variance in the six CTONI-2 subtests than any of the orthogonal first-order factors. In addition, the unique component (a mixture of specific and error variance) was extensive in all subtests ranging from 47% (Geometric Sequences) to 69% (Geometric Categories, Pictorial Categories) of explained variance. The combined effects of general intelligence and uniqueness overshadowed the influence of the two hypothesized CTONI-2 first-order factors. The first-order factors accounted for 5.4% (Pictorial) to 7.5% (Geometric) of the common variance and 2.3% (Pictorial) to 3.2% (Geometric) of the total variance. Whereas the ωh coefficient for general intelligence (.796) was high and sufficient for scale interpretation, ωs coefficients for the Geometric (.068) and Pictorial (.049) factors were extraordinarily small, indicating that interpretation beyond the NIQ is hopelessly flawed (Reise, 2012; Reise et al., 2013).
On balance, the CTONI-2 appears to provide a relatively strong estimate of general cognitive ability (g). Nevertheless, predictive relationships between the NIQ and criterion achievement measures in the Manual were noticeably weaker when compared with similar estimates from more diverse intelligence tests such as the Wechsler Scales. DeThorne and Schaefer (2004), suggest that this attenuation is not unique to the CTONI-2 and is the product of the fact that traditional verbal tasks (e.g., Vocabulary), that contain large portions of g variance, are omitted from nonverbal measures.
In addition, it appears that the CTONI-2, similar to many tests of cognitive abilities, may overestimate the number of factors when disregarding traditional validation procedures such as EFA and more restrictive extraction criteria such as HPA and MAP (Canivez, 2013; Frazier & Youngstrom, 2007). Inspection of the Schmid–Leiman results in Table 2 reveal that although Pictorial Analogies was aligned (b ≥ .20; Carroll, 1993) with the Pictorial factor, all Pictorial subtests failed to load saliently (e.g., ≥.30) on that latent dimension once the reliable variance attributable to the general factor was partialed out. Although it may be argued that the results from the current study do nothing but confirm the PCA analysis that was reported in the CTONI-2 Manual, these results did not appear to guide the development of the measurement instrument as additional first-order factors were specified by the test authors. As a result, the present analysis is the first direct examination of the specified structure of the CTONI-2 and is one of the few studies to decompose the subtest variance of a nontraditional cognitive assessment measure using recommended higher-order procedures (e.g., Carroll, 1995). These results suggest that if assessment and interpretation of first-order dimensions is of critical importance, the CTONI-2 test authors will likely need to increase the number of subtests estimating those dimensions to increase the amount of variance at that level of measurement (Canivez, 2011).
Limitations and Future Directions
The present study is the first to examine the internal structure of the CTONI series using appropriate factor analytic techniques (e.g., Bentler & Kano, 1990; Costello & Osborne, 2005; Fabrigar & Wegener, 2012). Nevertheless, the present study is not without limitations that should be taken into consideration when interpreting these results. Most notably, the results are derived from a single intercorrelation matrix representing the entire CTONI-2 normative sample spanning an expansive age range. Although this is the only matrix provided in the CTONI-2 Manual, additional examination of the construct validity of the measurement instrument at different points of the age span would be beneficial. 1 In addition, the CTONI-2 Manual refers to the Geometric and Pictorial dimensions as “contexts in which the abilities are measured” (Hammill et al., 2009b, p. 3), and unique aspects of the CTONI-2 subtests (e.g., analogies, categories, and sequences) as reflecting higher-order cognitive abilities. Therefore, it may be useful to examine the viability of competing measurement models along these lines using confirmatory factor analytic (CFA) techniques. Such an examination would permit clinicians to be able to consider the convergence or divergence of CFA and EFA results for the measurement instrument.
Although EFA and CFA are considered to be complimentary procedures, Gorsuch (1983) noted that they provide answers to different empirical questions and that when the results from these procedures are in agreement, greater confidence can be placed in the internal structure of a test. Related investigations (e.g., Lakin, 2012; Lakin & Gambrell, 2012) of other pictorial-based cognitive measures suggest that these latent dimensions may be plausible alternatives to those specified in the CTONI-2. Similarly, CFA procedures may be instructive in uncovering the latent dimensions sampled by CTONI-2 measures.
Although the present results suggest that a strong higher-order dimension akin to g dominates CTONI-2 measures, a question regarding what this dimension actually represents remains unanswered. Whereas the Manual reports moderate to strong correlations between the NIQ and several IQ scores from more comprehensive measures of intelligence, results from applied studies have been less consistent. Whereas Lassiter et al. (2001) found that the NIQ for the CTONI correlated most strongly with a measure of Fluid Reasoning (Gf) on the Kaufman Adolescent and Adult Intelligence Test, a similar investigation (Lassiter et al., 2007) found equivalent correlations between the NIQ and measures of g and Gf on the Woodcock Johnson III. Similar research has yet to be conducted on the CTONI-2 and would be instructive for determining whether or not the NIQ is best interpreted as a measure of g or Gf. While distinguishing the unique effects of Gf from g may be difficult as isomorphism between these two latent dimensions has commonly been reported within the psychometric literature (e.g., Weiss, Keith, Zhu, & Chen, 2013a, 2013b), Golay, Reverte, Rossier, Favez, and Lecerf (2013) were able to disentangle these two constructs on the French version of the Wechsler Scale using Bayesian structural equation modeling.
Conclusion
Results from the current study do not support the test structure reported in the CTONI-2 Manual. Whereas strong support was found for the structural validity of the NIQ, retention of additional first-order factors was not supported. As a consequence, general intelligence accounts for the vast majority of common variance in the CTONI-2; thus, interpretation beyond the NIQ is not advised. Although the CTONI-2 Manual encourages users to interpret individual performance across the Geometric and Pictorial dimensions, these results suggest that interpretation of those constructs may result in overinterpetation of the measurement instrument (Glutting, Watkins, Konold, & McDermott, 2006) and that these measures should be more appropriately conceptualized as “pseudo-factors” and should not be used for diagnostic decision making at the present time.
Footnotes
Declaration of Conflicting Interests
The author(s) declared no potential conflicts of interest with respect to the research, authorship, and/or publication of this article.
Funding
The author(s) received no financial support for the research, authorship, and/or publication of this article.