



Abstract
There is hardly any cross-cultural research on the measurement invariance of the Brief Multidimensional Students’ Life Satisfaction Scales (BMSLSS). The current article evaluates the measurement invariance of the BMSLSS across cultural contexts. This cross-sectional study sampled 7,739 adolescents and emerging adults in 23 countries. A multi-group confirmatory factor analysis showed a good fit of configural and partial measurement weights invariance models, indicating similar patterns and strengths in factor loading for both adolescents and emerging adults across various countries. We found insufficient evidence for scalar invariance in both the adolescents’ and the emerging adults’ samples. A multi-level confirmatory factor analysis indicated configural invariance of the structure at country and individual level. Internal consistency, evaluated by alpha and omega coefficients per country, yielded acceptable results. The translated BMSLSS across different cultural contexts presents good psychometric characteristics similar to what has been reported in the original scale, though scalar invariance remains problematic. Our results indicate that the BMSLSS forms a brief measure of life satisfaction, which has accrued substantial evidence of construct validity, thus suitable for use in cross-cultural surveys with adolescents and emerging adults, although evaluation of degree of invariance must be carried out to ensure its suitability for mean comparisons.
Life satisfaction forms an important component of subjective well-being among adolescents and emerging adults, as it has been associated with a host of health, educational, and behavioral outcomes (Bussing et al., 2009; Haranin, Huebner, & Suldo, 2007; Proctor, Linley, & Maltby, 2009). In assessing life satisfaction among students, there are various measures currently available, one of the most popular being Huebner’s Multidimensional Life Satisfaction Scale (MSLSS; Huebner & Gilman, 2002). This scale has 40 items assessing satisfaction with life in general, and satisfaction in five domains perceived to be salient for adolescents: self, family, friends, living environment, and school. Since its introduction, the scale has been used in various contexts to assess outcome in adolescents and emerging adults (Galindez & Casas, 2011; Greenspoon & Saklofske, 1997; Huebner, Laughlin, Ash, & Gilman, 1998; Weber, Ruch, & Huebner, 2013).
To deal with the often considerable time and resource constraints in large-scale surveys, Huebner has developed a brief version of the MSLSS. This BMSLSS contains six items (BMSLSS; Huebner, Seligson, Valois, & Suldo, 2006). Five items assess satisfaction in each of the domains previously mentioned, while the sixth evaluates global life satisfaction (Seligson, Huebner, & Valois, 2003). The scarce data available indicate that the BMSLSS has good psychometric properties (Huebner, Suldo, Valois, Drane, & Zullig, 2004). For instance, Zullig, Huebner, Gilman, Patton, and Murray (2005) evaluated its psychometric properties in the United States and reported that the measure has good internal consistency, construct, and criterion validity, and shows adequate discriminant validity. Similar results in studies involving both adolescents and emerging adults have been reported from other parts of the world, such as Serbia (Jovanovic & Zuljevic, 2013) and Turkey (Civitci, 2007; Siyez & Kaya, 2008).
Despite its potential usefulness as a brief and valid measure of salient aspects of the psychosocial functioning of adolescents and emerging adults, there seems to be a dearth of research evaluating the cross-cultural validity and invariance of this measure (the terms invariance and equivalence are used interchangeably). Two types of invariance are addressed here. The first and most commonly studied invariance examines whether the construct underlying the instrument, namely, life satisfaction, is measured in each cultural context and, if so, whether scores can be compared across cultures (Van de Vijver & Leung, 2000). The second type of invariance compares life satisfaction at individual and country levels. It is referred to as multi-level equivalence (Van de Vijver & Poortinga, 2002) or isomorphism (Chan, 1998; Fischer, 2009). In multi-level equivalence, or isomorphism, the key questions are as follows: Does life satisfaction have the same meaning at individual and country level, or does score aggregation of all individuals pertaining to a cultural group lead to incomparabilities? In both types of analysis, life satisfaction is the latent variable and the items are the indicators. For both types of invariance analysis, three levels of invariance are examined: configural invariance (all items are associated with life satisfaction in each country), metric invariance (all items are associated with life satisfaction in the same way across countries), and scalar invariance (the regression function linking the scores on an item to satisfaction scores has the same intercept in all cultures). In the individual-level analysis, all cultural groups are compared, whereas in the multi-level analysis, the first “group” is formed by the pooled individual data of all cultures and the second “group” is formed by the cultures (each country constitutes one observation; data in cells are average scores obtained in the various cultures; see Fontaine & Fischer, 2010). We examined both individual- and country-level invariance to be able to evaluate the extent to which BMSLSS can be used for cross-cultural comparisons.
To the best of our knowledge, the current study presents the first effort to investigate this measure in a cross-cultural context. We set out to examine the following:
Whether the BMSLSS factorial structure is invariant across contexts;
Whether the BMSLSS shows multi-level invariance at individual and country level.
Method
Sample and Procedures
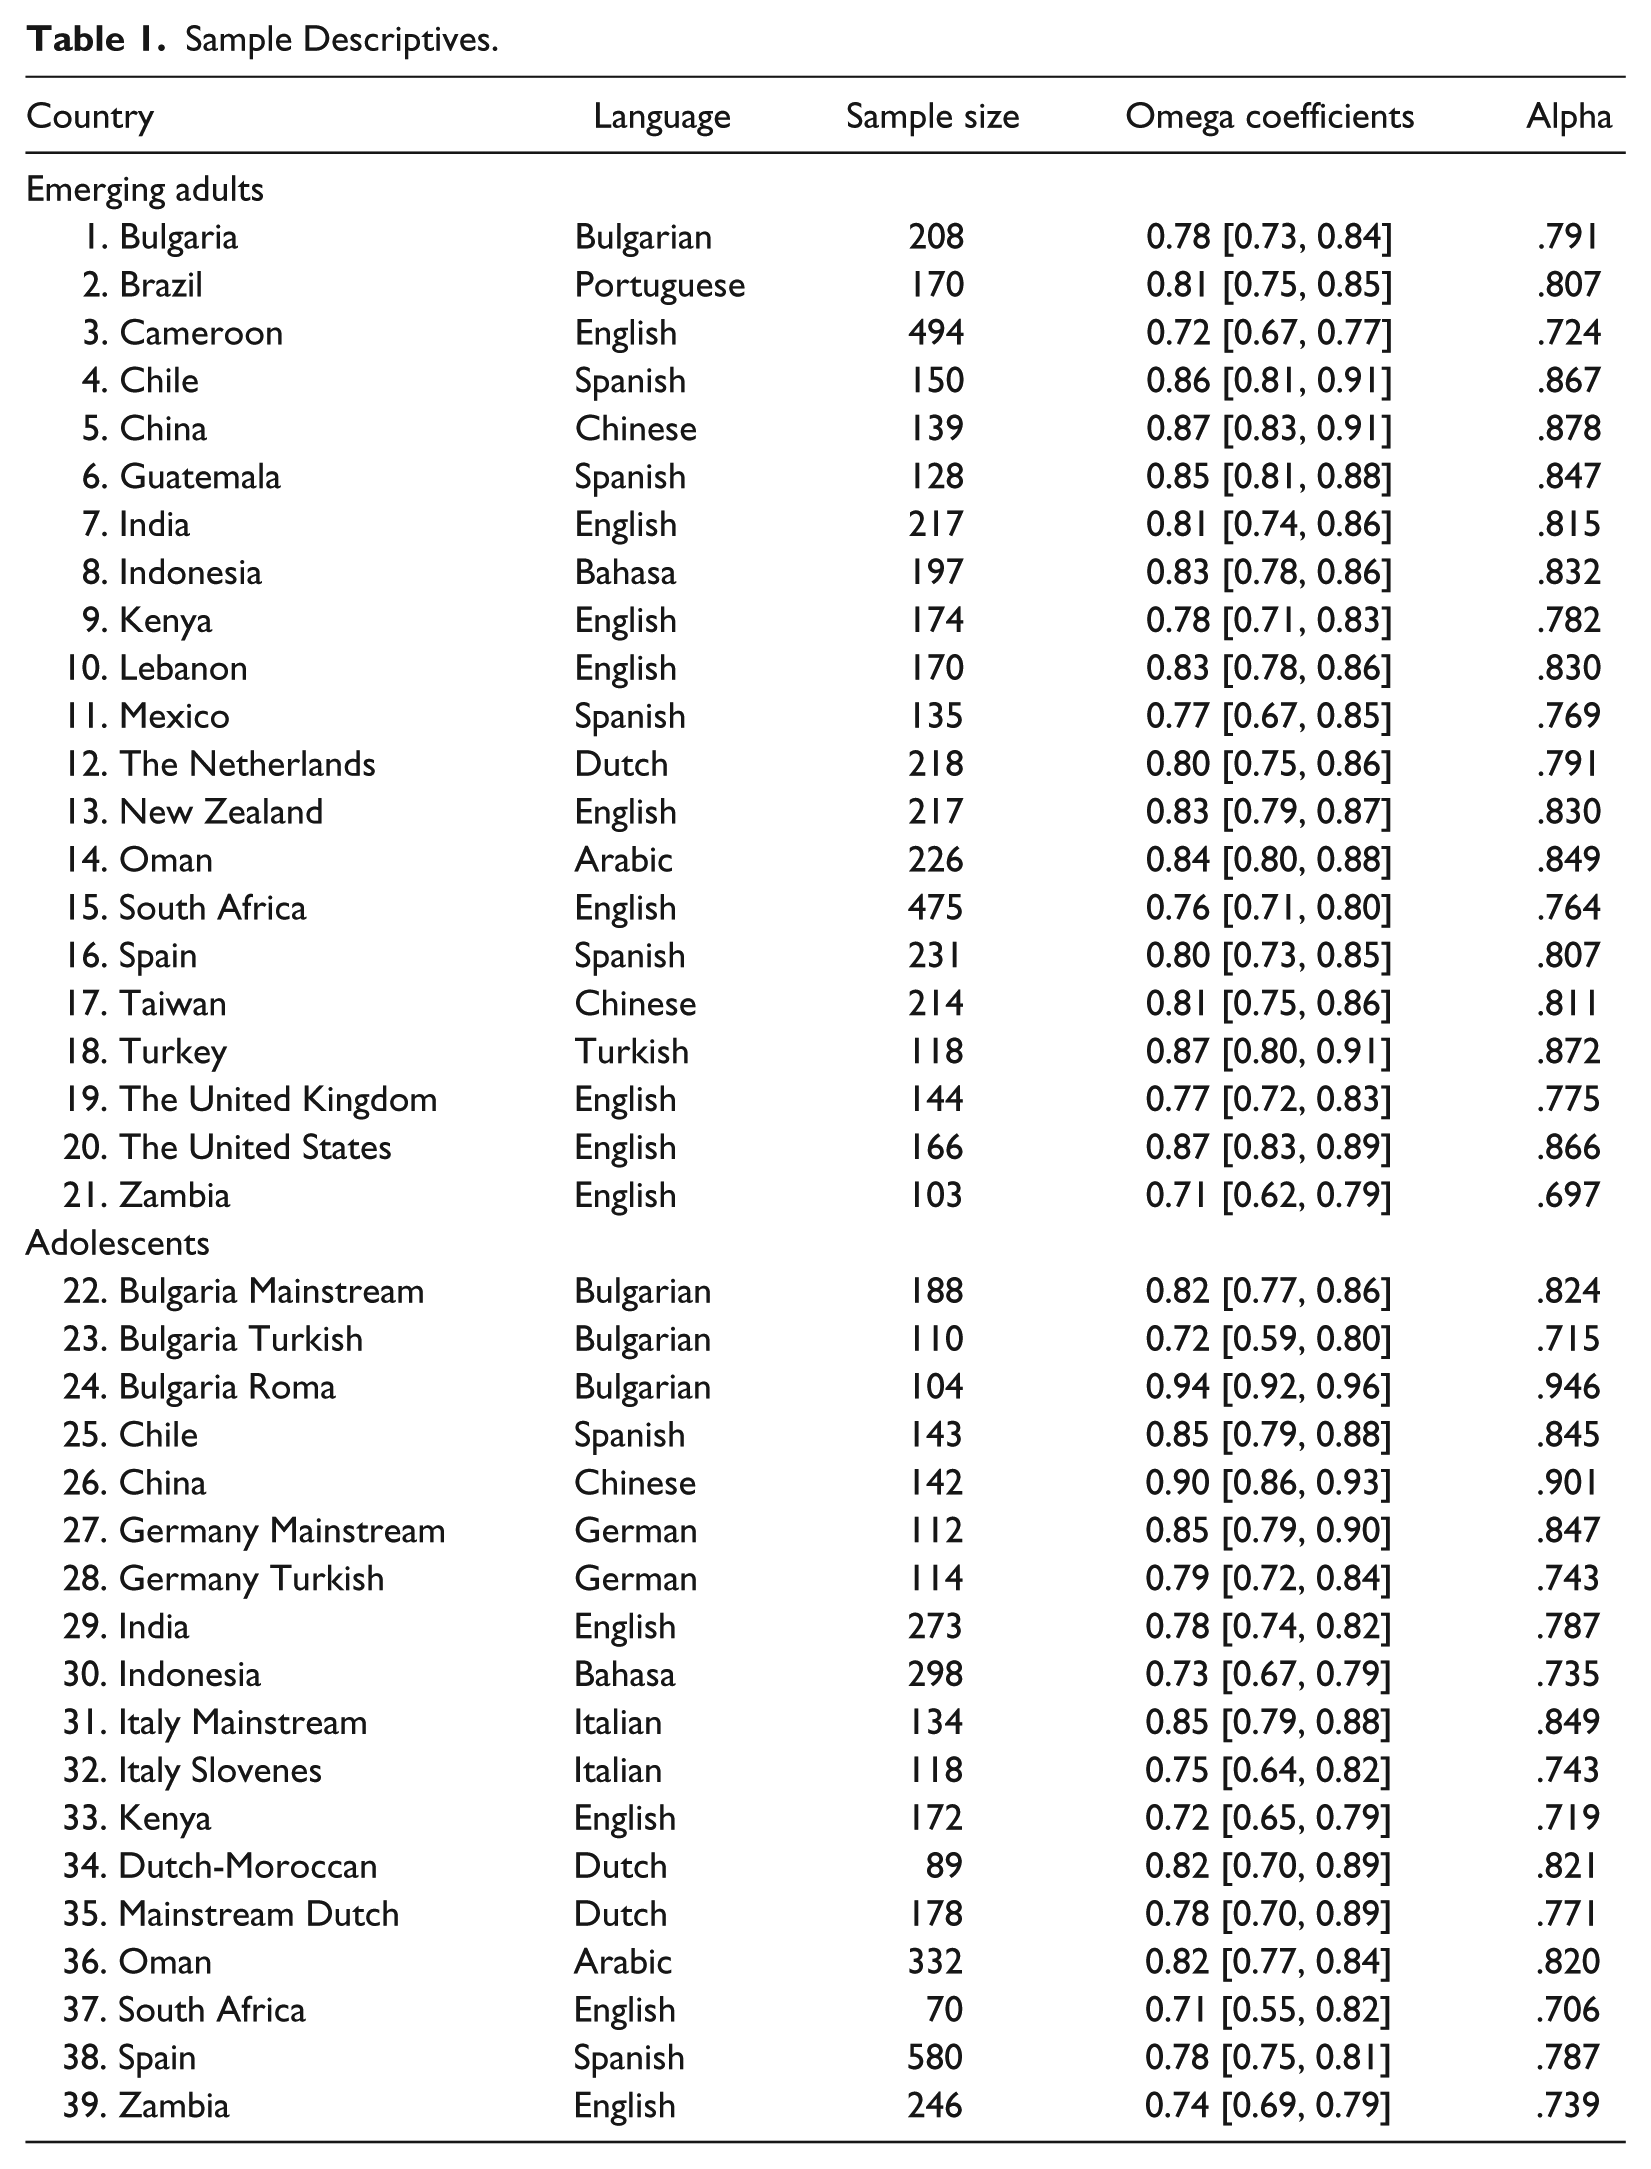
The study was carried out in 23 countries across the world as part of a larger study on mental health and well-being in these countries. The data were collected among adolescents and emerging adults (see Table 1 for sample descriptives). In this article, the term adolescents is used to refer to samples recruited from high schools, whereas the term emerging adults refers to samples of undergraduate students recruited from universities. The emerging adult sample is analyzed on the basis of countries, whereas the adolescent sample is analyzed based on ethnic groups within countries. This was motivated by the fact that in several countries, the high school samples also had large numbers of adolescents of minority background (e.g., Moroccan-Dutch in the Netherlands). As there is evidence that scoring patterns and mean scores on scales such as those of life satisfaction may differ significantly between adolescents of majority and minority background (e.g., Alonso-Arbiol, Abubakar, & Van de Vijver, 2014), we decided to separate the samples accordingly. In most of the countries, university samples were recruited from a single university, with the exception of a few countries such as Kenya, Spain, and Cameroon. Adolescent data were collected from multiple schools ranging per country from 1 to 10 schools. However, no attempts were made to get a nationally representative sample. In each of these countries, ethical approval and informed consent were attained based on the requirements of the local institutional review boards (IRBs). Translations and back-translation approaches were used to develop the non-English versions of the questionnaire as needed.
Sample Descriptives.
Measure
The BMSLSS (Huebner et al., 2006) was administered. The measure includes six items, five of which focus on specific domains (family, friends, school, self, and living environment), and one concerning global well-being. The sixth item was initially included as a validity check (i.e., to check the extent to which the total score from the five items correlates to a general well-being question). In our analysis, this sixth item is also included in the total score, as we have observed that its inclusion enhances reliability. A sample item includes “I would describe my satisfaction with my family life as,” scored on a 7-point Likert-type scale ranging from 1 (terrible) to 7 (delighted).
Analysis
Our analysis comprised three main steps. First, we estimated a multi-group confirmatory factor analysis (MGCFA) model using Amos 18 (Arbuckle, 2009). We had very limited missing data in this scale. For adolescents, the percentage of missing data was between 0.2% and 0.8% per item, while for young adults, the percentage was between 0.0% and 0.2%. Given this very low rate of missing data, we used mean replacement based on data split by country/group. A unidimensional model including all six items was estimated. We assessed the goodness of fit for each model using various parameters, including Chi-square statistics, the Tucker–Lewis index (TLI), and the comparative fit index (CFI). The general guideline is that a non-significant chi-square reflects an acceptable fit to the data (Hu & Benter, 1999). However, given the sensitivity of the chi-square statistic to sample size, we did not consider this in the current study. For TLI and CFI, values greater than .95 are considered to reflect an excellent fit, while values between .95 and .90 are considered indicative of an acceptable fit. The root mean square of approximation (RMSEA) is also reported, as it has been shown to be sensitive to model misspecification. Values of less than .06 are considered indicative of a good fit, while those between .06 and .08 are considered indicative of an acceptable model.
In a multi-group analysis, the change in CFI is an important indicator for evaluating the suitability of hierarchically nested models: A CFI change of less than .010 is taken to be supportive of the more restrictive model. Three levels of statistical equivalence are important (van de Schoot, Lugtig, & Hox, 2012). The first is configural equivalence, which is achieved when items in the measuring instrument show the same pattern of factor loadings within each group. The second level is metric equivalence, which indicates whether or not respondents from different groups answer to the questions in a similar manner. It requires that the factor loadings linking items and constructs are equal, which is an indicator of similarity of measurement unit (the metric of the response scale). The third level is scalar invariance, which requires equality in both factor loadings and intercepts across groups. It has been recommended that in the absence of either metric or scalar invariance, one may release invariance constraints on some of the factor loadings or intercepts to evaluate whether they have partial invariance at the respective level (Meredith, 1993). Mean score comparisons are only permissible when one achieves scalar (full or partial) invariance; when one achieves metric (full or partial) invariance, then it is only permissible to compare the relationship between variables across groups (Milfont & Fischer, 2010).
Following multi-group analysis and the observation that some items are not invariant, we carried out a next level of analysis to examine the impact of non-invariant items on country-level means and rankings. In addition, we checked for multi-level invariance or isomorphism at individual and country level. Multi-level invariance was evaluated on MPlus version 7.1 (Muthén & Muthén, 2010).
Finally, to evaluate internal consistency of the scale per country, both Cronbach’s alpha and omega coefficients with a 95% confidence interval were computed. The omega coefficients were computed using the MBESS package in R. Cronbach’s alpha has previously come under criticism as being an inadequate measure of reliability of psychological scales for various reasons (for details, see Schmitt, 1996; Starkweather, 2012). We therefore computed the omega coefficient so as to be able to estimate reliability in an alternative manner. Values of above .70 are considered acceptable when examining internal consistency (Cicchetti, 1994).
Results
Factorial Structure Among Adolescents
We tested a single factor model as originally conceptualized by the test developer. The data indicated that the model did not have a good fit at the configural level, with some of the fit indices being below acceptable standards, χ2(162, N = 3043) = 547.32, p < .001, TLI = .895, CFI = .937, and RMSEA = .027 (fit indices prior to adding the correlated error). An examination of modification indices indicated the need to add one correlated error between Items 1 and 2. Following these modifications, fit indices were all within acceptable standards (see Table 2 for the full results). Having achieved configural invariance, we evaluated metric invariance. While most of the indices were acceptable, the difference in CFI was above the recommended cutoff of .01: ΔCFI = .021. We therefore freed the factor loadings of three items based on modification indices (we freely estimated loadings for Items 1, 2, and 3). Having carried out these changes, the fit indices were all within acceptable ranges. Having achieved partial metric invariance, we then tested for scalar invariance. The fit indices at scalar level were all below acceptable standards. Relaxing invariance constraints for the intercepts of three of the six items (Item 2, 3, and 4) improved the fit indices. The fit indices were, however, still below the acceptable standards.
Invariance Models and Goodness-of-Fit Indexes of the Multi-Group Analysis for Adolescents and Emerging Adults.

Note. RMSEA = root mean square error of approximation; TLI = Tucker–Lewis index; CFI = comparative fit index; Δ = change in the model.
Factorial Structure Among Emerging Adults
We tested a single factor model as originally conceptualized by the test developer. The data indicated that the configural model had a good fit after adding a single correlated error term for Items 2 and 3 (see Table 2 where all the fit indices are presented). Having achieved configural invariance, we evaluated metric invariance. While most of the indices were acceptable, the difference in CFI was above the recommended cutoff: ΔCFI = .016. We therefore freed the factor loadings of three items based on modification indices (we relaxed item loadings for Items 2, 4, and 5). With these changes, the fit indices were all within acceptable standards. Having achieved partial metric invariance, we then tested for scalar invariance. The fit indices for the scalar level were all below acceptable standards. We then released the intercepts of three items that reduced the fit most (Item 2, 4, and 5). Having carried out these modifications, the fit indices improved; however, they were still below standards of acceptability.
Cross-Context Ranking Based on Observed Full Scalar Invariance or Partial Scalar Invariance
The lack of scalar invariance suggested that scores cannot be compared across cultures. Previous research has noted similar difficulties in attaining full scalar invariance in large-scale surveys (Byrne & Van de Vijver, 2010), and it has been suggested that comparing full and partial invariance provides some insight into the comparability of scores if full scalar invariance has not been obtained. Consequently, we computed the mean scores based on all the six items and mean scores based on only the three items showing weak invariance. At an individual level, these data were strongly and significantly correlated both for adolescents, r(3403) = .921, p < .001, and emerging adults, r(4336) = .935, p < .001. Similar results were seen at the country/cultural level, where the correlations were r(18) = .983, p < .001, and r(21) = .979, p < .001, for adolescents and emerging adults, respectively. Moreover, we also examined the extent to which the country and cultural group ranking differ based on whether or not the invariant items were used alone or used for all the items. Our findings indicate that not only are their means closely related, but the ranking is very similar, with most of the groups retaining the same rank, while others change by one or two ranks, and only one group shows a 3-point change (see Tables 3 and 4 where these ranks are presented). We also evaluated the correlations between rankings based on the invariant and non-invariant items. Again, these correlations were strong: adolescents, r(18) = .967, p < .001, and emerging adults, r(21) = .981, p < .001. Our findings suggest that the bias due to the lack of invariance at scalar level may be too small to make it practically consequential. However, researchers using the scale in large surveys will need to evaluate the degree of bias, and its impact on ranking in their dataset, before comparing group- or country-level means.
Ranking by Invariant and Variant Items Adolescents.

Note. MLSF = mean life satisfaction full score; MINV = mean life satisfaction using only invariant items; diff rank = difference in ranking.
Ranking by Invariant and Variant Items Emerging Adults.
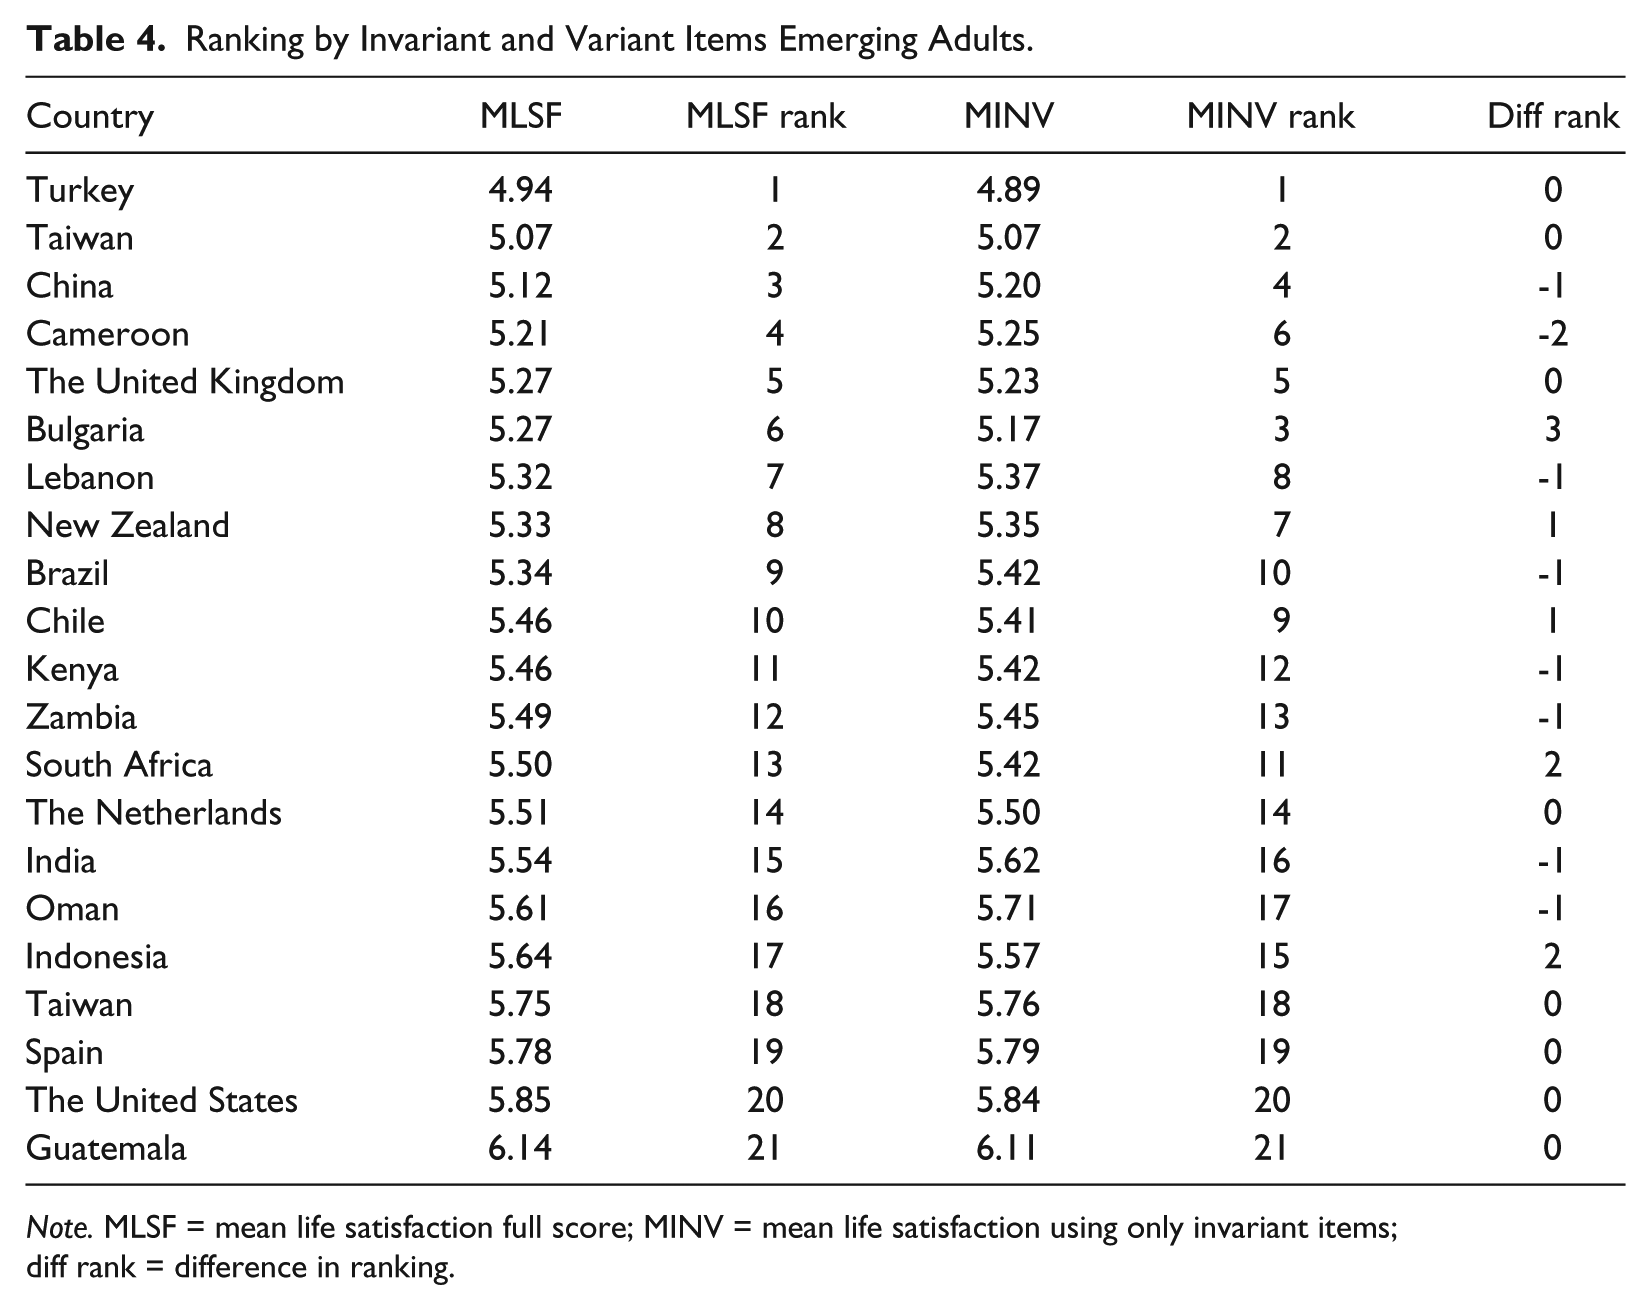
Note. MLSF = mean life satisfaction full score; MINV = mean life satisfaction using only invariant items; diff rank = difference in ranking.
Multi-Level Invariance
We addressed multi-level invariance in both the adolescents’ and the emerging adults’ samples. In the adolescent sample, we got evidence of configural invariance at individual and country level. The fit indices in these model were all within acceptable standards, χ2(30, N = 18) = 2,161.70, p < .001, TLI = .922, CFI = .953, and RMSEA = .040. A similar pattern of results was observed for the emerging adult sample, where the fit indices showed acceptable values, χ2(30, N = 21) = 2,708.31, p < .001, TLI = .921, CFI = .963, and RMSEA = .040.
Internal Consistency
Internal consistencies were evaluated using both alpha and omega coefficients. We investigated the internal consistency of the BMSLSS. The alpha values ranged from .69 to .94 and the omega values from .71 to .94 (see Table 1 for the results per country).
Discussion
The current study set out to investigate the invariance of the BMSLSS across contexts and age, as well as to evaluate whether its structural patterns at individual level can be replicated at country level. We observed some degree of invariance across contexts (including partial scalar invariance), as well as configural multi-level invariance (isomorphism), indicating that both individual and country differences refer to life satisfaction. We achieved configural invariance, an indicator that the unidimensional model works relatively well across cultural contexts and age groups. Moreover, in all the countries, the internal consistency values were all above the acceptable cutoff values. These good psychometric results are generally in line with what has been reported in earlier studies investigating the psychometric values of BMSLSS (Funk, Huebner, & Valois, 2006; Man et al., 2014).
However, a more complicated picture arises when one asks the question: Can the BMSLSS be used in cross-country comparisons of the level of life satisfaction? Using an MGCFA model, we could not achieve full scalar invariance. Two points are noteworthy here. First, while there have been no studies of the cross-cultural invariance of BMSLSS, invariance analyses involving other life satisfaction scales such as the MSLSS and the Satisfaction with Life Scale (SWLS) have reported problems in achieving scalar invariance (Tucker, Ozer, Lyubomirsky, & Boehm, 2006; Zanon, Bardagi, Layous, & Hutz, 2013). These problems could arise from methodological issues, such as a lack of semantic equivalence of translated items, differences in response styles across cultural contexts, or differential meaning of life satisfaction items across countries. Our data do not allow for a more fine-grained evaluation of which of these aspects contributes (alone or in combination) to the comparability problem. Future studies in which mixed-method approaches are used to evaluate the BMSLSS may provide a richer understanding of the sources of bias. In addition, although the structural equation modeling (SEM) is commonly used for invariance analysis, it can be problematic, especially when dealing with comparisons involving a large number of cultural groups. As noted by Byrne and Van de Vijver (2010), “when comparisons comprise large-scale cross-cultural studies, the standard SEM strategy can be extremely problematic both statistically and substantively” (p. 107). The authors noted that problems may arise from conceptual misappropriation or from an accumulation of small and inconsequential differences in parameters. It was, therefore, advisable to use other strategies to evaluate the extent of the impact of lack of full scalar invariance. Our analysis indicates that the rank order of scores among countries and cultures does not change with the inclusion or exclusion of non-invariant items. Therefore, it can be concluded that while some items are problematic from an invariance perspective, they do not cause consequential or practical large effects on cross-cultural score comparisons. Future studies intending to use the BMSLSS for cross-cultural comparisons need to carefully evaluate invariance of the measure in their populations; if they face similar problems to ours in terms of scalar invariance, an evaluation of the extent to which these problems influence mean ranking would be advised. If the mean ranking does not differ substantially, the argument can be made that a comparison of observed means would be acceptable. However, if there are substantial differences in mean ranking, then alternative approaches to cross-cultural comparisons would be advisable.
We evaluated the extent to which the factor structure identified at the individual level can be replicated at country level and found that the structure is highly stable. The results indicate that aggregating individual-level data for country-level comparison is permissible, as the scale has the same structure and meaning both at individual and country level. These results provide important additional information on the potential utility of BMSLSS for cross-cultural comparisons.
Our results indicate that the BMSLSS can be used to study life satisfaction across cultural contexts. In the literature, there is a great need to understand the psychosocial adjustment of adolescents and emerging adults in a variety of contexts. The evaluation of the psychometric properties and cross-cultural utility of available scales contributes not only to understanding the theoretical underpinnings of these scales but also to providing researchers with useful information to guide their choice of indicators.
Limitations
Our evaluation of invariance issues is purely statistical. There may be explanations at semantic and functional equivalence level for our findings that we could not address. Future studies, where mixed-method approaches are used, may go a long way in elucidating the sources of errors that may have contributed to a lack of scalar invariance. In addition, though the study involves large samples from various countries, their national representative cannot be taken for granted.
Conclusion
In conclusion, the BMSLSS forms a brief measure of life satisfaction, which has accrued substantial evidence of construct validity and is suitable for use in cross-cultural surveys with adolescents and emerging adults.
Footnotes
Declaration of Conflicting Interests
The author(s) declared no potential conflicts of interest with respect to the research, authorship, and/or publication of this article.
Funding
The author(s) received no financial support for the research, authorship, and/or publication of this article.