
Abstract
The purpose of this study was to evaluate the construct validity of Ryff’s Scales of Psychological Well-Being (SPWB) using exploratory structural equation modeling (ESEM). The data were drawn from the national survey of Midlife in the United States conducted during 1994 and 1995. Measurement models assuming different number of factors (1-6 factors) and considering the effect of negatively wording items were specified and compared to determine optimal number of underlying factors. The discriminant validity was assessed following Farrell’s suggestions. The results showed the discriminant validity was questionable due to five indicators with considerable cross-loadings.
Ryff’s Scales of Psychological Well-Being (SPWB) embrace six dimensions of positive functioning (Ryff, 1989)—autonomy (AU), environmental mastery (EM), personal growth (PG), positive relations (PR), purpose in life (PL), and self-acceptance (SA). The stability of these dimensions was supported by substantive studies across the last two decades (Ryff, 2014). Previous researchers have relied on exploratory factor analysis (EFA; Kafka & Kozma, 2002) or confirmatory factor analysis (CFA; Lindfors, Berntsson, & Lundberg, 2006; Ryff & Keyes, 1995; Springer & Hauser, 2006) to investigate SPWB’s factorial structure. However, EFA and CFA are sometimes inappropriate to multidimensional scales; therefore, the findings of aforementioned studies can be misleading (Marsh, Liem, Martin, Morin, & Nagengast, 2011). More specifically, EFA assumes unique variances are independent, while unique variances of negatively wording items of SPWB are dependent (Springer & Hauser, 2006). CFA does not assume independent unique variances, but researchers often constrain cross-loadings to zero, resulting in poor goodness-of-fit to the data and inflated inter-factor correlations that can undermine discriminant validity (Asparouhov & Muthén, 2009; Hsu, Skidmore, Li, & Thompson, 2014; Marsh et al., 2011).
Exploratory structural equation modeling (ESEM) is a more appropriate method for evaluating the construct validity of SPWB. ESEM integrates positive features of EFA and CFA (Asparouhov & Muthén, 2009; Marsh, Morin, Parker, & Kaur, 2014). ESEM tends to show a better model–data fit and more accurate estimates of inter-factor correlations compared with CFA (Marsh et al., 2011; Marsh et al., 2014). ESEM has been recently applied to investigate the construct validity of multidimensional scales in psychological (e.g., Booth & Hughes, 2014; Vazsonyi, Ksinan, Mikuska, & Jiskrova, 2015) and educational (e.g., Caro, Sandoval-Hernández, & Lüdtke, 2014; Marsh et al., 2013) studies. The purpose of this study was to evaluate the construct validity of SPWB using ESEM. Specifically, models with different number of factors (1-6 factors) and a method factor associated with negatively wording items were specified and compared to determine an optimal number of factors. We then assessed the discriminant validity following Farrell’s (2010) suggestions.
Method
Data
The data were drawn from the national survey of Midlife in the United States (MIDUS) conducted during 1994 and 1995(N = 3,487). Participants who did not complete SPWB were excluded, resulting in 3,014 participants, of which 48.5% were males, 87.72% Caucasian, and the average age was 47.07 years (SD = 13.19 years).
Measures
In MIDUS, each dimension is measured by three 7-point Likert-type items (see the appendix), where at least one item is negatively worded. Following Springer and Hauser’s (2006) study, the category do not know was recoded as missing, and the remaining categories were recoded from 1 to 6, where a larger number represented a stronger agreement with the items’ description. Responses on the negatively wording items were reverse coded. Our preliminary analysis showed that those analytical items were mildly skewed (skewness ranged from −0.032 to −1.855), which can be appropriately handled by the robust weighted least squares estimator described as following (Lei, 2009).
Data Analysis
Seven models were specified—Model1 to Model6 assumed one to six factors, respectively, while Model7 added a method factor associated with negatively worded items to Model6. Data were analyzed in ordinal-scale using a robust weighted least squares estimator in Mplus, namely, a mean- and variance-adjusted weighted least squares (WLSMV) estimator. We adopted the pairwise deletion approach accommodated in WLSMV estimator to handle missing data (Asparouhov & Muthén, 2010). The rotation method of ESEM was Geomin (Asparouhov & Muthén, 2009). The model fit was evaluated by χ2 statistics and fit indices—comparative fit index (CFI), Tucker–Lewis index (TLI), and root mean square error of approximation (RMSEA) with cutoff values (e.g., CFI, TLI ≥ 0.95; RMSEA ≤ 0.06) recommended by Hu and Bentler (1999). χ2 difference (Δχ2) tests were conducted to compare relative fit of nested models that are differed in number of factors (e.g., five-factor model vs. six-factor model). The 90% confidence interval (CI) of RMSEA was also examined for model comparison (Preacher, Zhang, Kim, & Mels, 2013).
Discriminant validity
We compared the average variance extracted (AVE) of each factor with the shared variance between factors (Farrell, 2010). The factor’s AVE is the average amount of squared factor loadings of its indicators, while shared variance is the squared correlation between any two factors. Discriminant validity is supported when the AVE for any two factors is larger than the maximum shared variance.
Results and Discussion
Model1 had the worst goodness of fit, χ2(df) = 8,203.860 (135), p < .05; CFI = 0.718, TLI = 0.680, RMSEA = 0.141. Models with an increasing number of factors (Model2-Model6) showed better goodness of fit. Model6 performed statistically better than all other five models, χ2(df) = 680.824 (60), p < .05, CFI = 0.978, TLI = 0.945, RMSEA = 0.059. These results indicated that there were six substantive factors. Compared with Model6, Model7 added an additional method factor to account for negatively wording items. This model demonstrated an adequate fit, χ2(df) = 185.836 (52), p < .05, CFI = 0.994, TLI = 0.981, RMSEA = 0.034, and fit significantly better than Model6 with Δχ2(df) = 357.961 (8), p < .05 and non-overlapping 90% CI of RMSEA, Model6 = [0.055, 0.063]; Model7 = [0.030, 0.039]. Therefore, Model7 was chosen as the optimal model. Table 1 presents the correlations (lower diagonal) and shared variances (upper diagonal) between factors in Model7.
Correlations (SE) and Shared Variances Between Factors of Model7.

Note. Lower diagonal contains correlations (SE) between factors; upper diagonal contains shared variances.
p < .05.
Our results supported that there were six substantive factors, which is in line with previous studies using CFA (e.g., Lindfors et al., 2006; Ryff & Keyes, 1995; Springer & Hauser, 2006) but against one study using EFA (Kafka & Kozma, 2002). However, our study revealed smaller magnitudes of inter-factor correlation compared with previous CFA studies. For instance, in a comparable study analyzing the same data as the current study, Springer and Hauser (2006) found that all inter-factor correlations were above .763 (see Table 7 in their study) after controlling for method effects (e.g., negative wording items). Other studies using CFA also reported similar findings—high inter-factor correlations of SPWB (e.g., Lindfors et al., 2006). The above findings are echoed by prior studies indicating inappropriately forcing cross-loadings to zero led to inflated inter-factor correlations (Asparouhov & Muthén, 2009; Marsh et al., 2009). Note that the factor structure of SPWB derived from the ESEM in the current study cannot be overgeneralized to other populations, and future studies are needed to cross-validate our findings.
Discriminant Validity
The estimated inter-factor correlations from Model7 were all positive except for correlation between PR and PL (−.093, p > .05). The magnitudes of factor correlation ranged from −.093 to .606, resulting in shared variances ranging from .009 to .367. Table 2 presents pattern coefficients of each indicator and AVE (ranging from .184 [PR] to .536 [SA]) for each factor. Three factors (EM, PR, and PL) had AVE lower than the maximum shared variance, which can be an evidence of lack of discriminant validity of SPWB (Fornell & Larcker, 1981).
Factor Loadings (SE) of Model7.
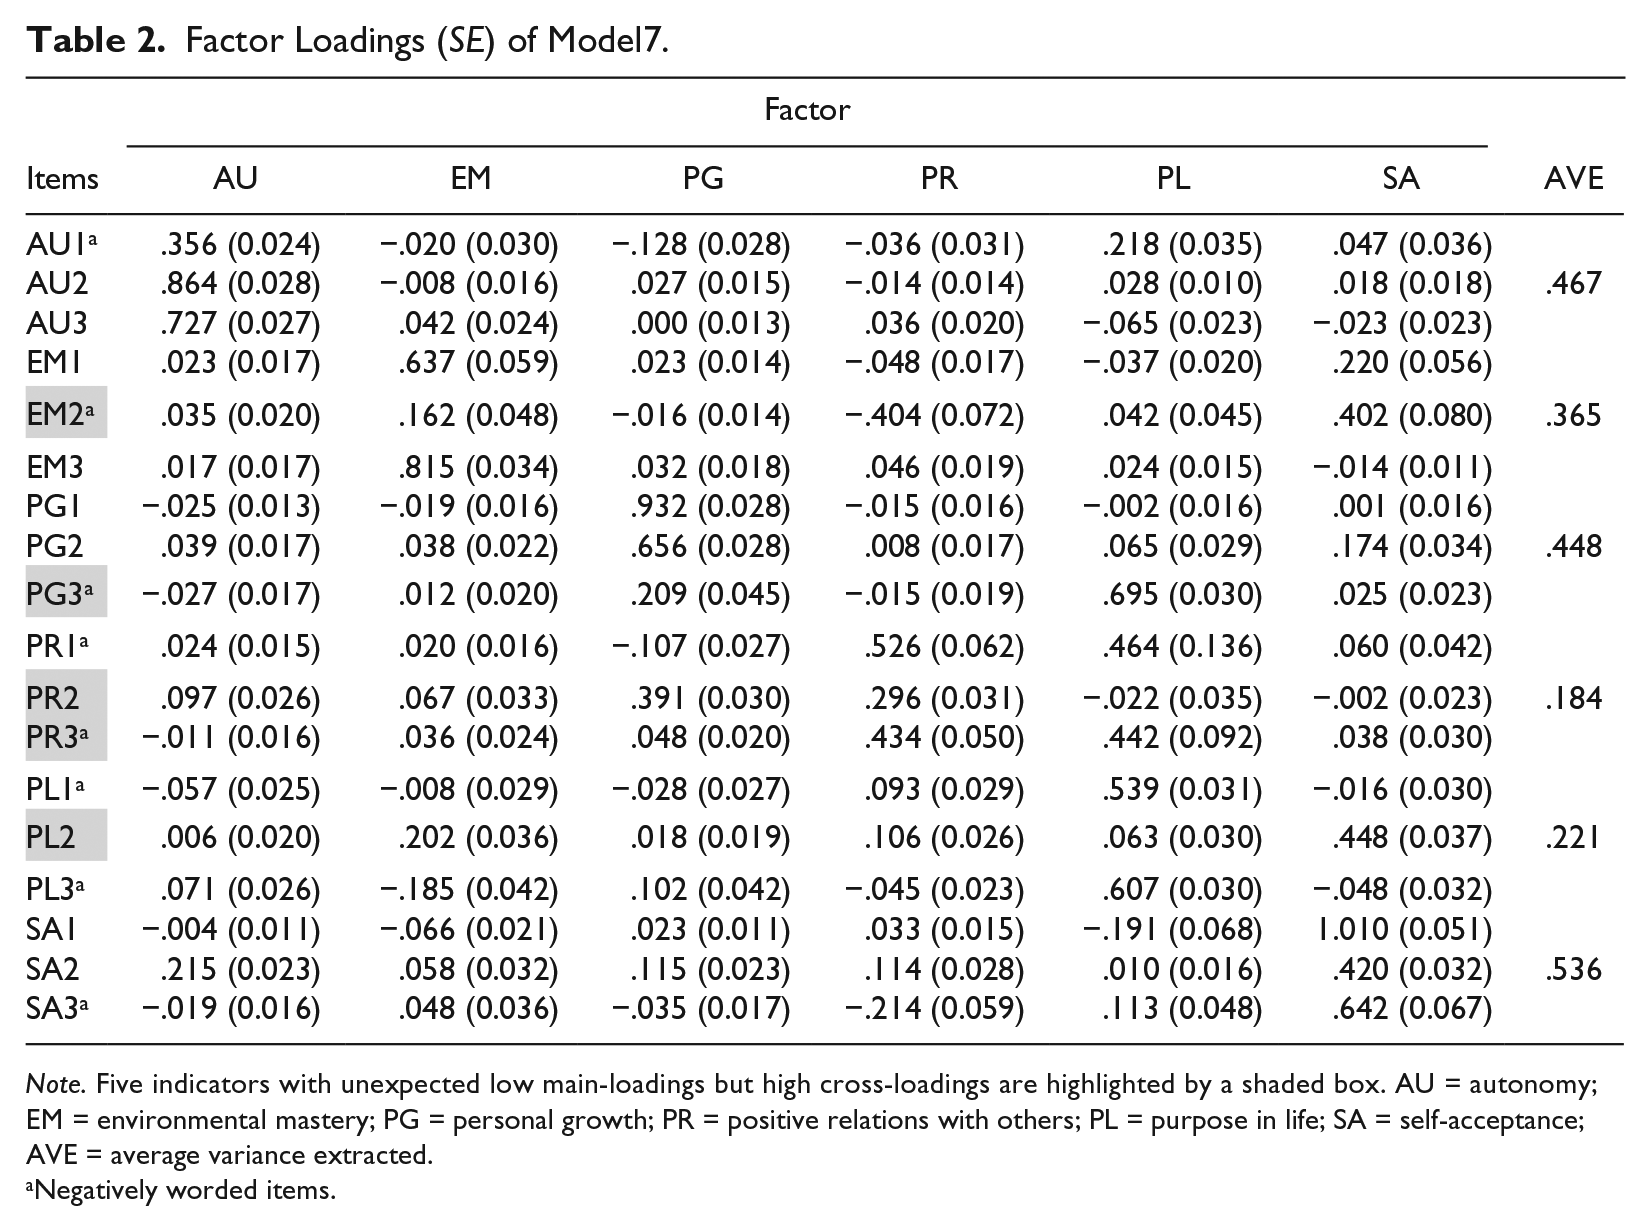
Note. Five indicators with unexpected low main-loadings but high cross-loadings are highlighted by a shaded box. AU = autonomy; EM = environmental mastery; PG = personal growth; PR = positive relations with others; PL = purpose in life; SA = self-acceptance; AVE = average variance extracted.
Negatively worded items.
Lack of discriminant validity may be attributable to five problematic indicators (EM2, PG3, PR2, PR3, and PL2, highlighted in Table 2). For example, PG3 had a small loading on the target factor PG (.209) but a large cross-loading on factor PL (.695). The variances of these problematic indictors were not mainly explained by the corresponding theory-driven factors. Similarly, Clarke, Marshall, Ryff, and Wheaton (2001) also identified four problematic SPWB indictors, and three of them (i.e., EM2, PR2, and PL2) were also found in the current study. As suggested by Clarke et al., all problematic indicators need to be modified or replaced.
Taken together, the factorial structure of SPWB determined by ESEM included six underlying factors with small to moderate inter-factor correlations, a method factor associated with negatively worded item, and five problematic indictors. Problematic indictors led to lower AVE of three factors (EM, PR, and PL) and contributed to the lack of discriminant validity of SPWB. Researchers should be cautious in interpreting the scores measured by these problematic indictors.
Footnotes
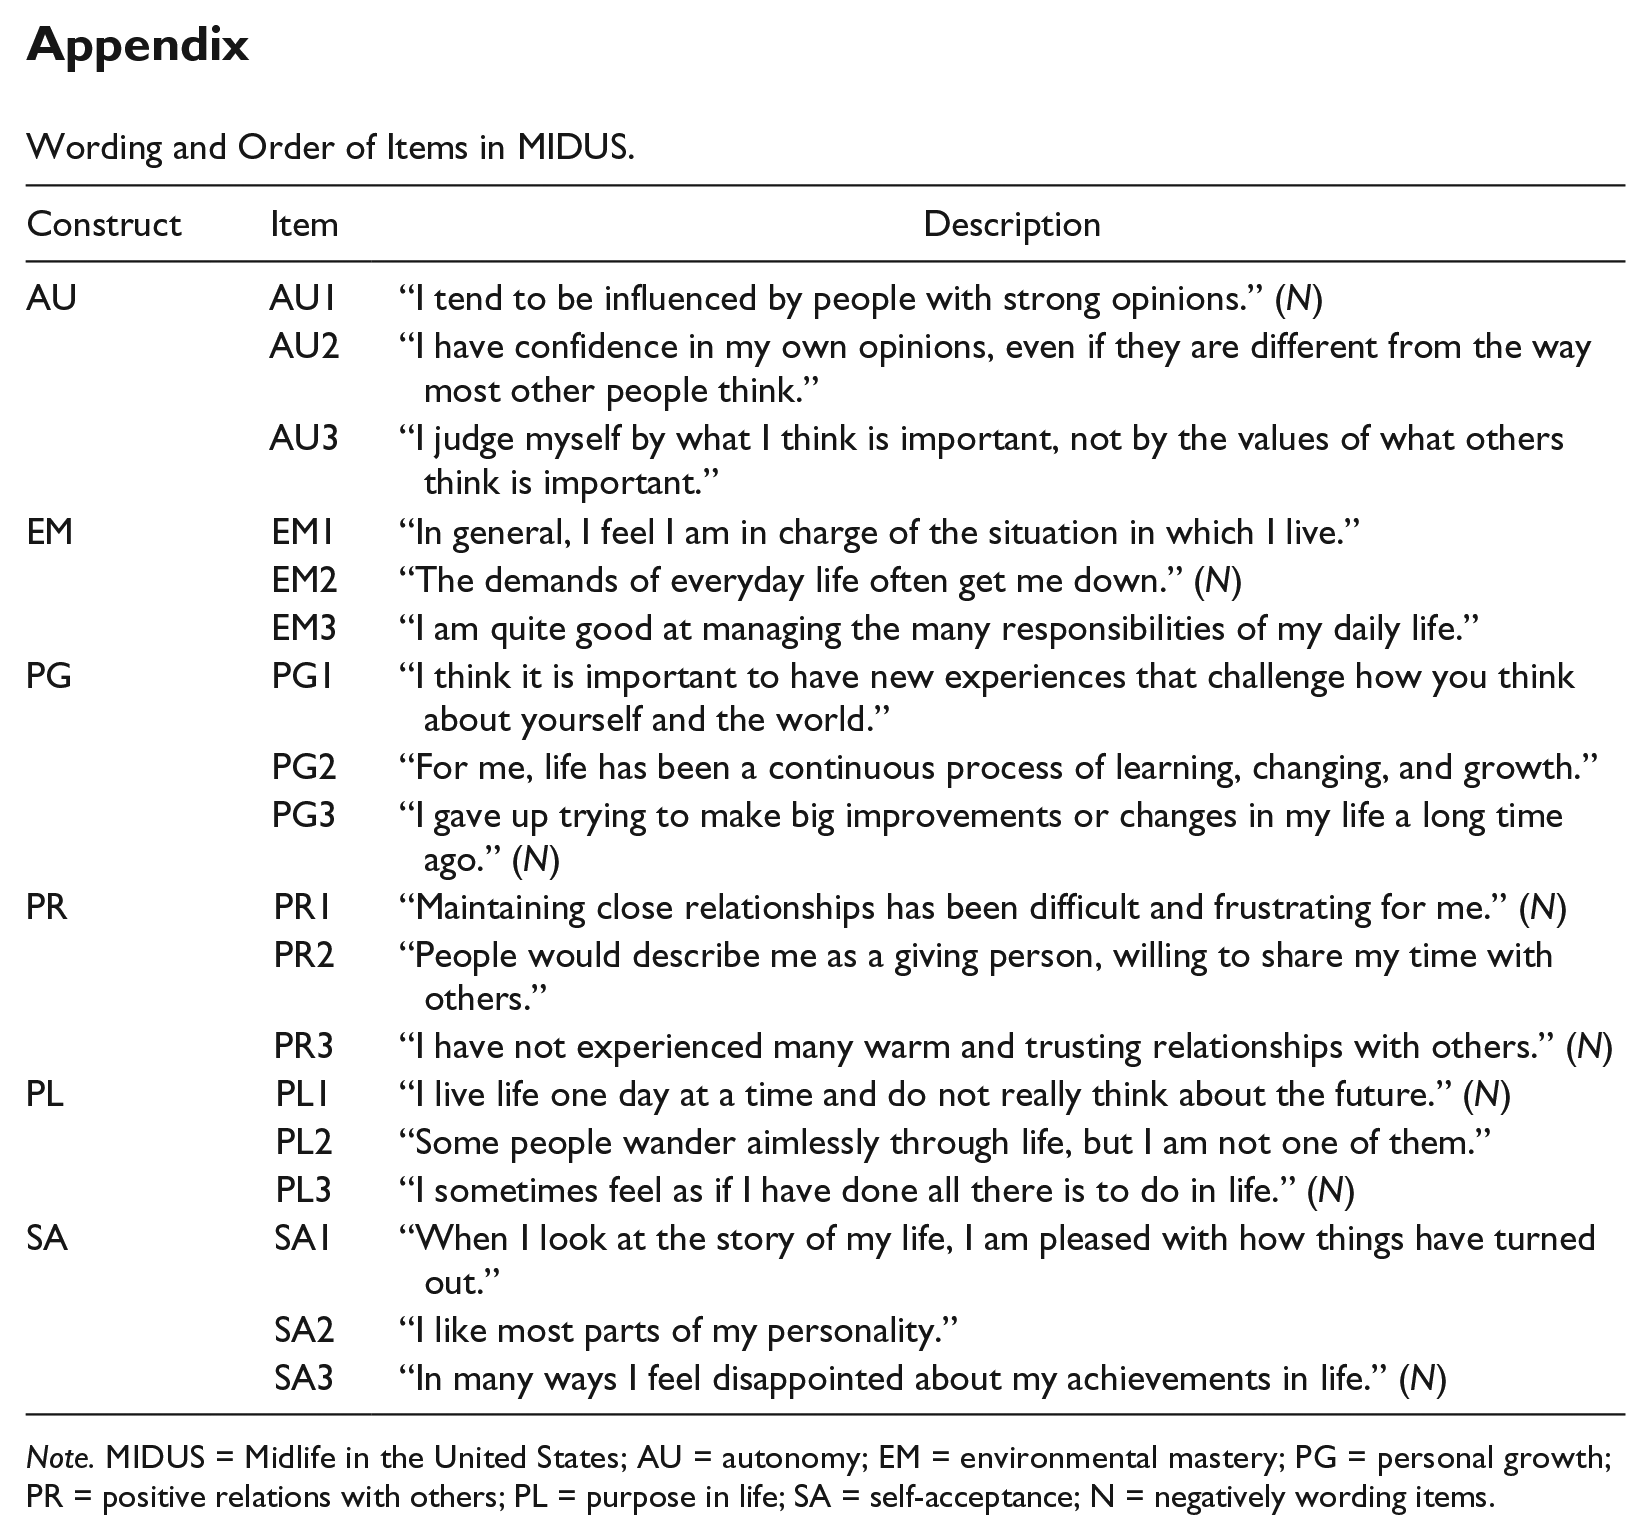
Appendix
Wording and Order of Items in MIDUS.
| Construct | Item | Description |
|---|---|---|
| AU | AU1 | “I tend to be influenced by people with strong opinions.” (N) |
| AU2 | “I have confidence in my own opinions, even if they are different from the way most other people think.” | |
| AU3 | “I judge myself by what I think is important, not by the values of what others think is important.” | |
| EM | EM1 | “In general, I feel I am in charge of the situation in which I live.” |
| EM2 | “The demands of everyday life often get me down.” (N) | |
| EM3 | “I am quite good at managing the many responsibilities of my daily life.” | |
| PG | PG1 | “I think it is important to have new experiences that challenge how you think about yourself and the world.” |
| PG2 | “For me, life has been a continuous process of learning, changing, and growth.” | |
| PG3 | “I gave up trying to make big improvements or changes in my life a long time ago.” (N) | |
| PR | PR1 | “Maintaining close relationships has been difficult and frustrating for me.” (N) |
| PR2 | “People would describe me as a giving person, willing to share my time with others.” | |
| PR3 | “I have not experienced many warm and trusting relationships with others.” (N) | |
| PL | PL1 | “I live life one day at a time and do not really think about the future.” (N) |
| PL2 | “Some people wander aimlessly through life, but I am not one of them.” | |
| PL3 | “I sometimes feel as if I have done all there is to do in life.” (N) | |
| SA | SA1 | “When I look at the story of my life, I am pleased with how things have turned out.” |
| SA2 | “I like most parts of my personality.” | |
| SA3 | “In many ways I feel disappointed about my achievements in life.” (N) |
Note. MIDUS = Midlife in the United States; AU = autonomy; EM = environmental mastery; PG = personal growth; PR = positive relations with others; PL = purpose in life; SA = self-acceptance; N = negatively wording items.
Declaration of Conflicting Interests
The author(s) declared no potential conflicts of interest with respect to the research, authorship, and/or publication of this article.
Funding
The author(s) received no financial support for the research, authorship, and/or publication of this article.