
Abstract
We used existing reading (n = 1,498) and math (n = 2,260) data to evaluate state test scores for screening middle school students. In Phase 1, state test data were used to create a research-derived cut score that was optimal for predicting state test performance the following year. In Phase 2, those cut scores were applied with future cohorts. Diagnostic accuracy of the research-derived cut scores was compared with the state’s proficiency benchmark from the previous year. Across grades and content areas, research-derived cut scores yielded higher sensitivity and lower specificity values relative to state-defined cut scores. Marked decreases in sensitivity and specificity were not observed in subsequent years. Results provide evidence for procedures in which previous state test data are repurposed for screening decisions.
Keywords
Universal screening is a formative assessment method. Schools use screening data to make decisions about students’ instructional needs and as a mechanism to evaluate the health of the school system (Kettler, Glover, Albers, & Feeney-Kettler, 2014). All tests that are designed for screening offer benchmarks—or cut scores—that are included in school-based reports or test manuals. Schools use those cut scores to predict which students are at risk for future problems in reading or math. There is general consensus that universal screening is a critical component of a tiered support model; however, the way that schools use and interpret screening tests differs widely. Despite some guidelines to evaluate the quality of cut scores and research exploring the merits of various screening procedures (e.g., Glover & Albers, 2007; VanDerHeyden, 2011), additional work is needed—particularly in secondary settings—to help schools select an approach to universal screening that is appropriate and feasible in practice. For example, although some middle schools may use state test data for screening purposes (Fuchs, Fuchs, & Compton, 2010; Mellard, McKnight, & Woods, 2009), the benchmarks for state tests are not typically designed to predict future performance. Thus, in those cases, schools may benefit from establishing research-based cut scores explicitly designed to better identify students who may need support in the approaching school year, not just those who fail to meet proficiency in the current school year.
Evaluating the Quality of Cut Scores
While a perfect criterion for reading or math proficiency may not exist, many schools are interested in identifying students who are at risk of failing the state test. In that case, there are four possible outcomes: (a) a student performs below the screening cut score and later fails to meet proficiency on the criterion test (True Positive), (b) a student performs above the screening cut score and passes the criterion test (True Negative), (c) a student performs below the screening cut score and passes the criterion test (False Positive), or (d) a student performs above the screening cut score and fails to meet proficiency on the criterion test (False Negative). As a cut score is made more stringent, the number of true positives will increase; however, the number of false positives will also increase. In an effort to select an optimal cut score, test developers and users work to optimize the rate of true positives while minimizing the frequency of false positives.
Sensitivity and specificity are among the most common metrics used to summarize the diagnostic accuracy of a given cut score (Glover & Albers, 2007). Sensitivity quantifies the proportion of students correctly identified as at risk relative to all students who are truly at risk, while specificity summarizes the proportion of students correctly identified as not at risk to all students who are truly not at risk. Although it is common to consider the cut score that produces the best balance between sensitivity and specificity, there are practical considerations that should inform the selection of cut scores. For example, sensitivity may be optimized at the expense of specificity if the risk of not-identifying students in need has a greater negative consequence than providing interventions to students who do not necessarily need supplemental support (Kilgus, Methe, Maggin, & Tomasula, 2014; VanDerHeyden, 2011).
It is also common to evaluate positive and negative predictive values. Positive predictive value (PPV) is the conditional probability unique to a specific sample that an individual with a failed screening result will actually fail the criterion. Negative predictive value (NPV) is the conditional probability unique to a specific sample that an individual who passes a screening test will actually pass the criterion. PPV and NPV are intuitively more appealing to practitioners; however, both are heavily influenced by base rates. Specifically, high PPV is difficult to obtain when the prevalence is low (e.g., very few students fail the state test), and high NPV is difficult to obtain when prevalence is high. The susceptibility of NPV and PPV to changes in prevalence makes them difficult to interpret in practice (Kettler et al., 2014).
Noting the potential limitations of relying solely on sensitivity, specificity, NPV, and PPV, others have argued for the use of positive and negative likelihood ratios as supplemental indices, which allow for the calculation of post-test probabilities (VanDerHeyden, 2011). For the purposes of universal screening, post-test probabilities can be used to quantify the likelihood that a student will go on to experience later difficulties. Positive post-test probability (PPP) is the probability that a student who failed the screener will go on to experience later difficulties. If a student passes the screener, the probability that he or she would still go on to experience later failure is estimated by negative post-test probability (NPP). Both PPP and NPP are compared with prevalence rates to evaluate the relative merit of a tool or a given cut score for making decisions with individual students (Akobeng, 2007; VanDerHeyden, 2011). A high PPP relative to the prevalence rate would suggest that failing the screener is genuinely predictive of later difficulties over and above what is already known, given an observed prevalence rate. Likewise, low NPP relative to a prevalence rate suggests that educators can be reasonably certain that students will not experience later difficulties if they pass the screener.
Screening Procedures With Secondary Students
Although many schools adopt a published assessment tool for screening decisions, some schools may use data obtained from state-mandated assessments. This is particularly true among middle and high school students as extant data are more readily available (Fuchs et al., 2010). Although state tests are not necessarily designed for screening purposes, schools may use the state’s criterion-based cut score for proficiency on the year-end test to guide instructional decisions for the subsequent school year. That is, students who failed to meet proficiency on the year-end state test might be identified for supplemental support the following year. There is some research to support the use of state tests for screening purposes among middle and high school students in reading and math. In that work, researchers have identified students as at risk for reading or math problems based on whether students passed or failed the previous year’s state test (Nelson, Van Norman, & Lackner, 2016; Pyle & Vaughn, 2012; Vaughn, Solís, Miciak, Taylor, & Fletcher, 2015). Nevertheless, state tests are not specifically designed for screening—benchmarks on state tests are intended to capture the degree to which students have mastered specific grade-level standards. Thus, proficiency scores in one year may not represent the optimal cut point for identifying students who are at risk in future years.
Purpose
Given the potential limitations of using the previous year’s proficiency benchmark as a cut score, it is worthwhile to consider the advantages of obtaining local cut scores using receiver operating characteristic (ROC) analysis or logistic regression. Those advantages include improvements to diagnostic accuracy and have been demonstrated in research with other screening measures such as curriculum-based measurement (CBM; for example, Keller-Margulis, Shapiro, & Hintze, 2008). Because state tests are not designed to be used for screening, but rather as a summative indication of year-end student mastery, diagnostic accuracy analyses have not been reported for these tools. This is an important omission because the proficiency benchmark that is recommended for the year-end test may differ from the optimal cut score for predicting future performance.
Furthermore, although the value of population-specific cut scores is assumed to be useful for future cohorts of students, research suggests that those cut scores may overestimate diagnostic accuracy (Jenkins, Hudson, & Johnson, 2007). Research is needed to evaluate the longitudinal value of population-specific cut scores and determine how often those cut scores need to be reexamined. Thus, the purpose of the present study was to evaluate the diagnostic accuracy of research-derived cut scores on the state test among middle school students across time. Two primary research questions guided the study:
Method
Participants
Existing reading (n = 1,610) and math (n = 2,468) data from 2012 to 2015 were obtained from three middle schools (Grades 6-8) in a suburban school district in the Midwest. Student data were omitted if observations were not available for all 3 years. Most students (n = 1,498; 93%) had data for all years for reading. Most students (n = 2,260; 92%) had complete data for math. Reading data were only available from 2013 to 2015. A series of chi-square analyses indicated that the analytic samples did not significantly differ from full samples by gender, ethnicity, free/reduced lunch status, or English learner status. Relative to the demographic distribution of students in the state, the percentage of Asian students included in the sample was larger (13.8% compared to 7.2%). Furthermore, the percentage of Black (7.8%) and Hispanic (2.6%) students in the analytic sample was slightly lower than that reported for the state (11.5% and 8.4%, respectively). Finally, the percentage of students who received free or reduced lunch (13.4%) or special education (7%) was lower relative to the distributions reported for the state (38.3% and 14.9%, respectively).
Materials
The Minnesota Comprehensive Assessments (MCA)
From third to eighth grade, students complete the MCA in math and reading each spring. The MCA is a standards-based assessment. The items on the test are constructed to align with the curricular standards for the state of Minnesota. Thus, students’ scores on the MCA are interpreted as the degree to which students have mastered grade-level content. MCA scores for math and reading range from 0 to 100, with scores of 50 and above considered proficient. Proficiency scores are based upon expert consensus through multiple rounds of discussion and moderation for individual items and overall test scores (Minnesota Department of Education, 2013).
Internal reliability estimates for math and reading scores exceed r = .90 for students in Grades 4 through 8 (Minnesota Department of Education, 2014). The MCA test blueprint was designed to align with state standards, and expert item writers were used to generate the test items during test development. Because the MCA is a standards-based assessment, validity evidence is primarily based on content validity (e.g., test blueprint aligned with standards, expert item writers) and construct validity (e.g., interscale correlations, high functioning items). Other widely accepted measures of achievement continue to demonstrate high correlations with MCA scores, which provides some criterion-related validity evidence for the test (Renaissance Learning, 2014).
Procedure
Procedures for the current study were divided into two phases (Table 1). Procedures in Year 1 established a research-derived cut score on the preceding year’s MCA across all grades for reading and math. In Phase 2, the cut scores obtained using the first year of data were evaluated for long-term utility. That is, the research-derived cut scores in Year 1 were applied to future years, and diagnostic accuracy estimates were examined. Across all years and grades, the diagnostic accuracy of the research-derived, or screening-specific, cut score was compared with that of the state-determined cut score for proficiency (50).
Procedure for Calculating and Applying Research-Derived Cut Scores.
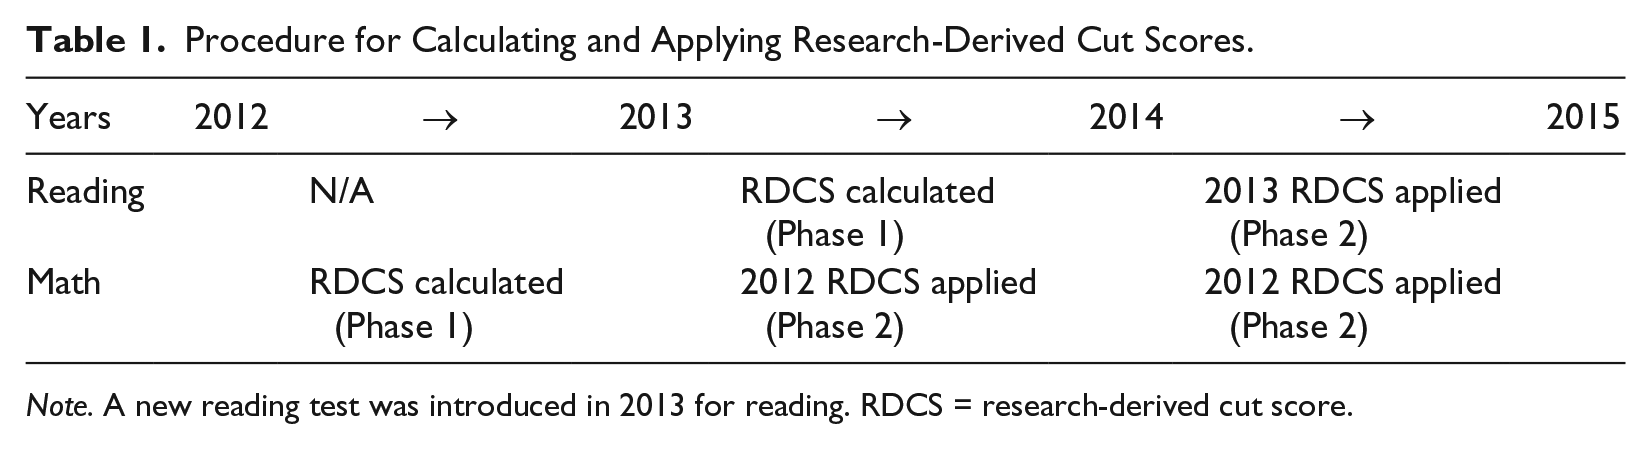
Note. A new reading test was introduced in 2013 for reading. RDCS = research-derived cut score.
Phase 1
Research-derived cut scores were obtained using the first available scores for MCA reading and math to predict the next available score. For math, this translated to using MCA scores from 2012 to predict performance on the 2013 MCA test (Table 1). For reading, MCA scores from 2013 were used to predict performance on the 2014 MCA test. ROC analysis was used to obtain research-derived cut scores. Cut scores were obtained using a criterion in which sensitivity and specificity were maximized, and the absolute difference between the two values was minimized (Hosmer, Lemeshow, & Sturdivant, 2013; Peng & So, 2002). Preference was not given to sensitivity or specificity to derive cut scores as there is a lack of consensus in school psychology and special education regarding what minimal values for either statistic should be.
Phase 2
To address our second research question, the utility of the research-derived cut scores was evaluated with a novel sample (Table 1). That is, the research-derived cut scores obtained in Year 1 were used to predict the proficiency of new cohorts of students. Two additional years of data were available for math, and one additional year of data was available for reading.
Data Analysis
Descriptive statistics for MCA scores across all grades and content areas were obtained in Phase 1. In addition, correlation coefficients were computed for scores on reading and math measures across grades. Sensitivity, specificity, PPP, and NPP were obtained for cut scores across both phases. All analyses were conducted in the statistical program R, and cut points were determined using the optimal cut points package (Lopez-Raton, Rodriguez-Alvarez, Cadarso-Suarez, & Gude-Sampedro, 2014).
Results
Descriptive Results
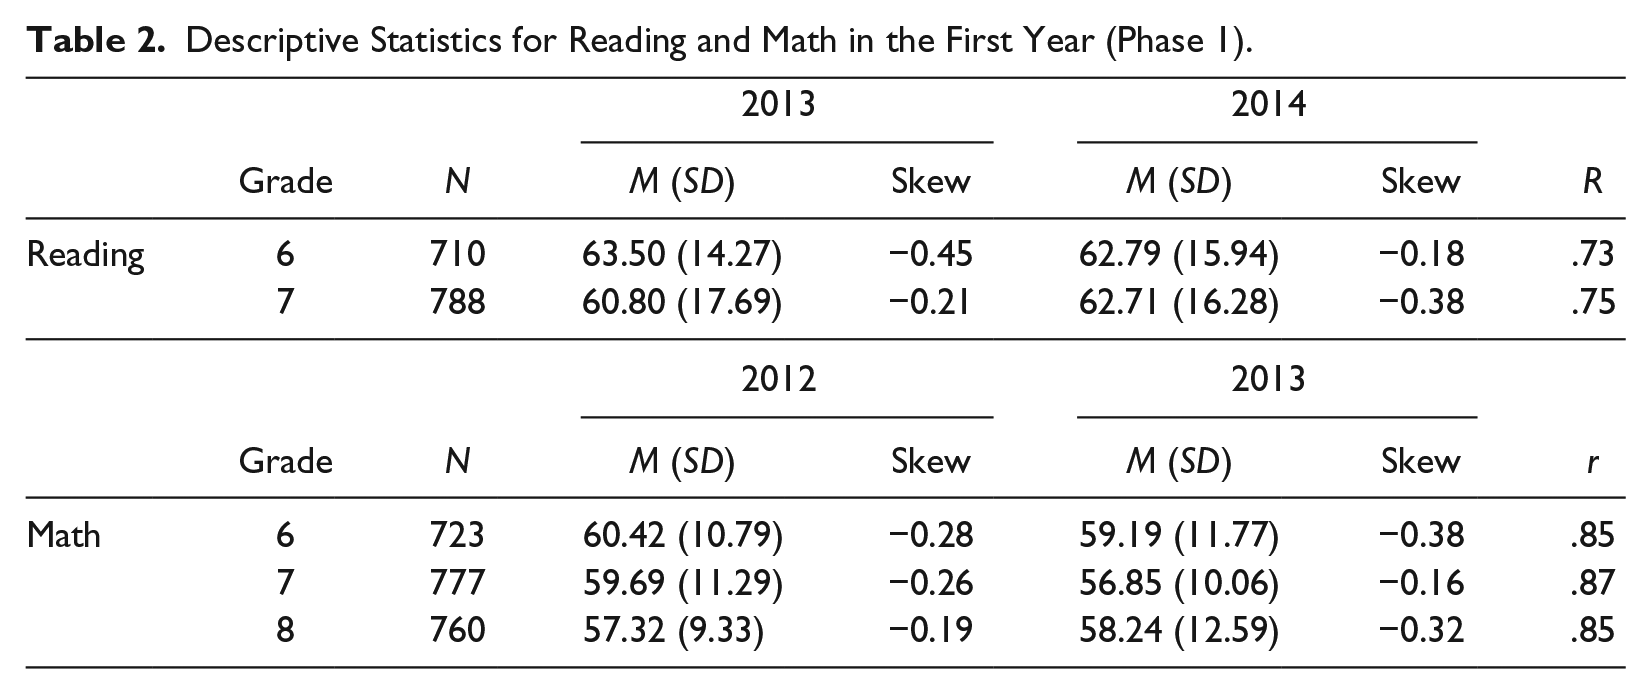
Descriptive statistics for 2013 and 2014 data are presented in Table 2. A series of chi-square analyses indicated that average scores between the analytic and full sample did not differ significantly. In both years, mean MCA scores across grades and content were above 50. That is, students tended to score above the state-defined proficiency score in reading and math in 2013 and 2014. Reading scores were approximately normally distributed (skew range = −0.50 to −0.18). Likewise, math scores were approximately normally distributed (skew range = −0.68 to −0.16). MCA scores in 2013 and 2014 were highly correlated, ranging from r = .69 to r = .87.
Descriptive Statistics for Reading and Math in the First Year (Phase 1).
Diagnostic Accuracy Results
Reading
Research-derived cut scores for each grade were higher than the state-defined cut score of 50 (Table 3). For example, the research-derived cut score for students in Grade 6 was 57, which was a 7-point increase from the default score of 50. That is, although the state-defined score of 50 may reflect proficiency at the time of testing, the optimal cut score tended to be higher, suggesting that higher scores were necessary to predict proficiency on future state tests. The overall increase in the cut score resulted in a dramatic increase in sensitivity when compared with those results associated with the state-defined cut scores. In Grade 6, sensitivity increased from .54 to .83 with the research-derived cut score. The research-derived cut score for Grade 7 (52) was more closely aligned with the state-defined benchmark for proficiency. Thus, research-derived cut scores for Grade 7 resulted in modest improvements to sensitivity (.82-.85 and .78-.83, respectively).
Diagnostic Accuracy of State-Defined and Research-Derived Reading Cut Scores Across All Years.
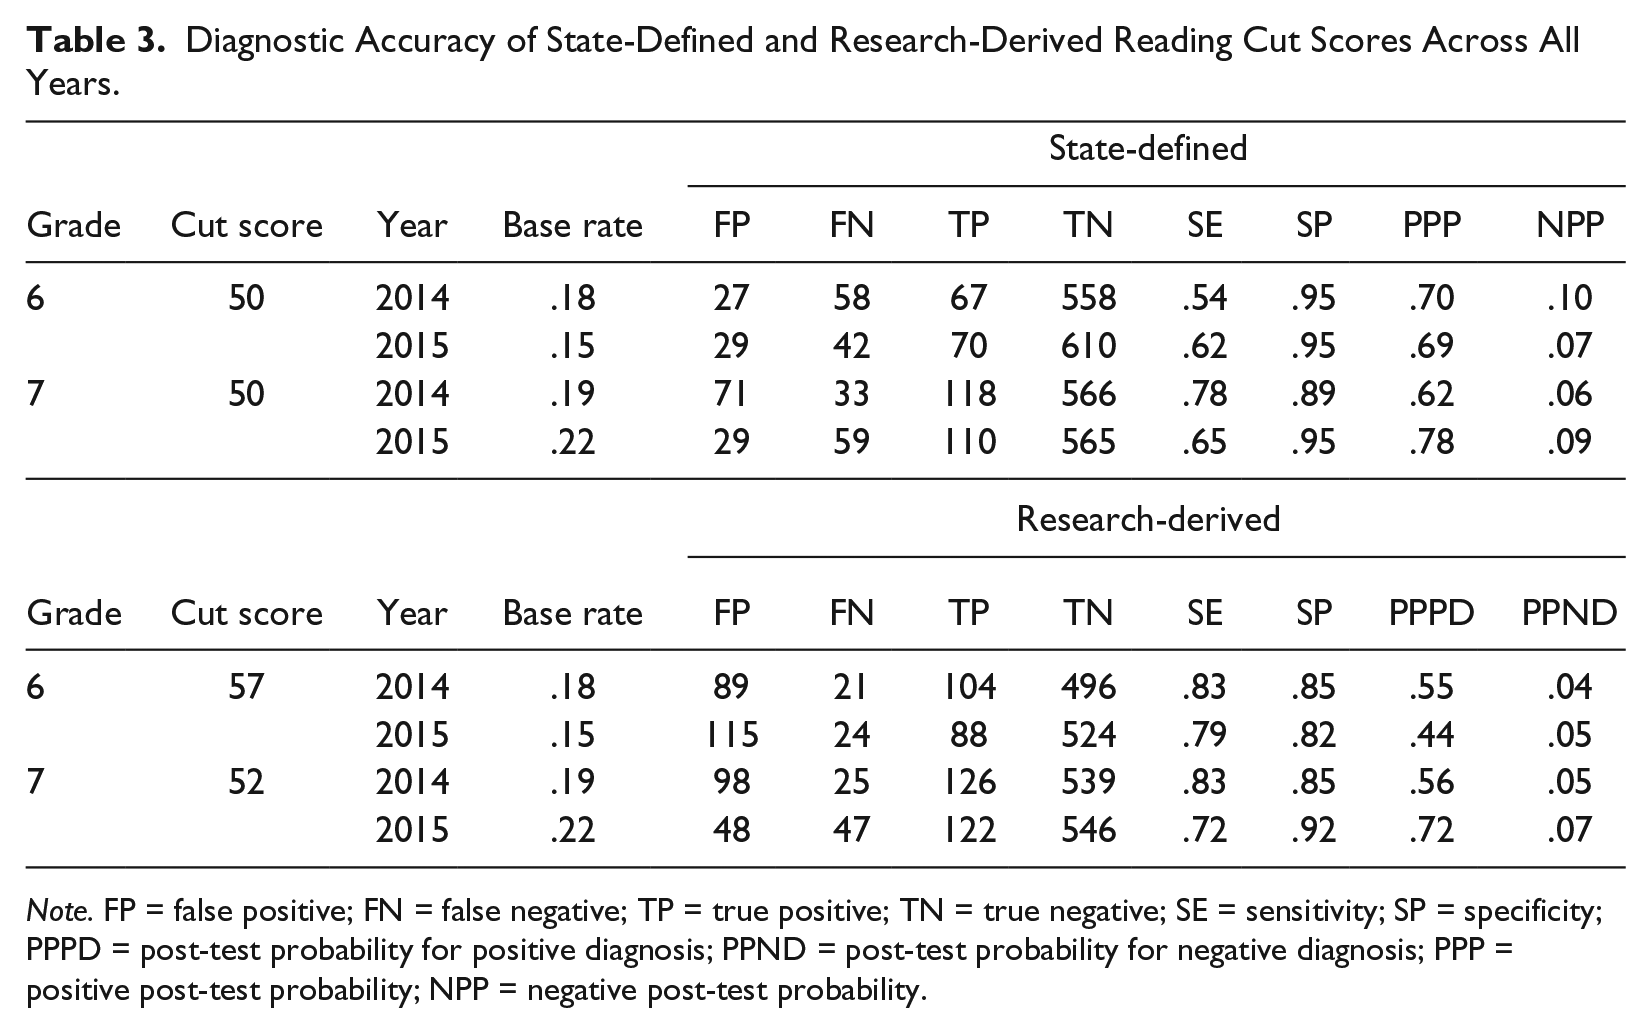
Note. FP = false positive; FN = false negative; TP = true positive; TN = true negative; SE = sensitivity; SP = specificity; PPPD = post-test probability for positive diagnosis; PPND = post-test probability for negative diagnosis; PPP = positive post-test probability; NPP = negative post-test probability.
As expected, increases in sensitivity came at a cost to specificity, with smaller specificity values obtained using the research-derived cut scores. Specificity values were generally very high for the state-defined cut scores (range = .89-.95). Research-derived cut scores, in general, yielded lower specificity values across grades (range = .82-.92). However, the absolute differences between sensitivity and specificity values for the research-derived cut scores were lower than those observed for the state-defined benchmark for proficiency (M = 0.00 vs. M = 0.20). Thus, there was typically a better balance between sensitivity and specificity for the research-derived cut scores.
Post-test probabilities were computed separately for each grade level and each screening measure. To calculate post-test probabilities, the procedure by VanDerHeyden (2011) was used,
where


PPPs were consistently higher across all grades for the state-defined cut scores compared with research-derived cut scores (range = .62-.78 vs. .44-.72). Thus, on average, there was a higher probability of a student going on to fail the next year’s state test if they were identified as not proficient according to the state-defined benchmark on the previous state test. NPPs were consistently lower, which is preferred, for the research-derived cut scores relative to the state-defined scores (range = .04-.07 vs. .06-.10). That is, there was a lower probability of a student going on to fail the state test if he or she scored above the locally derived screening cut score.
Diagnostic accuracy data in subsequent years generally replicated the observed statistics in Year 1. Across all grades and both years, sensitivity was generally low for the state-defined cut score and specificity remained high. Likewise, the research-derived cut scores, when applied to future years, always produced higher sensitivity values and lower specificity values relative to the state-defined cut score. However, the research-derived cut scores also continued to result in a better balance between sensitivity and specificity. Similar to the results observed in Year 1, PPPs (which are not affected by false-negative errors) were generally higher in 2015 for the state-defined cut score (M = 0.65, SD = 0.10) relative to local cut scores (M = 0.54, SD = 0.13). Research-derived cut scores continued to yield lower NPPs (M = 0.05, SD = 0.02) than the state-defined cut scores (M = 0.07, SD = 0.03). NPPs benefit from fewer false-negative errors, which is the priority in many schools.
Math
Results for math were highly similar to those for reading (Table 4). Research-derived cut scores in Year 1 for math were higher than the state-defined cut score of 50 for proficiency. PPPs were consistently higher across grades for the state-defined cut score compared with research-derived cut scores. NPPs were consistently lower for the research-derived cut scores relative to state-defined cut scores. Sensitivity values for the state-defined cut score in subsequent years remained stable or improved across all grades. Across two subsequent years, sensitivity values for the research-derived cut scores were generally high relative to those observed for the state-defined cut score. Specificity values for the research-derived cut scores across those same 2 years tended to be lower but still generally acceptable in an absolute sense (i.e., only one specificity value fell below .80). Across grades, PPPs in 2014 and 2015 were higher for the state-defined cut score relative to research-derived cut scores. However, NPPs for the research-derived cut scores tended to be lower in 2014 and 2015 relative to those observed for the state-defined cut score.
Diagnostic Accuracy of State-Defined and Research-Derived Math Cut Scores Across All Years.
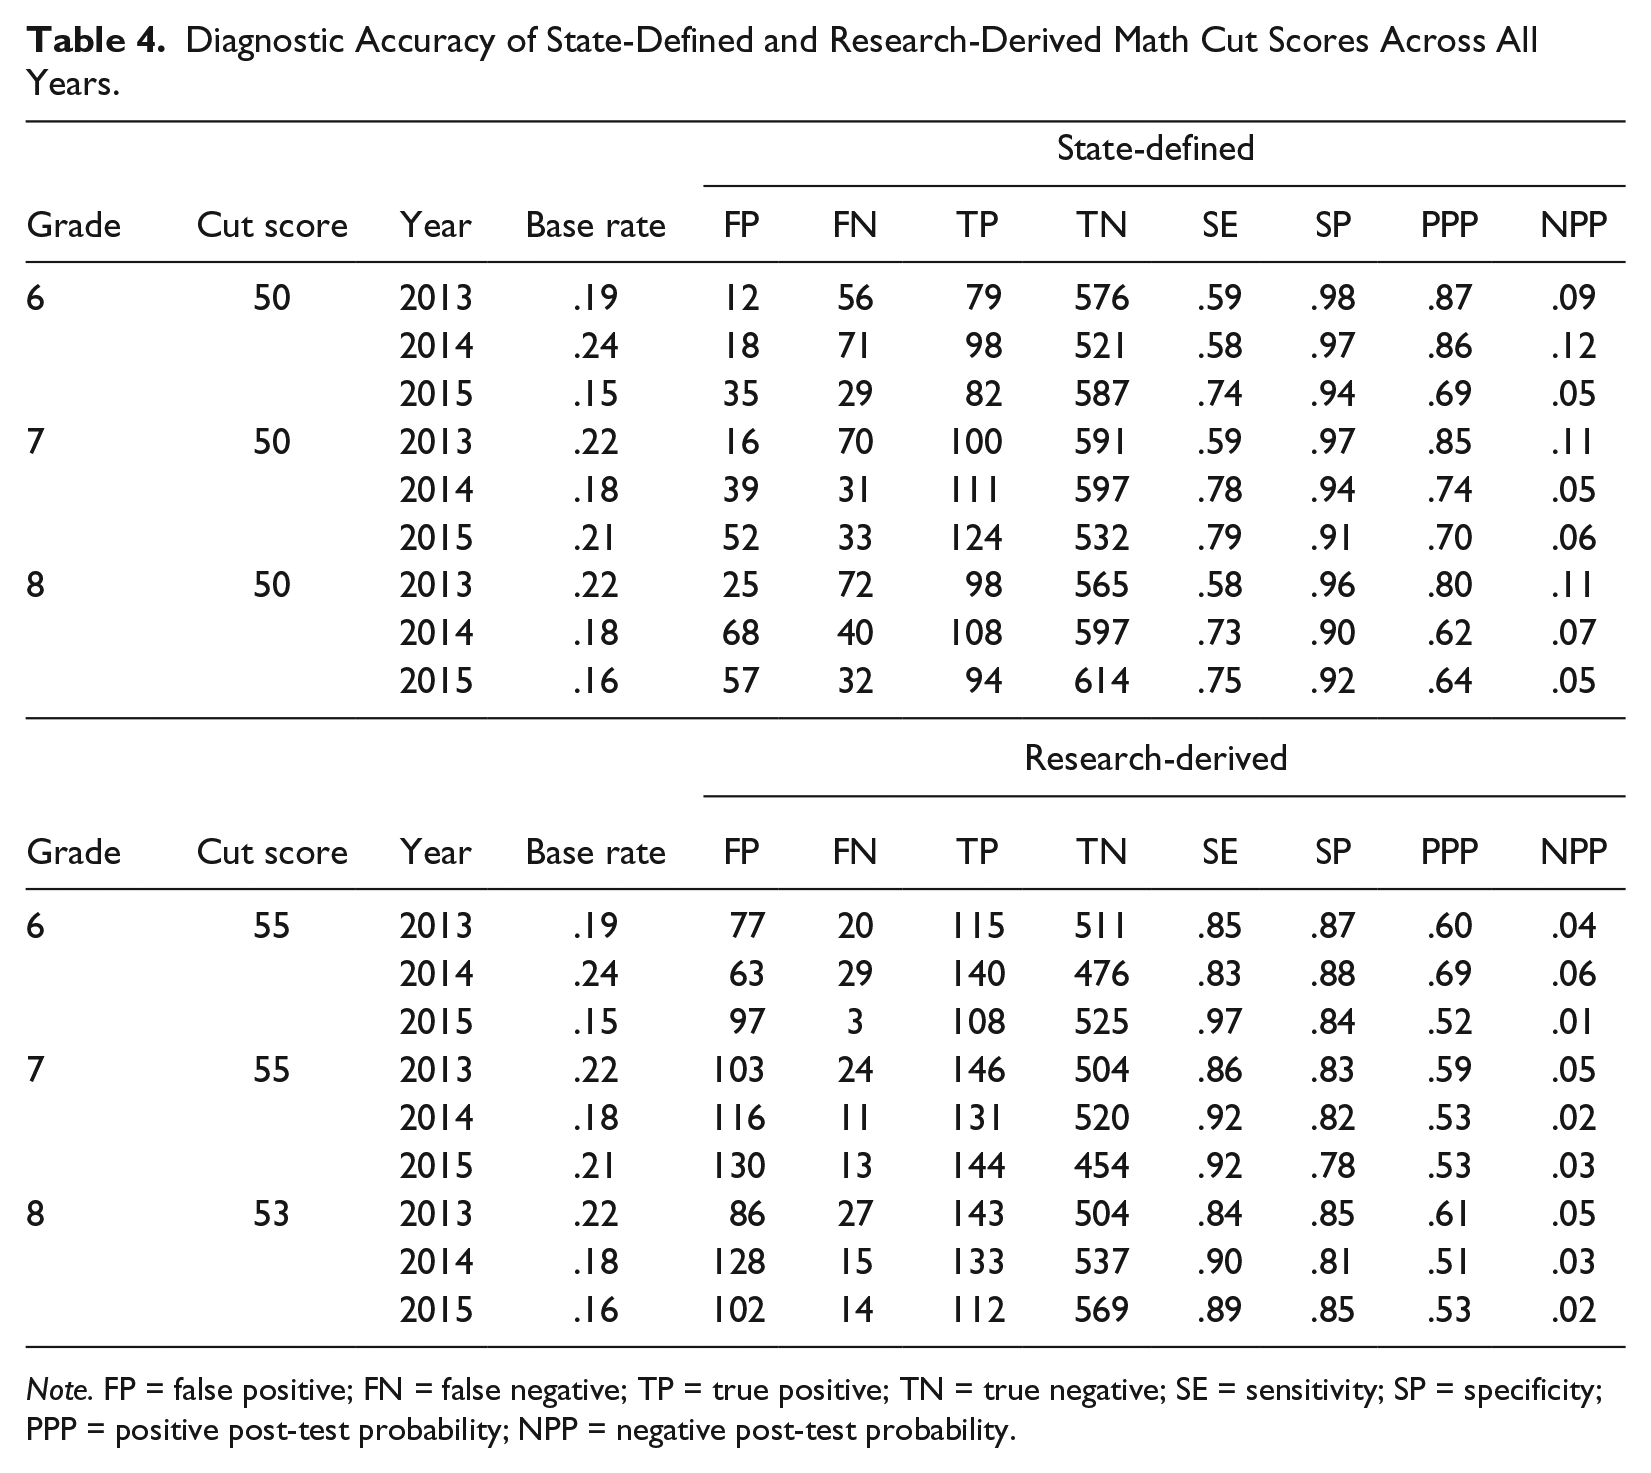
Note. FP = false positive; FN = false negative; TP = true positive; TN = true negative; SE = sensitivity; SP = specificity; PPP = positive post-test probability; NPP = negative post-test probability.
Discussion
This study examined two strategies for universal screening in middle school. The first strategy was the use of the state-defined benchmark for proficiency on the preceding accountability assessment to predict student proficiency the following year. This approach is most consistent with screening practices among secondary students documented in the literature thus far (Pyle & Vaughn, 2012; Vaughn et al., 2015). Second, this study examined the change in predictive value that could be obtained by adjusting the state-defined cut score—which is not designed to predict future performance—to maximize its use for screening decisions. In addition, we evaluated whether the diagnostic accuracy of those cut scores would replicate with future cohorts.
The observed results support the argument that state test scores can be used for purposes beyond summative assessment if benchmarks are created for predicting future performance. That is, results from the current study provide evidence that research-derived cut scores on the state test may produce acceptable diagnostic accuracy results for screening when compared with using the state-defined proficiency benchmark. Furthermore, results indicate that those research-derived cut scores retain value for future cohorts of students. The relative advantages and disadvantages of using existing state test data for screening purposes are described in more detail below.
Diagnostic Accuracy of State Test Scores for Screening Decisions
Research-derived cut scores in Year 1
In the year in which they were originally obtained (2013 for reading and 2012 for math), the research-derived cut scores resulted in satisfactory results for sensitivity and specificity (Kilgus et al., 2014). Likewise, post-test probabilities for positive and negative outcomes indicated that the research-derived cut scores performed well in the year in which they were derived. Nevertheless, by nature, the predictive value of research-derived cut scores is inflated in the first year—the scores are optimized based on one particular group of students (Jenkins et al., 2007). To date, little work has examined the predictive value of research-derived cut scores when those scores are applied to future cohorts of students. Thus, the results of cut score replication across subsequent cohorts provide a more accurate and meaningful picture of the quality of research-derived cut scores for screening decisions in schools.
The longitudinal value of research-derived cut scores
When cut scores obtained in Year 1 were applied and tested in future cohorts, diagnostic accuracy estimates were adequate and stable. The diagnostic accuracy evidence for the research-derived cut scores in subsequent years provides some support for the application of this methodology in practice. For example, schools might repurpose extant state test data from the district to derive research-derived cut scores and then apply those cut scores for screening purposes with future cohorts of students.
Sensitivity values associated with the research-derived cut scores for 2013, 2014, and 2015 math performance among Grade 6 students were .85, .83, and .97, respectively. For the same groups of students, the state-defined cut score produced sensitivity values of .59, .58, and .74 from 2013 to 2015. Furthermore, across all grades and content areas, the research-derived cut scores tended to produce the best balance between sensitivity and specificity. Thus, when considering only sensitivity and specificity values, research-derived cut scores were associated with results more consistent with general guidelines for universal screening in schools (Kilgus et al., 2014).
As discussed, post-test probabilities offer a complementary perspective on the value of research-derived cut scores and the state-defined cut scores. In 2014, the post-test probability for a positive diagnosis in math among sixth-grade students was equal to .53 when using the research-derived cut score and .75 when using the state-defined cut score. Thus, if a student were flagged by the state-defined cut score for math performance in 2013 (MCA = 50), the probability of that student going on to fail the state test in 2014 was much higher than if the research-derived cut score (MCA = 55) was applied. However, if a student scored above the research-derived 2013 cut score, the probability of that student going on to fail the state test in 2014 was equal to .04 compared with .08 if a sixth-grade student scored above the state-defined cut score in 2013. To evaluate the impact of using the research-derived cut score, it is also helpful to consider the base rate, which was .24 among sixth-grade students in 2014. An NPP value of .04 indicates that only 4% of students would not receive the support they need. If the added support were effective, that may translate into a substantial reduction in the number of students who fail the state test the following year (e.g., from 24% to 4% of students).
Practical Implications
Schools that wish to use existing state test data for screening must decide whether to simply use prior proficiency status to identify students in need of support—which is most common—or to obtain research-derived cut scores that are designed to predict future performance. To illustrate the actual trade-off between the two cut scores, as shown in Figure 1, the actual prevalence values in math for sixth-grade students in 2014 are halved to make interpretation easier. Prevalence data (divided by 2) are displayed in Panel A. Dark circles represent test scores below proficiency on the 2014 state test in math, and light circles represent test scores at or above proficiency. Overall, 22% of students failed to meet proficiency criteria on the 2014 state test in math (Panel A).
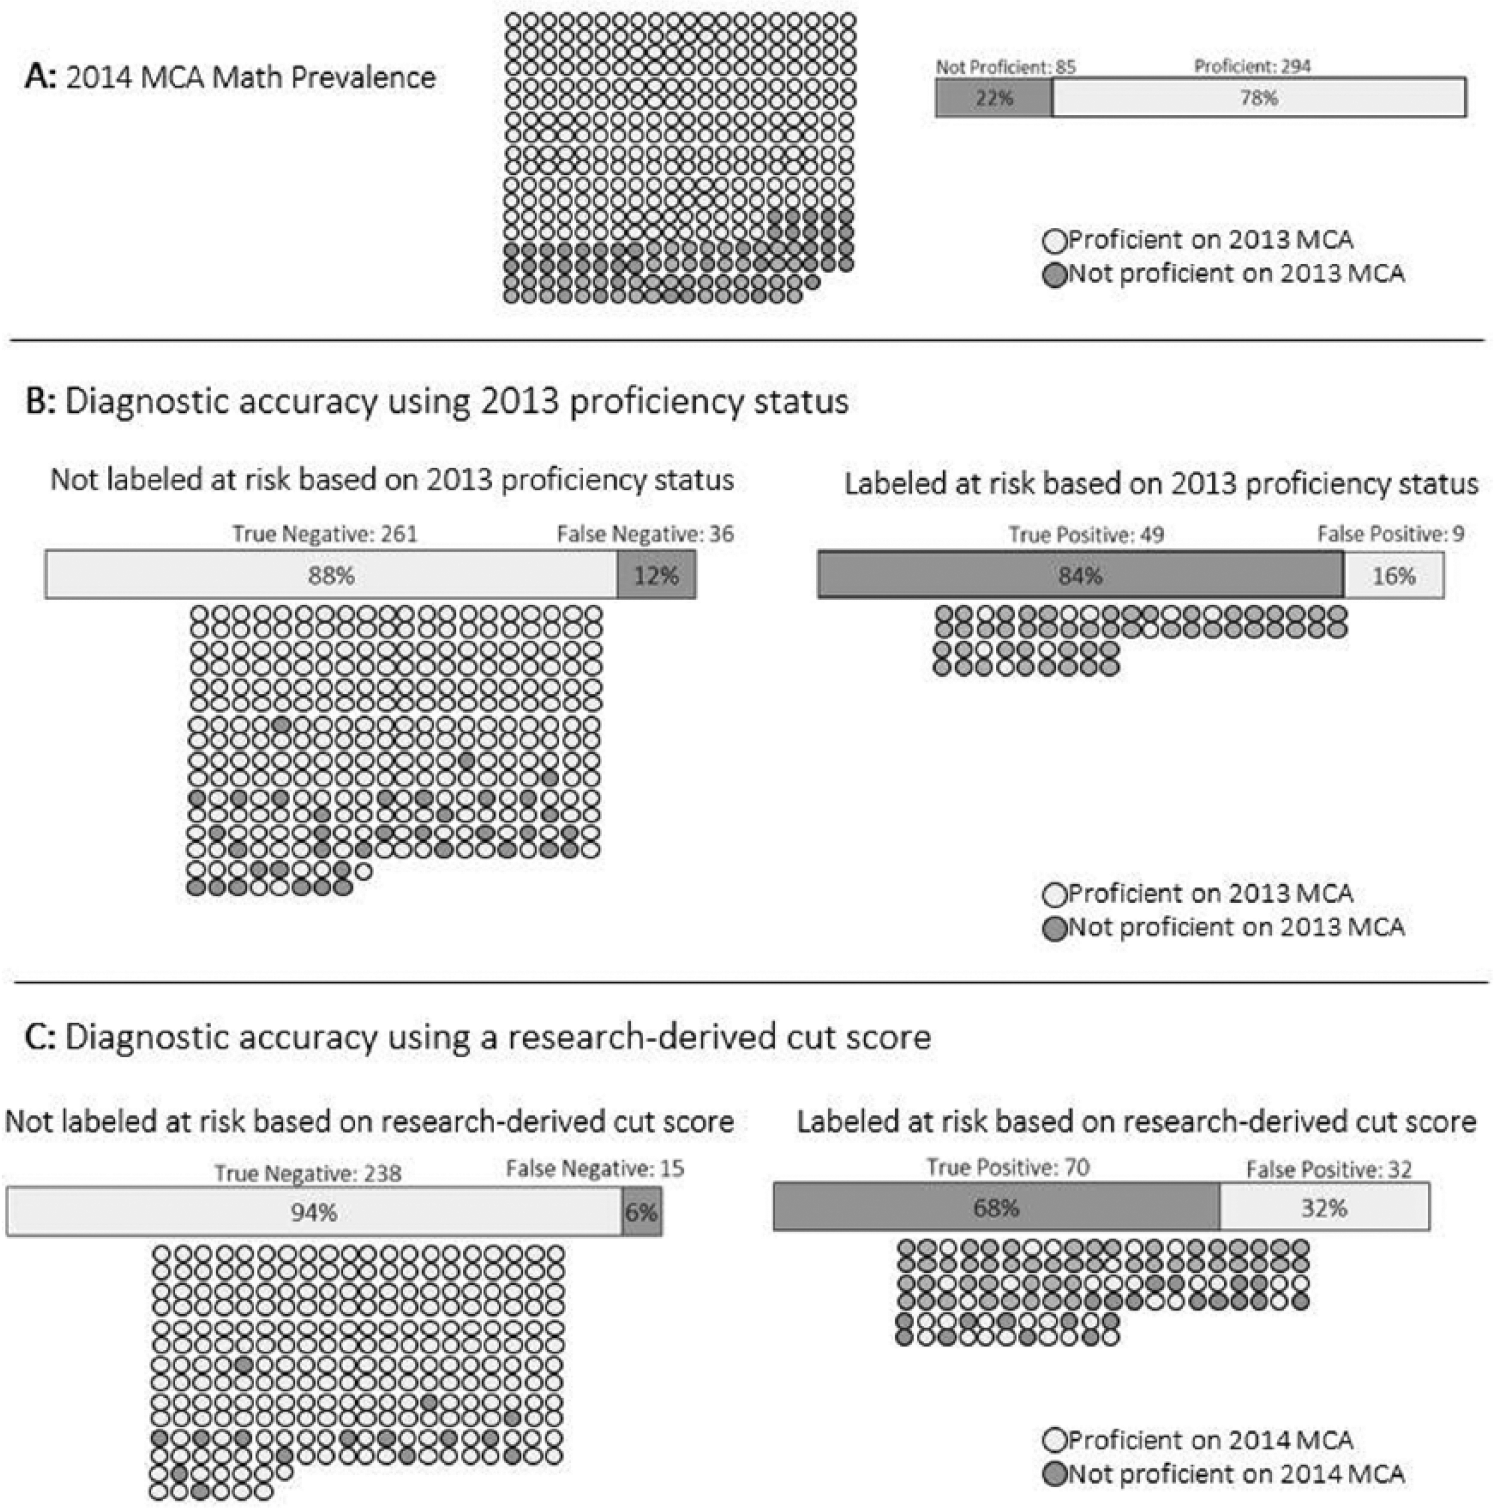
Illustration of the trade-off between research-derived and state-defined cut scores.
Panel B includes the distribution of students resulting from the state-defined cut score for sixth-grade math in 2013. It is clear in Panel B that a majority (84%) of students were accurately identified as at risk of failing to meet proficiency criteria. Nevertheless, almost half of the students were missed by the state-defined cut score (36 of 85)—those students scored above proficiency on the 2013 state test but below proficiency in 2014. The research-derived cut score does a better job of catching more students, but the increase in sensitivity comes at a cost. In Panel C, it is clear that the potential return on investment is lower. Although more students are correctly flagged as at risk for math problems (n = 70), about a third of the students identified by the research-derived cut score did not need support (n = 32).
The trade-off depicted in Figure 1 gets to the heart of the issue of screening in secondary schools. In this case, if there were sufficient resources available, the research-derived cut score is the better fit. If resources were low, simply keeping the state-defined cut score would help schools be more confident that students who receive additional support truly need that support. Although it is difficult to make a general recommendation regarding the two cut scores examined in this study, it is useful to note that the diagnostic accuracy of research-derived cut scores tended to align more closely with the purpose of universal screening in schools (VanDerHeyden, 2013). Thus, it seems that schools might consider the potential benefits of creating research-derived cut scores with state test data.
Limitations
It is important to note that the results observed in the present study were restricted to a relatively high-performing suburban school district. Nevertheless, the methods by which research-derived cut scores were obtained and evaluated in the current study are generalizable across most contexts, and researchers and practitioners are encouraged to replicate those methods with other student samples. It is also important to note the potential disadvantages associated with screening only once each year. Although the screening procedures outlined in the present study are likely to be accurate and efficient, students who regress during the year may go unnoticed in the absence of winter screening data. Likewise, triannual screening with the same measure allows schools to evaluate risk reduction program wide across time. Nevertheless, many middle schools adopt a screening model in which state test data are used to identify students for supplemental support. Results from the present study provide additional guidance for that process. It is also important to note that current study did not consider the instructional utility of the state test. Although the purpose of screening is not necessarily to identify a specific skill deficit, it is fortunate when screening data can be somewhat informative for intervention. The research-based cut scores on the MCAs, although possessing some diagnostic utility, are unlikely to result in specific instructional recommendations. Additional formative assessment data may help improve the accuracy of screening decisions and/or the specificity of instructional decisions. Finally, although state tests are commonly used as the criterion of interest in the context of universal screening models, it is useful to consider the limitations associated with treating state tests as the “gold standard” for prediction. In particular, it is likely that state tests provide just one view of achievement and may not perfectly align with other important metrics such as students’ readiness and success in a college setting.
Future Research
Harvesting existing data is an efficient first step in the screening process, as it costs no additional assessment effort and instructional time. This is particularly true among secondary students as academic deficits are typically well established by middle and high school. Nevertheless, additional data might be necessary to make a “rule in” decision for students who fail to meet the research-derived cut score. Those data might include traditional screening tools such as CBM or computer adaptive tests, but more likely would necessitate response to academic intervention data (Kovaleski, VanDerHeyden, & Shapiro, 2013). Future research is needed to evaluate the incremental benefit of additional data on screening decisions. For example, additional testing in the fall might not improve diagnostic accuracy beyond that observed with prior state test performance alone. In that case, schools with access to state test performance from the previous spring may choose to conserve resources in the fall and increase instructional time. Finally, future research might evaluate the degree to which research-based screening benchmarks vary across districts within the same state. If scores were observed to be stable across districts, it may be feasible for states to offer two benchmarks for schools: one representing grade-level proficiency and another representing a more stringent benchmark that might be used to predict future performance.
Footnotes
Declaration of Conflicting Interests
The author(s) declared no potential conflicts of interest with respect to the research, authorship, and/or publication of this article.
Funding
The author(s) received no financial support for the research, authorship, and/or publication of this article.