
Abstract
This study explored motivation and engagement among 585 Jamaican middle and high school students. Motivation and engagement were assessed via students’ responses to the Motivation and Engagement Scale. Confirmatory factor analysis (CFA) found satisfactory fit, and by most measures, multigroup CFA demonstrated comparable factor structure for males and females, younger and older students, lower and higher socio-economic groups, and Jamaican students compared with a randomly selected sample of 585 Australian students from a normative archive data set. Correlations with a set of validational factors (e.g., engagement, achievement) were also in line with previous research. Taken together, findings suggest that motivation and engagement instrumentation that has received psychometric support in other national and regional contexts also generalizes to students in an emerging regional context (Jamaica).
Keywords
Academic outcomes in Jamaica (and other nations in the Caribbean) reflect a mixed profile when compared with nations in “developed” regional contexts (e.g., United States, United Kingdom, Australia, Canada). Although elementary school outcomes seem generally positive, outcomes for middle and high school students demonstrate declines across attendance, achievement, and school completion (Brown, 2002; Jamaica Ministry of Education, 2013; United Nations Children’s Emergency Fund [UNICEF], 2013; United Nations Educational, Scientific and Cultural Organization [UNESCO], 2014). Although the region demonstrates steady progress in improving access to education, this improvement has not necessarily translated to better student outcomes (Miller, 2000). There is a need for research to identify factors and processes that may better support Jamaican school students’ academic development. The present study focuses on motivation and engagement as one approach. It seeks to explore the extent to which a motivation and engagement framework and instrumentation (the Motivation and Engagement Scale [MES]; Martin, 2007, 2009, 2014) that has received psychometric support in other national contexts generalizes to students in the Jamaican context.
Given the social and demographic comparability between Jamaica and the wider Caribbean region (Brown, 2002), a study of Jamaican students has potential to inform education in the region more broadly. In addition, with the rise of international educational assessment exercises (e.g., Programme for International Student Assessment [PISA]; Trends in International Mathematics and Science Study [TIMSS]; Progress in International Reading Literacy Study [PIRLS]) and the growing emphasis on international comparisons, it is important to develop and test instrumentation that has multination validity and applicability. Motivation and engagement instrumentation is no exception (e.g., Elliott & Bempechat, 2002; Hau & Ho, 2008; Martin & Hau, 2010; Martin, Yu, & Hau, 2013). Determination of the motivation and engagement profile of Jamaican students thus poses an opportunity to extend cross-cultural validation to a region currently limited in international comparative educational assessment. In addition, we suggest findings hold broader implications for future research efforts into motivation and engagement in diverse national and regional contexts.
The present study extends on three previous psychometric studies into motivation and engagement (using the MES) in diverse national contexts. Two studies investigated Australian and Chinese (Hong Kong and Beijing) students, finding no difference in measurement properties for the MES (Martin & Hau, 2010; Martin, Yu, et al., 2013). A third study drew on a new sample of Chinese students (beyond Beijing schools to schools in other mainland China provinces) and two large samples from North America (United States and Canada), the United Kingdom, and Australia (Martin, Yu, Papworth, Ginns, & Collie, 2015). For each of the four contexts, the MES scores reflected sound factor structure and showed these factors were significantly associated with a set of validational correlates. The present study extends this research by investigating the psychometric properties of the MES among students in a new regional context—the Caribbean—through an analysis of Jamaican students. It does so through tests of distributional properties, reliability, factor structure, external validity, as well as invariance against a normative archive sample of Australian students.
Motivation and Engagement
The conceptual foundation for the present study is the Motivation and Engagement Wheel (Figure 1; Martin, 2007, 2009). The Wheel was developed in response to calls for integrative approaches to research and theorizing in motivation and engagement (e.g., Murphy & Alexander, 2000; Pintrich, 2003). The Wheel comprises 11 factors selected to integrate seminal theorizing in motivation and engagement (see Liem & Martin, 2012 for a summary of this theorizing and its role in the Wheel’s development). The 11 factors are subsumed under four clusters. The first cluster is adaptive motivation (sometimes elsewhere referred to as “adaptive cognition”) comprising self-efficacy (informed by self-efficacy and agency perspectives; Bandura, 2001), valuing (informed by expectancy-value theory; Wigfield & Eccles, 2000), and mastery orientation (informed by goal theory; Elliot, 2005; Kaplan & Maehr, 2007). The second cluster is adaptive engagement (or “adaptive behavior”) comprising planning, task management, and persistence (informed by self-regulatory perspectives; Zimmerman, 2008). The third cluster is maladaptive motivation (or “maladaptive cognition”) comprising uncertain control (informed by the controllability element of attribution theory; Connell, 1985; Weiner, 2010), failure avoidance, and anxiety (informed by need achievement and self-worth motivation theories; Atkinson, 1957; Covington, 2000). The fourth cluster is maladaptive engagement (or “maladaptive behavior”) comprising self-handicapping and disengagement (also informed by need achievement and self-worth motivation theories; Atkinson, 1957; Covington, 2000).
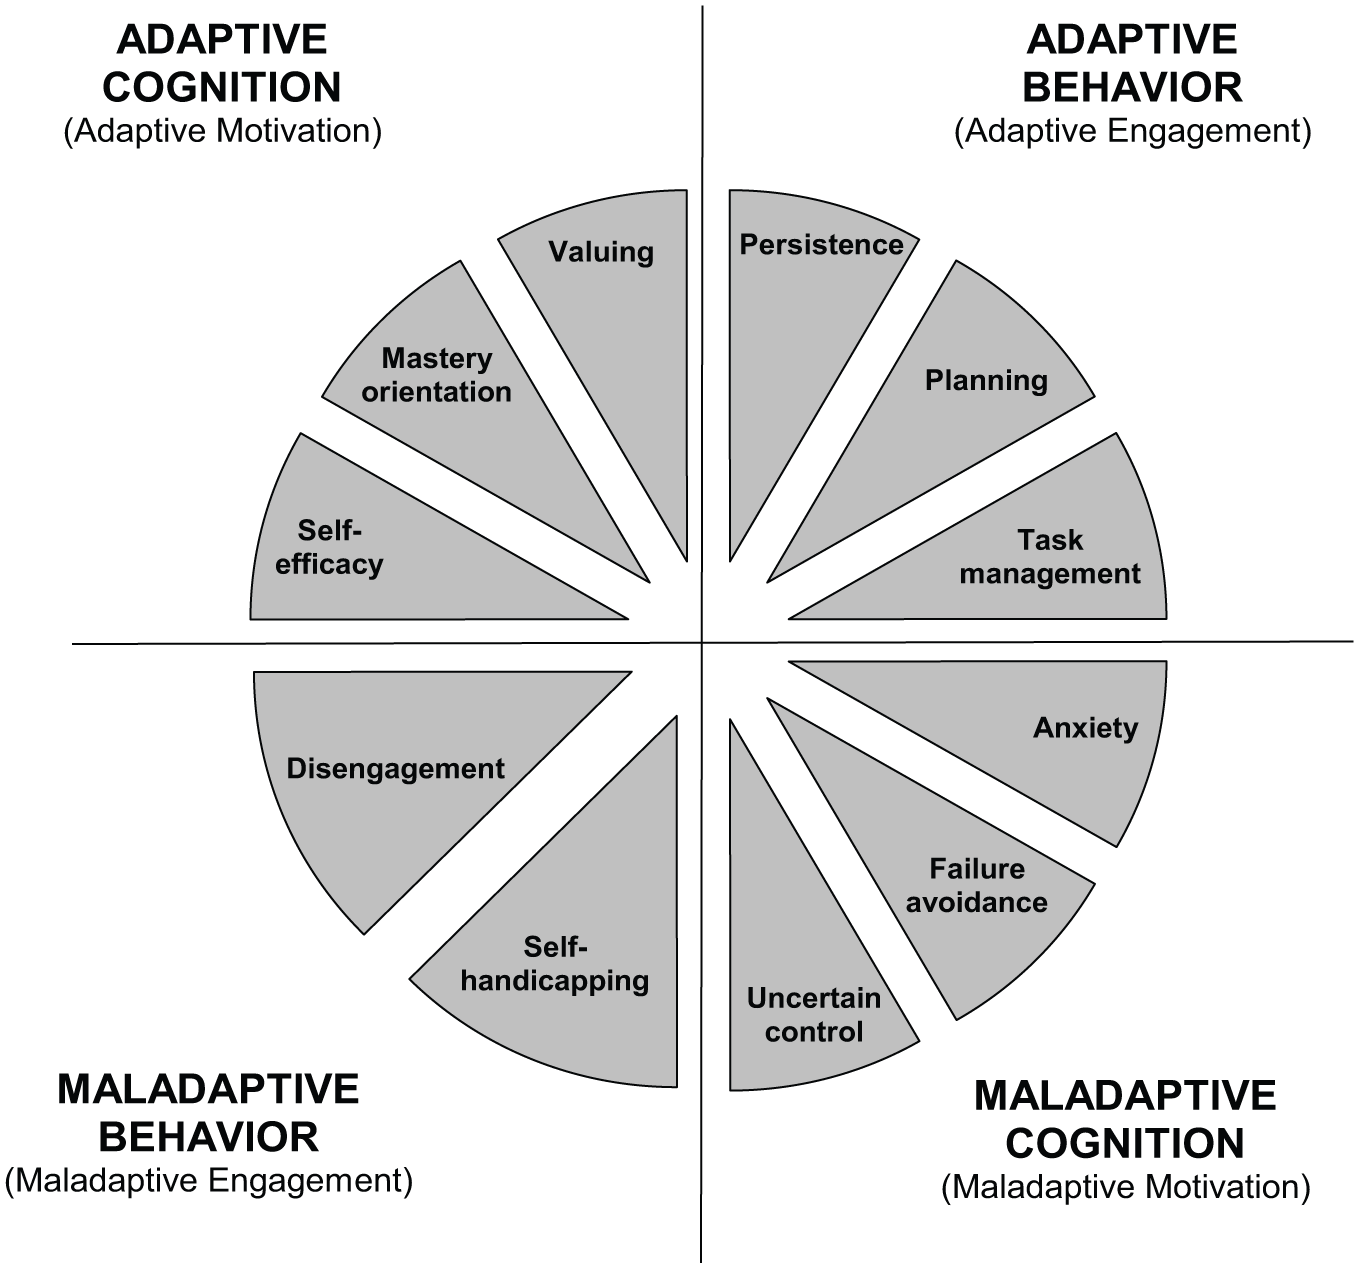
Motivation and Engagement Wheel.
Taken together, these factors seek to represent an encompassing set of motivation and engagement constructs derived from contemporary psycho-educational theorizing and research. As relevant to the present study, research among Jamaican students offers an opportunity to explore the generality of these conceptual foundations to students and a context that have received relatively little empirical attention to date.
The Wheel is accompanied by a measurement tool, the MES 1 (Martin, 2007, 2009, 2014). Aligning with the Wheel’s dimensions, the MES comprises the same 11 factors described above. MES scores have been validated in Australian- and Chinese-only samples (e.g., Martin, 2007, 2009; Nagabhushan, 2013; Plenty & Heubeck, 2011, 2013), in dual Australian and Chinese contexts (Martin & Hau, 2010; Martin, Yu, et al., 2013), and across North America, United Kingdom, China, and Australia (Martin et al., 2015). The present study extends this to psychometric assessment involving students from Jamaica (and in subsidiary analyses, a comparison with a normative archive of Australian students).
Motivation, Engagement, and Educational Correlates
To better understand the MES in the Jamaican context, we include four validational correlates (engagement, buoyancy, adaptability, achievement) that are cognate to factors in the MES and thus ought to be empirically associated with these factors. Each of these validational correlates have been associated with MES factors in prior research in other national contexts (Martin & Hau, 2010; Martin & Marsh, 2009, Martin, Nejad, Colmar, & Liem, 2012, 2013; Martin, Yu, et al., 2013; Martin et al., 2015) and so are appropriate for inclusion in our study of Jamaican students. The engagement factor draws on the tripartite engagement model proposed by Fredricks, Blumenfeld, and Paris (2004) and comprises cognitive, behavioral, and emotional engagement (Martin & Hau, 2010; Martin, Yu, et al., 2013). Academic buoyancy refers to students’ capacity to successfully deal with academic setback and difficulty (Martin & Marsh, 2009). Adaptability refers to students’ capacity to successfully respond to uncertainty, change, and novelty (Martin, Nejad, et al., 2013). Achievement is an “objective” index of academic performance in mathematics, English, and science. In line with prior cross-cultural findings (e.g., Martin & Hau, 2010; Martin, Yu, et al., 2013, Martin et al., 2015), adaptive and maladaptive dimensions of the MES should correlate positively and negatively, respectively, with these four validational factors.
Psychometric Assessment in the Present Study
The present study has two approaches to assessing the applicability of the MES among Jamaican students. The first is to examine the internal validity of the MES scores. This involves an exploration of distributional statistics, reliability, and factor structure. As part of this approach, we also test invariance in factor structure as a function of age, gender, socio-economic status (SES), and country (Jamaica vs. a normative archive Australian sample). The second relates to the external validity of the MES scores. This entails an examination of the relations between the MES factors and four validational correlates: engagement, buoyancy, adaptability, and achievement. Taken together, we seek to explore the extent to which a motivation and engagement framework and instrumentation that has received psychometric support in various national and regional contexts generalizes to students in an emerging regional context (Jamaica).
Although this is a novel context for MES research, we infer potential parameters for reliability and validity from previous work. For example, in summarizing findings of prior studies using the MES, Liem and Martin (2012) found mean internal consistency (Cronbach’s α) ranged between .77 and .79, comparative fit index (CFI) ranged between .97 and .98, and root mean square error of approximation (RMSEA) was .04. These thus serve as a comparison point for psychometrics in the present study. Liem and Martin also found the following mean correlations with validational constructs: adaptive cognition (self-efficacy, valuing, mastery orientation) with engagement (r = .65), buoyancy (r = .31), and achievement (r = .15); adaptive behavior (planning, task management, persistence) with engagement (r = .58), buoyancy (r = .39), and achievement (r = .09); maladaptive cognition (anxiety, failure avoidance, uncertain control) with engagement (r = −.20), buoyancy (r = −.74), and achievement (r = −.14); and maladaptive behavior (self-handicapping, disengagement) with engagement (r = −.65), buoyancy (r = −.33), and achievement (r = −.20). These also serve as a comparison point for correlations between the MES and validational constructs in this study. Finally, in the two largest measurement studies of the MES conducted thus far, invariance in factor structure as a function of gender and age was demonstrated with no change in CFI greater than .01 or in RMSEA greater than .015 (Martin, 2007, 2009). The present study can thus use these findings as comparison points for invariance testing with the expectation for invariance in loadings, residuals, correlations, and latent means as a function of gender and age.
Method
Participants and Procedure
Jamaica (central sample)
Participants for central analyses were 585 Year 6 (23%), Year 7 (15%), Year 8 (21%), and Year 9 (41%) middle and high school students from five government-run co-educational schools in Jamaica. A total of 70% attended schools in rural areas and 30% attended schools in the urban area of Kingston. Students were 10 to 17 years old, with a mean age of 13.50 (SD = 1.46) years. Just over half (58%) the sample comprised girls. An assigned school officer or teacher in each school was responsible for administering the survey in a normally scheduled class. The survey was in English. The rating scales were explained and a sample item presented. Students were instructed to complete the survey on their own but were allowed to ask questions to clarify any aspects of the procedure. Each survey was uniquely coded to match with achievement data in school records. Procedures used in the study were approved by the university research ethics committee and the principals of the schools involved.
Normative archive (subsidiary sample)
In subsidiary analyses, we compared the Jamaican factor structure with data drawn from a normative archive sample of 37,157 Australian students (compiled over a 15-year period, 2001-2014, across numerous research projects; see Liem & Martin, 2012 and Martin et al., 2015 for review and latest multination application). So as not to have disproportionate impact on results, we randomly selected a sample of 585 students from the archive to match the 585 Jamaican sample size. To further align the two samples, we drew our random sample from co-educational schools, students from regional areas, and students under the age of 18 years. This random sample ranged from 12 to 17 years (M = 14.19 years; SD = 1.47 years). Just over half (53%) of the participants were female. Survey administration procedure was largely the same as that described for the Jamaican sample (above).
Materials
MES
The MES comprises a suite of three instruments each tailored to elementary school, high school, and university/college students. This study used the MES–High School 2 (MES-HS; Martin, 2014). The scale comprises 11 factors, with four items on each factor (thus, a 44-item instrument). For information about the history and development of this scale, see Liem and Martin (2012). Adaptive cognition (or adaptive motivation) comprises mastery orientation (e.g., “I feel very pleased with myself when I really understand what I’m taught at school”), self-efficacy (e.g., “If I try hard, I believe I can do my schoolwork well”), and valuing (e.g., “Learning at school is important to me”). Adaptive behavior (or adaptive engagement) comprises persistence (e.g., “If I can’t understand my schoolwork at first, I keep going over it until I understand it”), planning (e.g., “Before I start an assignment I plan out how I am going to do it”), and task management (e.g., “When I study, I usually study in places where I can concentrate”). Maladaptive cognition (or maladaptive motivation) comprises anxiety (e.g., “When exams and assignments are coming up, I worry a lot”), failure avoidance (sometimes referred to as performance avoidance; for example, “Often the main reason I work at school is because I don’t want to disappoint my parents”), and uncertain control (e.g., “I’m often unsure how I can avoid doing poorly at school”). Maladaptive behavior (or maladaptive engagement) comprises self-handicapping (e.g., “I sometimes don’t study very hard before exams so I have an excuse if I don’t do as well as I hoped”) and disengagement (e.g., “I often feel like giving up at school”). These measures were rated on a 1 (strongly disagree) to 7 (strongly agree) scale. Psychometric properties for the present study are presented in Table 1.
Descriptive Statistics, Cronbach’s Alpha’s, and Standardized CFA Factor Loadings.
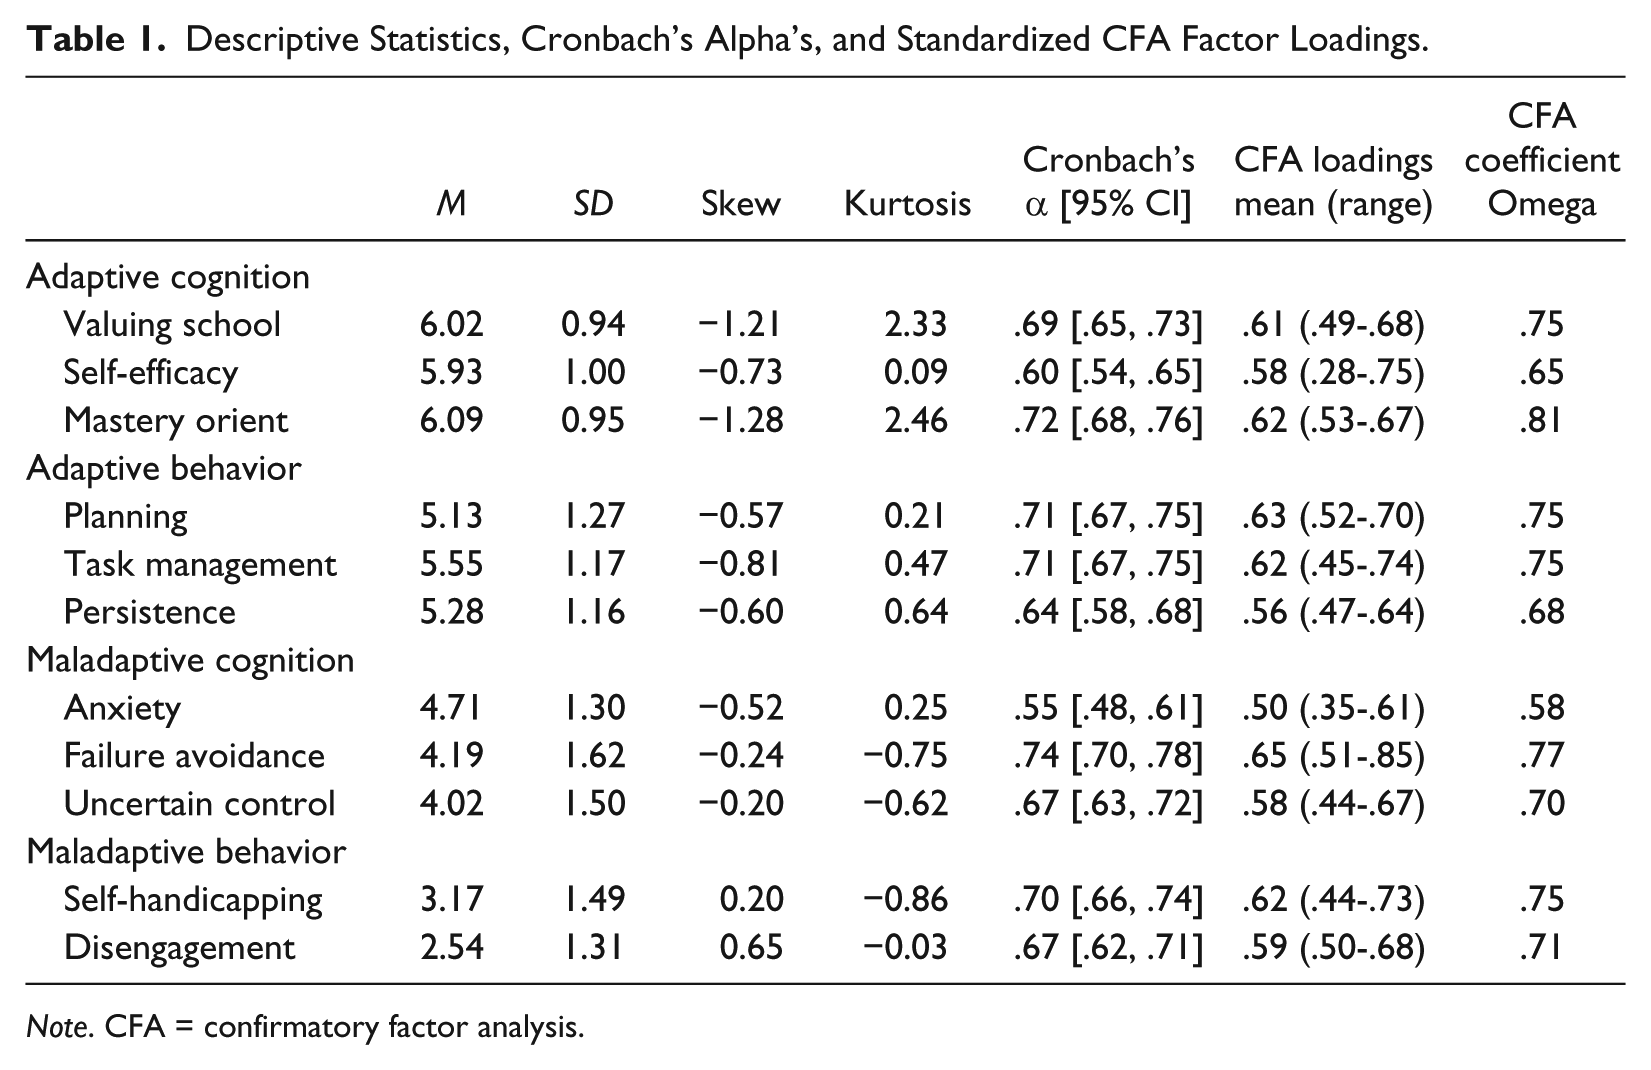
Note. CFA = confirmatory factor analysis.
Validational correlates
To examine the pattern of relations between the MES and validational correlates, students were also administered scales that explored their engagement, buoyancy, adaptability, and achievement. Engagement comprised items addressing cognitive, behavioral, and emotional engagement, consistent with Fredricks et al. (2004; 12 items, α = .73; for example, “I participate when we discuss things in class”; Martin, 2007). Buoyancy assessed the extent to which students are able to successfully respond to academic setback, challenge, and adversity (four items, α = .62; for example, “I think I’m good at dealing with schoolwork pressures”; Martin & Marsh, 2008). Adaptability assessed the extent to which students effectively respond to change, uncertainty, and novelty (nine items, α = .82; for example, “To assist me in a new situation, I am able to change the way I do things if necessary”; Martin, Nejad, et al., 2013). Each of these measures was rated on a 1 (strongly disagree’) to 7 (strongly agree) scale.
Achievement (α = .79) was measured by students’ performance in mathematics, English, and science. This information was garnered from school records based on tests set by each subject teacher as a gauge for students’ performance across the school term. Tests were thus common to all students in each school but differed between schools. All students completed three English tests, three mathematics tests, and four science tests. The results for the study were based on the first tests completed after the survey data were collected. English achievement was a composite of performance in English grammar, comprehension, and literature (jointly called language arts). Science achievement was a composite of performance in integrated science, biology, chemistry, agricultural science, and physics (all students until Year 9 take all of these classes). Mathematics achievement was an aggregation of performance in geometry, arithmetic, and algebra. All test scores were percentages with possible ranges from 0 to 100. Scores from each subject were standardized within each year group within each school to ensure the data were comparable across different grades and schools. In addition, although we standardized across year levels to get mean-level equivalence, we conducted further analyses to ensure that the associations between the MES and achievement did not vary markedly across year levels. We conducted two multigroup confirmatory factor analyses (CFAs), with year level as the grouping variable. The first CFA allowed correlations between MES measures and achievement to be freely estimated; the second constrained these correlations to be equal across the year levels. Based on recommendations by Chen (2007), there was not a significant change in RMSEA, and based on recommendations by Cheung and Rensvold (2002), there was not a significant change in CFI. It therefore appears that alongside mean-level equivalence across year levels, we can also suggest year-level equivalence in terms of associations between the MES and achievement.
Statistical Analyses
The central analyses involved CFA using Mplus 7.31 (Muthén & Muthén, 2015). Maximum likelihood estimation with robustness to non-normality (MLR) was utilized as the method of estimation (Muthén & Muthén, 2015). Missing data for the Jamaican sample were 2.72% (there were no missing data for the archive sample). Missing data were imputed within Mplus using full information maximum likelihood (FIML; Muthén & Muthén, 2015). For this study, the CFI, RMSEA, and standardized root mean square residual (SRMR) were used as the benchmarks for fit. For CFI, a value of .90 or above is considered an acceptable fit (McDonald & Marsh, 1990). For RMSEA and SRMR, values less than or equal to .08 are deemed satisfactory fit (Marsh, Balla, & Hau, 1996; Schumacker & Lomax, 2004). We also assessed the internal consistency of each MES factor by way of Cronbach’s alpha and coefficient omega. In the main, values at or above .70 are considered acceptable; however, values at or above .60 can also be considered acceptable if there is previous (or concurrent) evidence of validity for the factor, there are theoretical reasons for all items in the factor, and the number of items in the factor is relatively small (less than 10; Loewenthal, 2001). Because these criteria apply to the MES, we took reliabilities more than .60 as being minimally acceptable.
We also conducted multigroup invariance tests to determine the extent to which the factor structure was invariant as a function of age (students younger or equal to 12 years and students 13 years and over), gender (female, male), SES (low and high SES based on a mean sample split of a composite measure of parents’ education, parents’ occupation, household size, household amenities, home educational resources; see Martin, Martin, & Evans, 2016), and country (Jamaica; Australia). We tested for metric invariance (loadings constrained), residual invariance (loadings, residuals constrained), structural-correlational invariance (loadings, residuals, correlations constrained), and structural-mean invariance (loadings, residuals, correlations, latent means constrained). Changes in CFI of more than .01 (Cheung & Rensvold, 2002; however, we also signal if there is invariance against the more stringent criterion of .002 suggested by Meade, Johnson, & Braddy, 2008) and variations in RMSEA of more than .015 (Chen, 2007) against a configural model (all parameters free across groups) were taken to indicate the factor structure differs across these sub-groups.
Results
Descriptive Statistics and CFA
Descriptive statistics
Table 1 presents distributional statistics (skewness and kurtosis). These suggest that each factor is approximately normally distributed. Reliability coefficients (Cronbach’s α and coefficient omega) are also shown in Table 1. Based on recommendations and scale-relevant considerations by Loewenthal (2001; see “Method” section), these are considered acceptable, demonstrating values >.60, with the exception of anxiety (addressed in “Discussion” section).
Factor structure
The 11-factor MES model was examined using CFA, with the following fit statistics: χ2 = 1,482.39, df = 847, p < .001, CFI = .88, RMSEA = .036, SRMR = .054. Thus, although most indices indicated acceptable fit (e.g., RMSEA < .05, SRMR < .08), the CFI was not satisfactory (<.90). Accordingly, modification indices were inspected and two parameters were suggested to be freed: an anxiety item (Item 3) cross-loading on the disengagement factor and a correlated residual between a mastery orientation item and a valuing item (see “Discussion” section). The model was re-estimated, yielding satisfactory fit, χ2 = 1,398.73, df = 845, p < .001, CFI = .90, RMSEA = .034, SRMR = .050. Standardized factor loading means are presented in Table 1. Taken as a whole, the loadings are acceptable (>±.40), with mean loadings all above .50 and all individual loadings significant at p < .001; however, two items were relatively low in absolute value (self-efficacy, Item 2 = .28; anxiety, Item 3 = .35, though, as noted above, the latter shared a loading with disengagement). For completeness, we also assessed the fit of the higher order model. Findings indicated that it yielded a significantly poorer fit than the first-order model, Δχ2 = 142.23 (df = 38, p < .001). Although the 44-item MES is not intended to be factor analyzed at the scale-score level, it can be illuminating to conduct a four-factor CFA with the 11 scale scores. We cannot formally compare it with the 44-item analyses (as it is not nested), but it is informative to note that this structure yielded an acceptable fit (χ2 = 121.53, df = 38, p < .001, CFI = .94, RMSEA = .061, SRMR = .057).
Correlations
Latent correlations among MES factors derived from the CFA are presented in Table 2 (Table 3 presents higher order correlations). Correlations are broadly consistent with previous measurement work with the MES (see Liem & Martin, 2012 for a review), with adaptive motivation and engagement positively correlated—and both of these negatively correlated with maladaptive engagement. Also in line with previous work, maladaptive motivation reflects a more mixed profile; for example, anxiety is positively correlated with adaptive constructs, a finding not dissimilar to research in other contexts (e.g., DiLalla, Marcus, & Wright-Phillips, 2004; DiPerna, Lei, & Reid, 2007).
Latent First-Order Correlations Between MES Factors and With Validational Constructs.
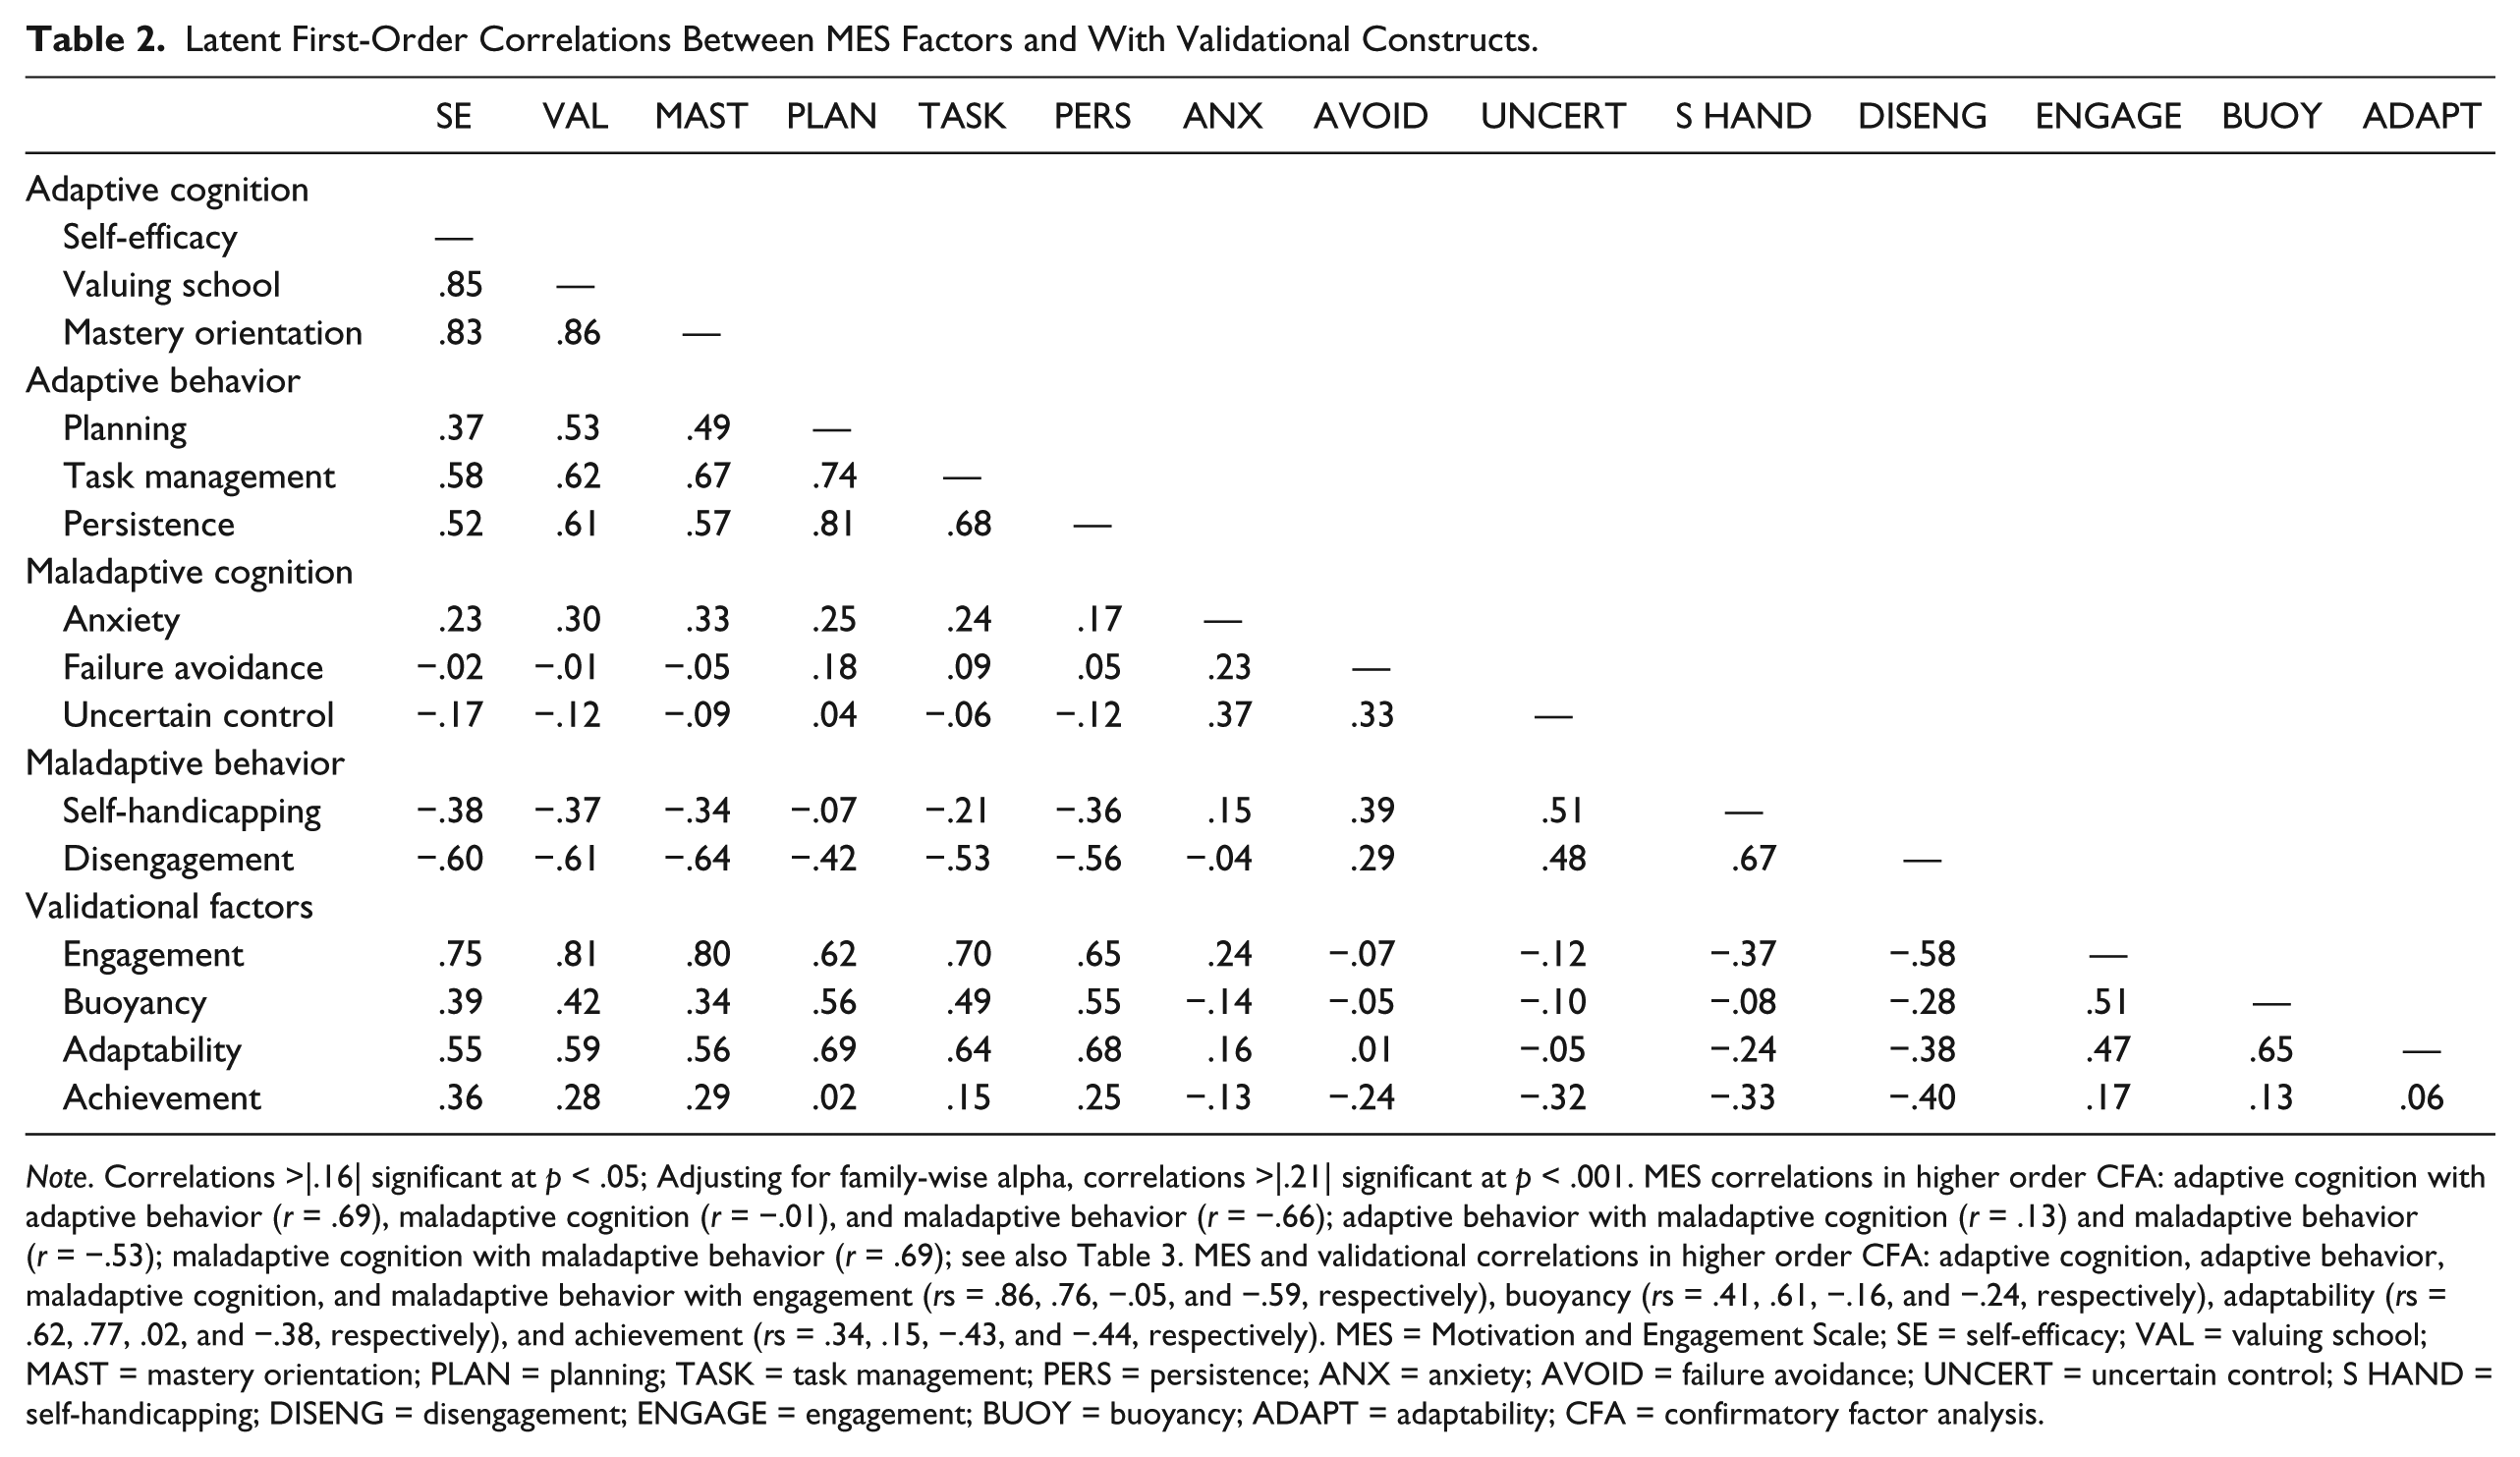
Note. Correlations >|.16| significant at p < .05; Adjusting for family-wise alpha, correlations >|.21| significant at p < .001. MES correlations in higher order CFA: adaptive cognition with adaptive behavior (r = .69), maladaptive cognition (r = −.01), and maladaptive behavior (r = −.66); adaptive behavior with maladaptive cognition (r = .13) and maladaptive behavior (r = −.53); maladaptive cognition with maladaptive behavior (r = .69); see also Table 3. MES and validational correlations in higher order CFA: adaptive cognition, adaptive behavior, maladaptive cognition, and maladaptive behavior with engagement (rs = .86, .76, −.05, and −.59, respectively), buoyancy (rs = .41, .61, −.16, and −.24, respectively), adaptability (rs = .62, .77, .02, and −.38, respectively), and achievement (rs = .34, .15, −.43, and −.44, respectively). MES = Motivation and Engagement Scale; SE = self-efficacy; VAL = valuing school; MAST = mastery orientation; PLAN = planning; TASK = task management; PERS = persistence; ANX = anxiety; AVOID = failure avoidance; UNCERT = uncertain control; S HAND = self-handicapping; DISENG = disengagement; ENGAGE = engagement; BUOY = buoyancy; ADAPT = adaptability; CFA = confirmatory factor analysis.
Latent Higher Order (Lower Diagonal) and Scale Score (Upper Diagonal) Correlations Among MES Factor Groupings.
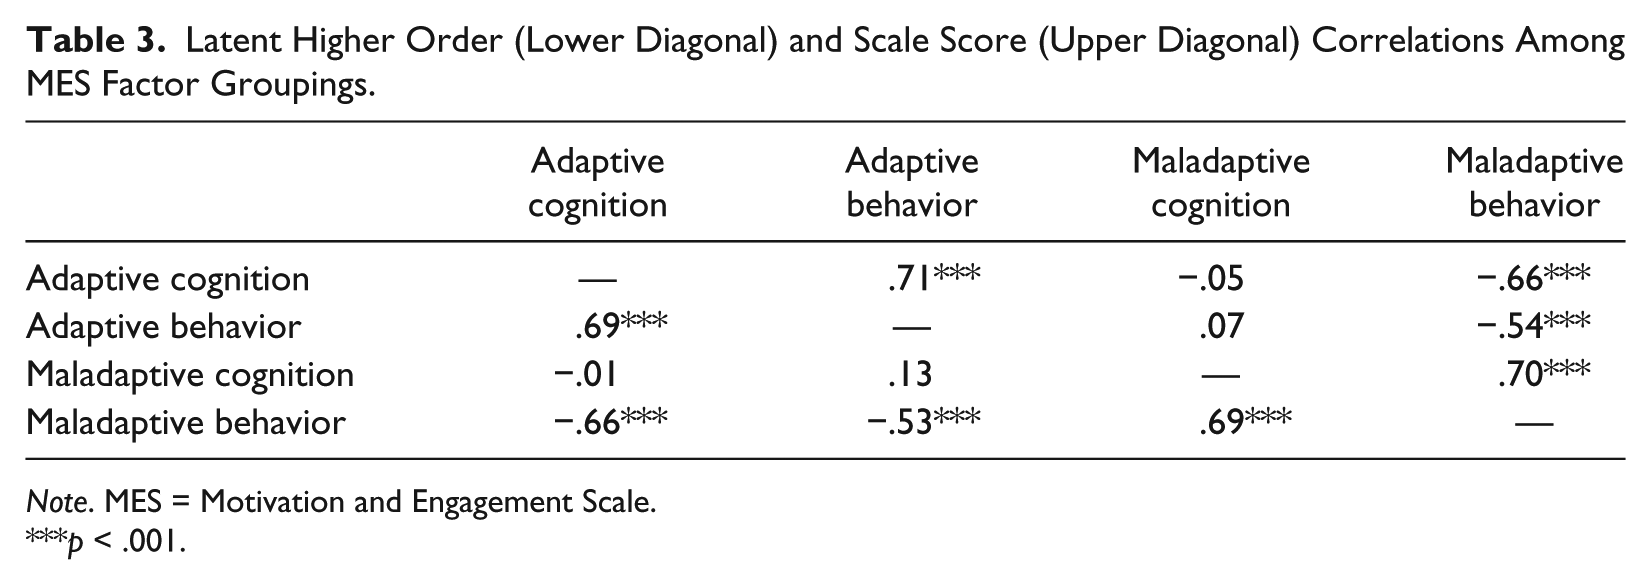
Note. MES = Motivation and Engagement Scale.
p < .001.
Invariance in Factor Structure
We assessed metric invariance, residual invariance, structural-correlational invariance, and structural-mean invariance against a configural model (all parameters free across groups) as a function of age, gender, SES, and nation (see “Method” section for groupings). As shown in Table 4, in 15 of 16 invariance models (four invariance models for each of four groups), there was no significant change in CFI greater than .01 (Cheung & Rensvold, 2002; however, using Meade et al.’s [2008] stringent .002 criterion, more revealed a significant change in CFI), whereas none of the invariance tests revealed a change in RMSEA greater than .015 (Chen, 2007). Only in one test was there evidence of a lack of invariance (ΔCFI > .01; Cheung & Rensvold, 2002—but not in RMSEA): structural-mean invariance as a function of SES grouping, with high SES students generally reflecting a more adaptive motivation and engagement profile than low SES students. Interestingly, although loadings, residuals, correlations, and latent means did not vary markedly as a function of participant groups, Table 4 shows that the CFI (but not RMSEA) did indicate lower fit for the configural model from the pooled model as a function of age (older students better fit), gender (females better fit), and SES (higher SES better fit).
Invariance Tests.

Note. df = degrees of freedom; CFI = comparative fit index; RMSEA = root mean square error of approximation.
χ2/df difference from configural model: *p < .05. **p < .01. ***p < .001.
Associations With Validational Correlates
We then explored the relationships between each MES factor and a set of four validational constructs: academic engagement, buoyancy, adaptability, and achievement. Latent correlations were derived through a CFA of the 11 MES factors and the four validational constructs. This CFA yielded satisfactory fit, χ2 = 2,675.12, df = 1,783, p < .001, CFI = .90, RMSEA = .029, SRMR = .049. Table 2 shows correlations. Correlations here are also broadly in line with prior research (Liem & Martin, 2012; Martin et al., 2012; Martin, Nejad, et al., 2013). Adaptive MES factors are positively correlated with engagement, buoyancy, adaptability, and achievement. Maladaptive cognitions had mixed results (indeed, consistent with prior work—see Liem & Martin, 2012 for a review), with anxiety showing positive relationships with engagement and adaptability, and failure avoidance and uncertain control displaying no significant correlations besides negative correlations with achievement. Maladaptive behaviors demonstrated negative correlations with all validational correlates.
Discussion
Findings of Note
For this Jamaican sample, reliabilities were generally acceptable, distributional properties of factors (skew and kurtosis) were strong, factor structure was sound, and by most measures, key elements of the factor structure were invariant across age, gender, SES, and a randomly selected normative archive of Australian students. Findings for the MES in this Jamaican study are also broadly in line with those in other studies. Notwithstanding this, there were some departures and nuances worth noting, and we discuss these below.
Although reliability conformed with criteria considered minimally acceptable for the MES (Loewenthal, 2001), when considered in terms of specific reliability values, it was evident that Jamaican coefficients were lower than the .77 to .79 range typically reported for the MES elsewhere (see Liem & Martin, 2012 for review). Given the higher reliabilities for the MES that are typically reported elsewhere (including in different national contexts), we do not consider it necessary to improve the MES by, for example, including more or “better” items. Notwithstanding this, reliabilities found here in the Caribbean context evinced some differences from majority findings. This underscores the importance of conducting latent modeling of the MES in the Caribbean context so that models can be appropriately purged of unreliability.
In considering the correlations between MES factors and validational constructs among Jamaican students, we take into account correlations with similar constructs in other (non-Jamaican) samples. A helpful source of information is a review by Liem and Martin (2012) that synthesized patterns of correlations in prior measurement work, summarized in our introduction (“Psychometric Assessment in the Present Study” section). By way of comparison (and also reported in Table 2 notes), we conducted a higher order CFA of the MES alongside the validational constructs and found broadly similar patterns of correlations. When comparing these two sets of findings, we see some alignment with regard to MES factors and engagement in Jamaica, slightly higher associations between MES factors and achievement for Jamaican students, and some departure in terms of the correlation between MES factors and buoyancy (relatively weaker associations for Jamaican students).
When considering other studies that have included “objective” measures against which the MES scores can be validated, it appears that findings for our Jamaican sample are in line with these other investigations. For example, MES factors have correlated with achievement in hypothesized directions (range r = −.38 to .46) with an absolute mean of r = .28 (Plenty & Heubeck, 2011) and this is the same as the present study’s absolute mean of r = .28 (range r = −.40 to .36). The present study’s mean correlations between MES factors and achievement is also not too similar to another study which found that the four higher order MES factors correlated with either GPA or university entrance scores at an absolute mean of r = .23 (range r = −.26 to .50; Wurf & Croft-Piggin, 2015).
Notably, however, there were a number of correlations that were not as salient as might have been expected. For example, although the aggregate association between the MES factors and achievement were in line with previous research (see above), for some MES factors, the correlation with achievement was relatively low. For example, adaptive behavior factors (planning, task management, persistence) did not share notable variance with achievement relative to adaptive cognitive factors (self-efficacy, valuing, mastery orientation). Adaptive cognition and adaptive behavior have been conceptualized as motivation and engagement dimensions, respectively (Martin, 2009), and debates around the distinction and relative yields of each of these is ongoing (for reviews, see Christenson, Reschly, & Wylie, 2012), including in terms of their role in academic achievement. It seems for the present Jamaican sample, adaptive motivation is a more salient factor in their achievement.
Another pattern of relatively lower correlations involved maladaptive cognition and the validational constructs (particularly engagement, buoyancy, and adaptability). In conceptualizing and research around self-worth protection, it has been argued that these maladaptive cognition constructs may not necessarily be detrimental to some outcomes for some students. For example, some students may respond to anxiety, fear of failure (failure avoidance), and uncertainty with greater engagement to thwart the negative outcome they want to avoid (Covington, 2000; Martin & Marsh, 2003). Also, mixed findings on similar (non-MES) factors in other research are not uncommon (e.g., see DiLalla et al., 2004; DiPerna et al., 2007). For example, although for some students anxiety has been linked to arousal that may have positive effects, for other students, anxiety is linked to cognitive interference that may have negative effects (Cassady & Johnson, 2002).
Alongside some relatively low correlations, we also note high correlations among self-efficacy, valuing school, and mastery orientation (adaptive cognition) factors. Indeed, with a mean inter-correlation of r = .85, these correlations are consistent with findings of a recent multination investigation (Martin et al., 2015) conducted among North American students (mean r = .90), U.K. students (mean r = .88), and Chinese students (mean r = .87), but higher than two major Australian measurement studies with mean rs of .76 (Martin, 2007) and .75 (Martin, 2009). As the Australian data are based on large heterogeneous archive samples of more than 12,000 students (Martin, 2007) and 21,000 students (Martin, 2009), it may be that these samples enable more precise estimates of inter-factor correlations. The international samples are relatively smaller and from fewer schools (than the Australian archive data), and thus, less heterogeneous. In the first instance, then, further work might look to explore these inter-factor correlations among a wider range of schools in Jamaica. To the extent that similarly high inter-factor correlations are derived among larger and more heterogeneous Jamaican samples, we would then look to cross-cultural interpretations of how students’ self-efficacy, valuing of school, and mastery orientation develop and why they inter-relate to such a high degree.
It was also interesting to note that modification indices suggested two additional parameters be freed to improve fit for this sample: an anxiety item cross-loading on the disengagement factor and a correlated residual between a mastery orientation item and a valuing item. With regard to the former, the anxiety item in question pertains to negative feelings when taking tests (“When I do tests or exams I don’t feel very good”) and may be an insight into understanding when Jamaican students are inclined to abandon effort (i.e., disengage). With regard to the correlated residuals, both the mastery orientation item (“I feel very pleased with myself when I do well at school by working hard”) and the valuing item (“Learning at school is important”) are effort- and learning-oriented, leading to a correlation between them. Having said this, however, prior research has not required freeing these parameters and so these modifications may represent minor and potentially random fluctuations in the Jamaican sample. Further research in the Jamaican and Caribbean context (and possibly other developing contexts) is required to see whether the need for modification is replicated and if so, to better understand why.
Other findings to note relate to the invariance tests. First, despite evidence of invariance (from the configural model) in 15 of 16 invariance tests, there was one exception (based on ΔCFI) in the case of latent means as a function of low and high SES groups (however, there was not a significant difference in latent means when using ΔRMSEA as the indicator of invariance). High SES generally reflected a more adaptive motivation and engagement profile. Once more, then, SES emerges as a factor in shaping levels of motivation and engagement, in line with prior international work (Organisation for Economic Co-Operation and Development, 2013). Second, although loadings, residuals, correlations, and latent means did not vary markedly as a function of participant groups, the CFI (but not RMSEA) did indicate lower fit for the configural model from the pooled model as a function of age (older students better fit), gender (females better fit), and SES (higher SES better fit). Again, we advise further research to better understand this and whether further data suggest the need for multigroup analyses when assessing motivation and engagement in diverse Jamaican student samples.
Implications for psycho-educational assessment are also noteworthy. Given the rise of international assessment exercises, it is increasingly important to demonstrate applicability in concepts and measurement tools for different regional and national contexts. One important feature of concepts and measurement tools is applicability across distinct contexts. If concepts and instrumentation are not applicable in different contexts, then data analysis ought to be disaggregated as a function of context (e.g., as a function of region and/or nation) and not based on pooled data (Tabachnick & Fidell, 2013). With regard to motivation and engagement assessment, our findings suggest that factors and their multidimensionality are applicable to the Jamaican context. Combined with our multigroup CFAs as a function of country (Jamaica vs. Australia) and prior evidence in U.S., Canadian, U.K., Australian, and Chinese contexts, this provides further support for integrative (pooled) data analysis in relation to multidimensional motivation and engagement factors as assessed using the MES.
Limitations and Future Directions
There are limitations important to consider and which suggest directions for future research. First, notwithstanding our objective achievement data, all other data were self-reported. Future validation in the Jamaican context might consider additional measures such as ratings of the student by teachers and/or parents. Second, prior research in other contexts has shown relationships between MES factors and diverse outcomes (e.g., see Bodkin-Andrews, Denson, & Bansel, 2013; Bugler, McGeown, & St Clair-Thompson, 2015; Plenty & Heubeck, 2011; Wurf & Croft-Piggin, 2015; Yeung, Barker, Tracey, & Mooney, 2013). Future research might validate MES scores with a wider range of constructs in the Caribbean context. Third, we have suggested that Jamaican students are somewhat representative of students in other developing nations in the Caribbean context. There is a need to directly test this by conducting similar research in other nations in the region. Fourth, as discussed above, two additional parameters were freed in the final measurement model, and there were some aspects of invariance testing that departed from prior work. Future research might look to identify whether these are idiosyncratic to the present sample, or whether these are systemic adjustments to modeling that might be needed for students in the Jamaican population. Fifth, it is relevant to note the lower reliability for anxiety. Although this is not uncommon for a slightly younger sample for whom tests and test anxiety are not as salient as they are for older students (Martin, 2009), further work on anxiety in developing educational contexts would be helpful. Finally, this study was quantitative, and findings would benefit from qualitative insights to illuminate how these factors manifest in students’ daily academic lives.
Conclusion
The present study represents the first effort in testing a multidimensional academic motivation and engagement framework and instrumentation among Jamaican students. Findings provide preliminary support for the applicability of the proposed framework and instrumentation to students in this setting. This is noteworthy, given increasing attention to international assessment in education and given the educational challenges experienced in this region and for which motivation and engagement have significant relevance.
Footnotes
Acknowledgements
The authors would like to thank all participating schools, the Australian Research Council, and Australia Awards for supporting this research.
Declaration of Conflicting Interests
The author(s) disclosed receipt of the following financial support for the research, authorship, and/or publication of this article: One of the instruments (the Motivation and Engagement Scale, authored by this study’s first author) is a published tool that attracts a small fee, part of which is put towards its ongoing development and administration, and part of which is donated to UNICEF (United Nations Children’s Emergency Fund). No fee was incurred for this research.
Funding
The author(s) received no financial support for the research, authorship, and/or publication of this article.