



Abstract
This report presents further validation evidence for the Student Subjective Wellbeing Questionnaire (SSWQ). Analyses conducted with a sample of urban middle-school students (Grades 5-8, N = 335) targeted two limitations from previous validation studies: the lack of convergent validity evidence linking responses to the SSWQ with actual school outcomes and the lack of comparative validity evidence demonstrating the relative contributions of the SSWQ’s first-order and second-order factors for predicting criterion variables. Results from the present study confirmed the SSWQ’s higher-order measurement model and then demonstrated that both first-order and second-order factors had substantive effects on several school-reported outcomes, although first-order factors were more robust predictors overall. Implications for theory, practice, and future research are briefly discussed.
The Student Subjective Wellbeing Questionnaire (SSWQ; Renshaw, Long, & Cook, 2015) is a 16-item self-report instrument for measuring four classes of school-specific wellbeing behavior: joy of learning (JL), school connectedness (SC), educational purpose (EP), and academic efficacy (AE). Within the context of the conceptual framework underlying this measure, wellbeing refers to any kind of behavior—private (thoughts and feeling only observable to the self) or public (overt actions observable to both the self and others)—that is either personally or socially desirable (Renshaw, 2016). Given that subjective refers to self-appraisal, the term student subjective wellbeing is used in this sense to refer broadly to students’ self-appraisals of desirable behavior exhibited within the school context. The four particular constructs measured by the SSWQ were selected as representative examples of four more general domains of student wellbeing behavior—peer and teacher relationships, educational performance and learning behaviors, affective experiences at or about school, and evaluations of and orientations toward school—that were derived from a thematic analysis of research assessing students’ healthy and successful functioning (Renshaw et al., 2015).
To date, three studies have investigated the structural and convergent validity of student responses to the SSWQ. The first study provided initial evidence in favor of the SSWQ’s higher-order measurement model—with the four first-order factors (i.e., JL, SC, EP, and AE) structured as indicators of a single second-order factor (i.e., student wellbeing [SW])—yielding good data–model fit, robust factor loadings, and strong construct reliabilities (Renshaw et al., 2015). This study also demonstrated that the second-order SW factor was a strong predictor of school prosociality and academic perseverance factors, and that classifications derived from SSW composite scale scores were predictive of a variety of specific risks and assets. The second study replicated the structural validity findings obtained in the first study with a demographically similar sample, providing further evidence that the SSWQ’s higher-order measurement model was characterized by robust psychometrics (Renshaw, 2015). Results from the second study also indicated that SW classifications derived from composite scale scores were associated with substantive differences in academic achievement, cumulative risks, and cumulative assets. Finally, the third study generalized the structural validity of the SSWQ’s higher-order measurement model with a demographically different sample, while also demonstrating that the second-order SW factor was a strong predictor of several school-specific wellbeing factors (e.g., motivation, attitudes, and self-perceptions; Renshaw & Arslan, 2016).
Although these three foundational studies provide positive evidence supporting the validity of student responses to the SSWQ, it is noteworthy that the previous convergent validity analyses have at least two limitations. First, there has been universal reliance on self-reported indicators of student functioning as the criterion measure of interest, suggesting that the relation between responses to the SSWQ and actual school outcomes is unknown. Second, previous convergent validity analyses have focused solely on the predictive power of the second-order SSW factor (or observed scores derived from its composite scale), failing to consider the comparative predictive validity of the first-order factors (or observed scores derived from the subscales). The purpose of the present study, then, was to address these limitations by investigating two aspects of convergent validity: the comparative correlations between observed scores derived from the first-order and second-order SSWQ scales and several actual school-reported outcomes, and the comparative predictive power of the SSWQ’s first-order and second-order latent factors in relation to these same criterion variables.
Method
Participants
Participants were 335 students (47.2% female) enrolled in Grades 5 to 8 (5th = 19.1%, 6th = 23.6%, 7th = 28.4%, and 8th = 29%) within a public charter school located in a large urban city within the southern region of the United States. The majority of participants self-identified as Black/African American (92.5%), while a few students self-identified as Hispanic/Latino (3%), White/Caucasian (2.7%), and “Other” (1.8%). Most students were eligible for free or reduced-price lunch (94%). All participants completed the SSWQ as part of a school-sponsored student wellbeing screening initiative using a secure online server that was accessed through the school’s computer lab. Institutional review board approval was obtained from the first author’s university to use the de-identified, preexisting screening data, accompanied by de-identified school-reported outcome data (see below) for research purposes. To maintain participant anonymity, a member of the school administration staff compiled the de-identified dataset.
Measures
The SSWQ (Renshaw et al., 2015), which was described in detail above, was the target measure in the present study. The measure is comprised of four, four-item subscales, with each item arranged along the same 4-point response scale (1 = almost never, 2 = sometimes, 3 = often, 4 = almost always). All items are directly phrased, requiring no reverse scoring (see Renshaw et al., 2015, for a full presentation of the measure’s items). Subscale scores are produced by summing all items within each scale, and an overall composite score (representing generalized student subjective wellbeing) is produced by summing all of the subscales scores. Descriptive characteristics of participants’ responses to the SSWQ are presented in Table 1.
Descriptive Characteristics for Observed Variables.
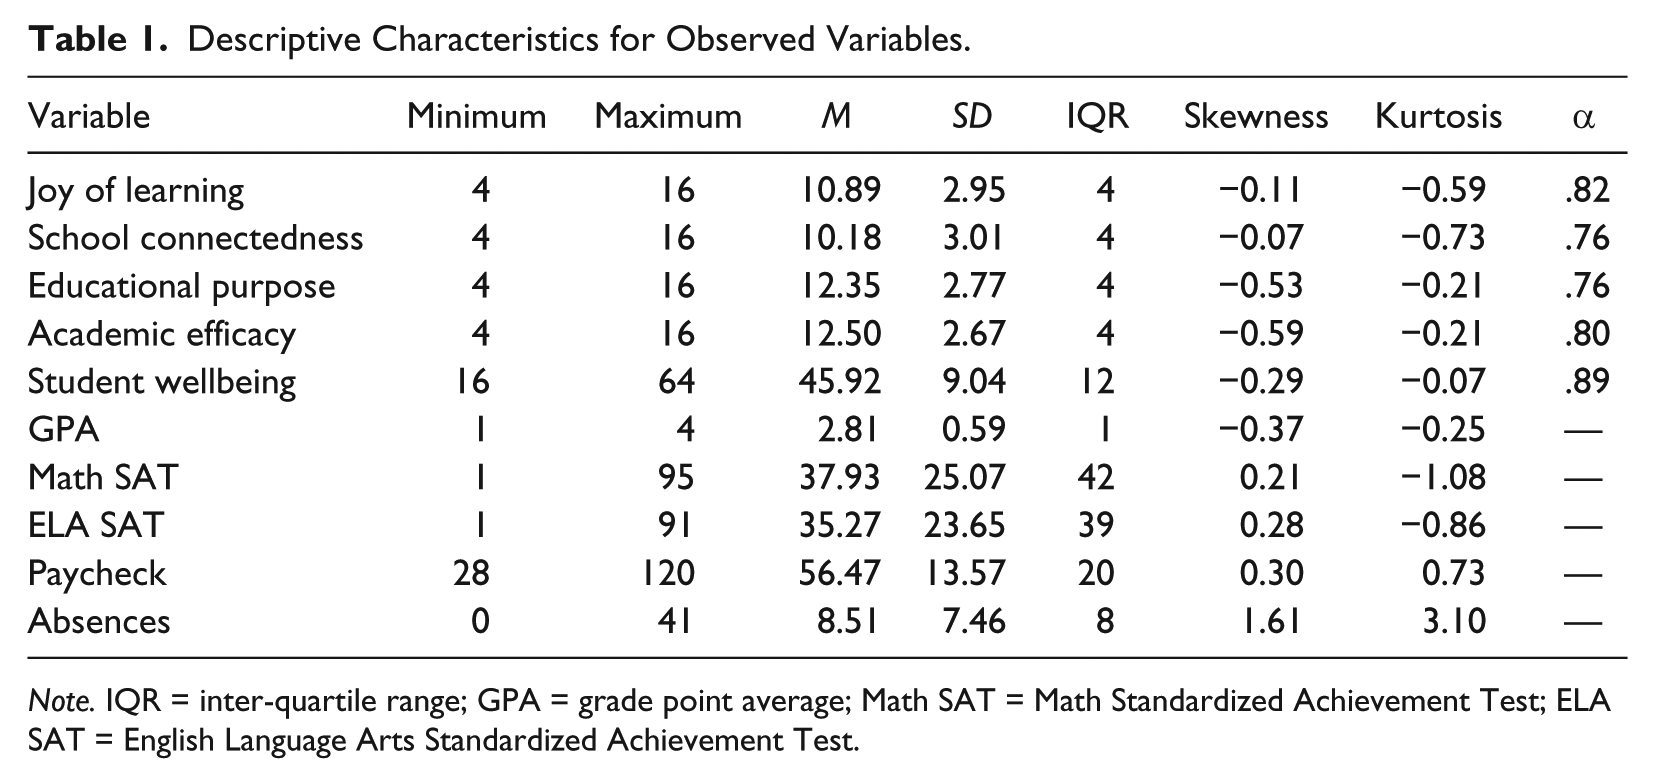
Note. IQR = inter-quartile range; GPA = grade point average; Math SAT = Math Standardized Achievement Test; ELA SAT = English Language Arts Standardized Achievement Test.
Several school-reported outcomes were used as criterion variables to investigate the convergent validity of responses to the SSWQ: (a) current grade point average (GPA), (b) the most recent nationally normed percentile scores for both Math and English Language Arts standardized achievement tests (hereafter referred to as Math SAT and ELA SAT), (c) current monthly average “behavioral performance paycheck” scores (hereafter referred to as “paycheck”)—with higher values representing more academically engaged and prosocial student behavior—used as a progress-monitoring metric within a schoolwide token economy system, and (d) current total number of absences (combined excused and unexcused) during the present school year. Descriptive statistics for all school-reported outcome variables are also presented in Table 1.
Data Analysis
Confirmatory factor analyses (CFA) were conducted to investigate the structural validity of responses to the SSWQ in relation to the measure’s proposed higher-order measurement model. To determine the goodness of data–model fit, a combination of absolute and incremental fit indices was used—including the comparative fit index (CFI), Tucker–Lewis index (TLI), and root mean square error of approximation (RMSEA)—with their accompanying decision rules (see Kenny, 2015). Factor loadings (λ) ≥ .33 were considered adequate, as they accounted for at least 10% of the variance extracted from each item by the latent factor (also referred to as indicator reliability or ℓ2). And latent construct reliability coefficients (H) ≥ .70 were considered desirable, as they estimate a strong intra-factor correlation over repeated administrations (Mueller & Hancock, 2008).
The convergent validity of the SSWQ’s measurement model in relation with the school-reported criterion variables was examined in two phases. First, bivariate correlations were conducted between scores derived from the SSWQ scales and each of the school-outcome criterion variables. Correlation coefficients (r) were used as the effect size of interest for this analysis and were interpreted according to conventional standards (see Cohen, 1988). Next, the comparative predictive power of the SSWQ’s first-order and second-order factors was investigated using a pair of latent variable path analyses (LVPA). The first LVPA tested the predictive power of the second-order factor alone by extending the SSWQ’s higher-order measurement model to predict each of the school-reported criterion variables. The second LVPA directly tested the comparative contribution of the first-order and second-order factor effects by further extending the former LVPA so that each of the actual school outcomes was also regressed onto the residual variance terms of each of the four first-order factors. Within the context of this analysis, direct effects observed from residual variance terms to the criterion variables represented the predictive power of each first-order factor with the contribution of the second-order factor removed (see Reynolds & Keith, 2013). Squared-multiple correlations (R2) were used as the effect size of interest for the LVPA and were also interpreted according to traditional guidelines (see Cohen, 1988). All analyses were conducted using SPSS and Amos version 22.
Results and Discussion
Findings from the higher-order CFA yielded good data–model fit (χ2 = 182.29, df = 100, p < .001, CFI = .959, TLI = .950, RMSEA [90% CI] = .050 [.038, .061]) and showed robust first-order factor loadings (λ range = .50-.77) and indicator reliabilities (ℓ2 range = .25-.59), strong second-order factor loadings (λ range = .65-.96) and indicator reliabilities (ℓ2 range = .42-.92), and adequate-to-strong latent construct reliabilities (JL H = .82, SC H = .80, EP H = .77, AE H = .81, SSW H = .94). These results confirmed the robust psychometric properties of the SSWQ’s measurement model observed in previous studies (Renshaw, 2015; Renshaw & Arslan, 2016; Renshaw et al., 2015) and provided evidence in favor of structural validity, suggesting that it was appropriate to conduct the intended convergent validity analyses as planned. Results from the bivariate correlations yielded a range of negligible-to-small associations for scores derived from the JL, SC, and EP subscales and each of the school-reported outcomes, whereas AE scores demonstrated moderate-to-large associations with the majority of criterion variables (see Table 2). The SSWQ’s composite score showed consistently small correlations with each of the school-reported criterion variables (see Table 2). Taken together, these correlational findings suggest that scores derived from the AE subscale have stronger convergent validity with actual school outcomes than scores derived from the composite scale, and that JL, EP, and SC scores have marginal convergent validity with only select school outcomes.
Bivariate Correlations (r) Between the SSWQ Scale Scores and Criterion Variables.
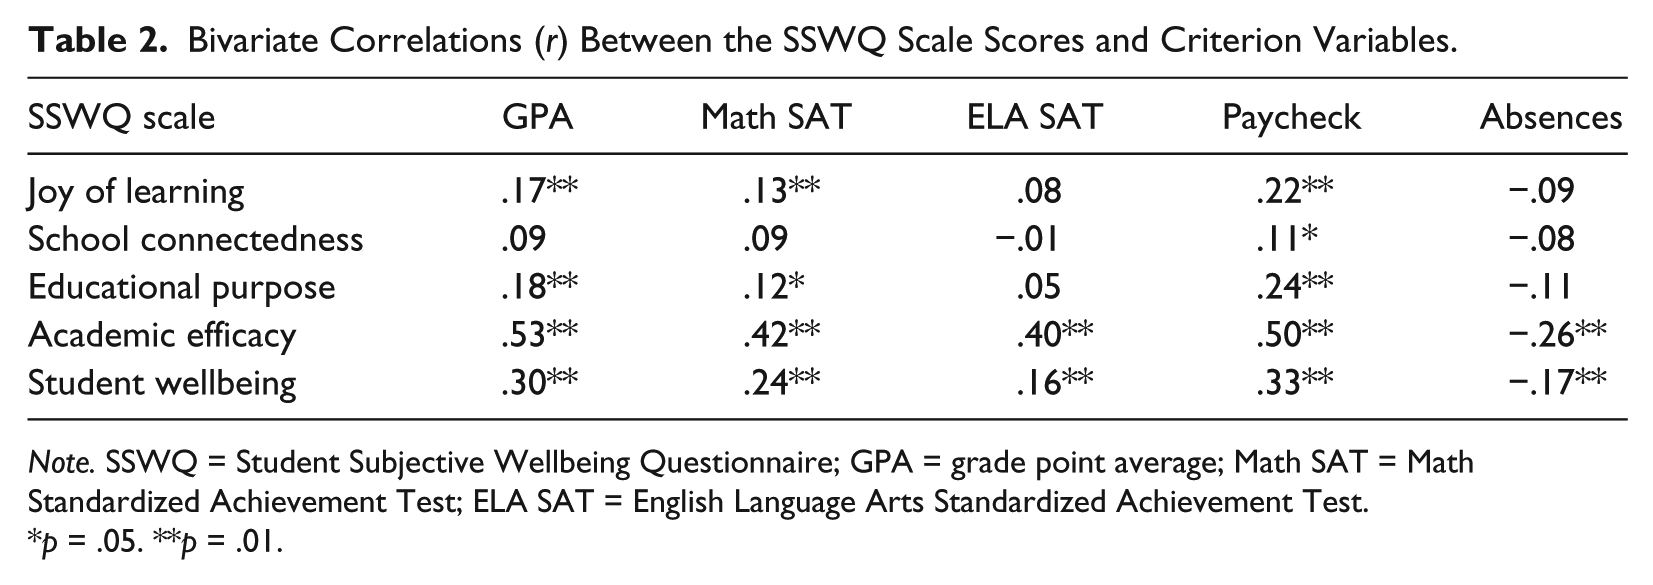
Note. SSWQ = Student Subjective Wellbeing Questionnaire; GPA = grade point average; Math SAT = Math Standardized Achievement Test; ELA SAT = English Language Arts Standardized Achievement Test.
p = .05. **p = .01.
Results from the first LVPA indicated that the SSWQ’s second-order factor was a substantive predictor of each criterion variable (GPA: β = .85, R2 = .73, p < .001; Math SAT: β = .73, R2 = .53, p < .001; ELA SAT: β = .63, R2 = .39, p < .001; Paycheck: β = .72, R2 = .52, p < .001; Absences: β = −.32, R2 = .10, p < .001). Results from the second LVPA, however, indicated much stronger predictive power for each of the school-reported outcomes (GPA ΔR2 = .09, Math SAT ΔR2 = .14, ELA SAT ΔR2 = .22, Paycheck ΔR2 = .12, Absences ΔR2 = .10; see Table 3). Findings from this latter analysis also demonstrated that, with the contribution of the second-order factor removed, AE proved to be the most robust and consistent predictor across all school-reported outcomes, that EP and JL were substantive predictors for a few outcomes, and that SC was not a significant predictor in any case (see Table 3). Taken together, results from the convergent validity analyses have at least two key implications for future research regarding the SSWQ. First, it is apparent that responses to the SSWQ do indeed have substantive relations with actual school outcomes, including key indicators of academic achievement and academic behavior. Further basic science is therefore warranted to replicate, generalize, and extend the nature of the relations among student subjective wellbeing and objective school success observed herein. And, using the argument-based approach to validity (see Kane, 2008), applied research is warranted to test the use of the SSWQ for practical purposes in schools (e.g., screening and progress monitoring). Second, although previous research has assumed that the SSWQ’s second-order factor and composite variable were the best predictor of criterion variables (Renshaw, 2015; Renshaw & Arslan, 2016; Renshaw et al., 2015), the present study demonstrates that one of the first-order factors and subscales—AE—was the most robust predictor. Thus, further basic science is also warranted to replicate, generalize, and extend the nature of this finding across other criterion variables, while applied research is needed to test the differential clinical utility of using scores derived from the measure’s factors in practice.
Comparative Effects of First-Order and Second-Order Factors on Criterion Variables.

Note. SW = student wellbeing; JL = joy of learning; SC = school connectedness; EP = educational purpose; AE = academic efficacy; GPA = grade point average; Math SAT = Math Standardized Achievement Test; ELA SAT = English Language Arts Standardized Achievement Test.
p = .05. **p = .01. ***p = .001.
Footnotes
Declaration of Conflicting Interests
The author(s) declared no potential conflicts of interest with respect to the research, authorship, and/or publication of this article.
Funding
The author(s) received no financial support for the research, authorship, and/or publication of this article.