
Abstract
Given the lack of any Chinese instrument validated for emotional intelligence (EI) among adolescents, the purpose of this study was to explore new sources of validity evidence drawn from scores on the Emotional Quotient Inventory: Youth Version Short (EQ-i: YV-S) in a sample of Chinese adolescents. The sample was composed of 406 adolescents (236 girls). Results support the multidimensionality of the EQ-i: YV-S, but its hierarchical structure did not receive empirical support. Three of the four main subscales (all but interpersonal) had acceptable reliability indices. In addition, although the impact of the Positive Impression subscale on responses to the main scales was generally low, the effect is not ignorable, and its impact should be modeled in further investigations of the EQ-i: YV-S. Finally, four main subscales of EQ-i: YV-S showed significant power in the prediction of general self-concept and moderate temporal stability. The findings provide overall support for the reliability and validity of the Chinese version of EQ-i: YV-S.
Trait emotional intelligence (EI) has received considerable empirical attention over the last decade, especially in Western individualist societies. However, little is known about the construct in Eastern collectivist societies (Gökçen, Furnham, Mavroveli, & Petrides, 2014). The focus of this research was the measurement of EI in the Chinese context among adolescents. EI has relevance to virtually all psychological assessment applications, across clinical (Smith, Saklofske, & Nordstokke, 2014), physical health (Keefer, Parker, & Saklofske, 2009), occupational (Di Fabio & Saklofske, 2014), and educational (Vesely, Saklofske, & Nordstokke, 2014) contexts, being an important determinant of one’s ability to succeed in life and general psychological well-being (Bar-On, 1997; Serrano & Andreu, 2016). High EI is positively associated with greater self-esteem or self-concept in preadolescents (Coelho, Marchante, & Sousa, 2016; Ferrando et al., 2011), adolescents (Ferrándiz, Hernández, Bermejo, Ferrando, & Sáinz, 2012; Rey, Extremera, & Pena, 2011), and undergraduates (Kong, Zhao, & You, 2012; Runcan & Iovu, 2013). Moreover, EI is a good predictor of general self-concept in undergraduates (Kong et al., 2012; Runcan & Iovu, 2013).
Given EI’s importance, it is relevant to understand its place among Chinese adolescents. However, although EI has been a topic of extended study in North America, only a few scales have been validated in other cultures and languages (Li, Saklofske, Bowden, Yan, & Fung, 2012), and in China particularly (Ma, Tsai, Chang, & Lane, 2010; Wong & Law, 2002).
Theoretical Approaches to EI
Two general theoretical approaches have been used to explain EI: ability EI and trait EI. The ability model defines EI as the capability to perceive and express emotion, assimilate emotion in thought, understand and reason with emotion, and regulate emotion in the self and others (Mayer & Salovey, 1997). Ability measures involve the use of performance-based scales, which include emotional items with correct and incorrect answers. These instruments assess relevant aspects of individuals’ perceptions of their emotional competencies (e.g., Mayer Salovey Caruso Emotional Intelligence Test [MSCEIT]; Trait Meta-Mood Scale [TMMS]).
Trait EI is defined as a constellation of emotional self-perceptions located at the lower levels of personality hierarchies (Petrides, Pérez-González, & Furnham, 2007), evaluated using self-report measures, such as the Emotional Quotient Inventory (EQ-i) or the Trait Emotional Intelligence Questionnaire (TEIQue).
The differentiation between trait EI and ability EI has been predicated mainly on measurement scales and not on the elements that the various models are hypothesized to encompass (Siegling, Saklofske, & Petrides, 2015). Correlations between measures of trait EI and ability EI are invariably low, thereby supporting their distinction (Saklofske, Austin, & Minski, 2003). Their literatures are developing independently, such that operationalization of one does not have implications for the other’s operationalization.
With respect to the trait EI model, Bar-On defines Emotional Social Intelligence (ESI) as an interrelated set of competencies, emotional and social skills, and emotional facilitators that determine how effectively we understand and express ourselves, how we understand others and relate to them, and how we face everyday demands. Given that EI is conceptualized as a personality trait, it is assumed to be relatively stable over time like other personality traits (Petrides, Furnham, & Mavroveli, 2007). In a 6-year period study from late childhood to adolescence, Keefer, Holden, and Parker (2013) showed that individual differences in EI became increasingly more stable with age and that changes in mean EI levels followed a complex nonlinear pattern over time.
EI Measures
Measurement of EI in the Chinese context has largely focused on the ability model. Wong and Law (2002) developed an EI measurement, the Wong Law Emotional Intelligence Scale (WLEIS), to measure EI along four dimensions: self-emotion appraisals, others’ emotion appraisals, regulation of emotion, and use of emotion. The WLEIS has good psychometric properties in undergraduate and employee samples (Shi & Wang, 2007; Wong & Law, 2002). Studies conducted in Hong Kong (Law, Wong, & Song, 2004), Japan (Fukuda et al., 2011), and Korea (Fukuda, Saklofske, Tamaoka, & Lim, 2012) have supported its factor structure. Its reliability, factor structure, and metric invariance have been demonstrated for university students from Canada and China (Li et al., 2012). Similarly using the ability model, Ma et al. (2010) developed the Chinese version of the MSCEIT, providing evidence for its stability, internal consistency, criterion validity, and cross-sample validity with adults. With respect to the trait model, although the Chinese adolescent short form of the Trait Emotional Intelligence Questionnaire (TEIQue-ASF) is available (www.psychometriclab.com), it has not been validated.
For the evaluation of ESI, Bar-On developed the EQ-i (Bar-On, 1997) for individuals older than 17. Its reliability has been established across multiple studies (Bar-On, 2004; Petrides & Furnham, 2001). However, the factor analysis has yielded contradictory findings, with some finding the scale to be unidimensional (Dawda & Hart, 2000; Palmer, Manocha, Gignac, & Stough, 2003; Petrides & Furnham, 2001), with others finding it to be multidimensional (Austin, Saklofske, & Egan, 2005; Bar-On, 1997).
For children and adolescents between the ages of 7 and 18 years old, Bar-On and Parker (2000) developed the shorter Emotional Quotient Inventory (EQ-i: YV), consisting of 60 items with Cronbach alpha coefficients ranging from .65 to .90. This version has good psychometric properties, replicating the original factor structure in Canada (Parker et al., 2005), Lebanon (Hassan & Sader, 2005), Peru (Ugarriza & Pajares, 2005), and Spain (Ferrándiz et al., 2012).
Likewise, Bar-On and Parker (2000) developed the Bar-On Emotional Quotient Inventory: Youth Version Short (EQ-i: YV-S), a shortened version of the questionnaire for children and adolescents, consisting of 30 items, with acceptable reliability (ranging from .65 to .90). This short version was validated in Peru (Ugarriza & Pajares, 2005), Hungary (Kun et al., 2012), and Spain (Esnaola, Freeman, Sarasa, Fernández-Zabala, & Axpe, 2016), with the factor structure confirmed.
The Present Study
The rationale for this study is based on two premises. First, the EI questionnaires that have been developed in the Chinese context are based on the ability model and have been focused on undergraduates or employees. There is a need for a validated Chinese EI instrument for adolescents based on trait EI, given the distinctions between ability and trait EI. Second, as China’s population is the largest in the world, carrying out studies in China can contribute to the knowledge of EI in non-Western countries. For researchers and teachers to understand adolescents’ EI, they need fast and easy-to-administer validated questionnaires to reveal different components of EI.
The purpose of this study was to explore new sources of validity evidence drawn from scores on the EQ-i: YV-S in a sample of Chinese adolescents. The main objectives were to investigate (a) construct validity through analyzing its dimensionality and internal structure by comparing two models (a four correlated first-order factors model and a hierarchical model), (b) social desirability through examining correlations between participants’ answers to the items and one specific measure of social desirability, and (c) predictive validity and longitudinal stability evidence, based on the relationship of scores on the EQ-i: YV-S subscales with general self-concept and analysis of the longitudinal behavior of latent means between two applications over 1 school year.
Method
Participants
This research was conducted in a large-scale high school in China with more than 2,000 students from varying socioeconomic backgrounds across the province where this high school is located. The 406 participants in this study included 170 males (41.9%) and 236 females (58.1%). The same sample was collected twice, at the beginning (Mage = 15.94, SD = .72) and at the end of the school year (Mage = 16.61, SD = .72). The participants were distributed across eight classrooms, with a range of students between 44 and 68 in these classrooms (average = 50.7, median = 49.5, SD = 11.2).
Measures
The EQ-i: YV-S (Bar-On & Parker, 2000) is a self-report measure designed to measure EI of children and adolescents (7-18). It consists of 30 items measuring the dimensions of interpersonal, intrapersonal, stress management, adaptability, and positive impression (PI); with the sum of the first four main factors, a score of overall EI can be obtained. The PI subscale was created to measure how much the participants distort their responses in terms of the effect of social desirability. The questionnaire is answered on a Likert-type scale with four response options going from not true in my case to very true in my case.
The Self-Description Questionnaire II-S (SDQII-S; Ellis, Marsh, & Richards, 2002; Chinese translation: Hau, Kong, & Marsh, 2003) is a reduced self-report measure (51 items) from the original version designed to assess self-concept in adolescents aged 12 to 18 years. It consists of the original 11 scales (this article only uses the general self-concept scale); each item has six response options (1 = false; 6 = true).
Procedure
Data were collected twice within 1 school year. The first stage of data collection was at the beginning of the school year (Time 1) and the second at the end of the school year (Time 2). Questionnaires were distributed to two cohorts of students who were enrolled at the beginning of the study in the 10th and 11th grades (in China referred to as first and second grades in senior high). Standard back translation processes were used to promote linguistic equivalence (Brislin, 1986).
Data Analyses
Three steps were carried out to meet the study’s objectives:
Step 1: Dimensionality and internal structure of EQ-i: YV-S
In this first step, the dimensionality and internal structure of EQ-i: YV-S were explored comparing two models using the sample collected at Time 1: four correlated first-order factors model (M1) and a bifactor model with a general factor of EI and four specific factors (M2; interpersonal, intrapersonal, stress management, and adaptability; see Figure 1). The bifactor model (Reise, 2012) consists of a general factor (G) and j specific factors (S). G and S factors are orthogonal, that is, the correlations between them are forced to zero. Unlike second-order models, where the influence of G in the item is completely mediated by specific factors (Yung, Thissen, & McLeod, 1999), the bifactor model explores the direct effect of G on each indicator, giving an easier interpretation of the common variance captured by each dimension.
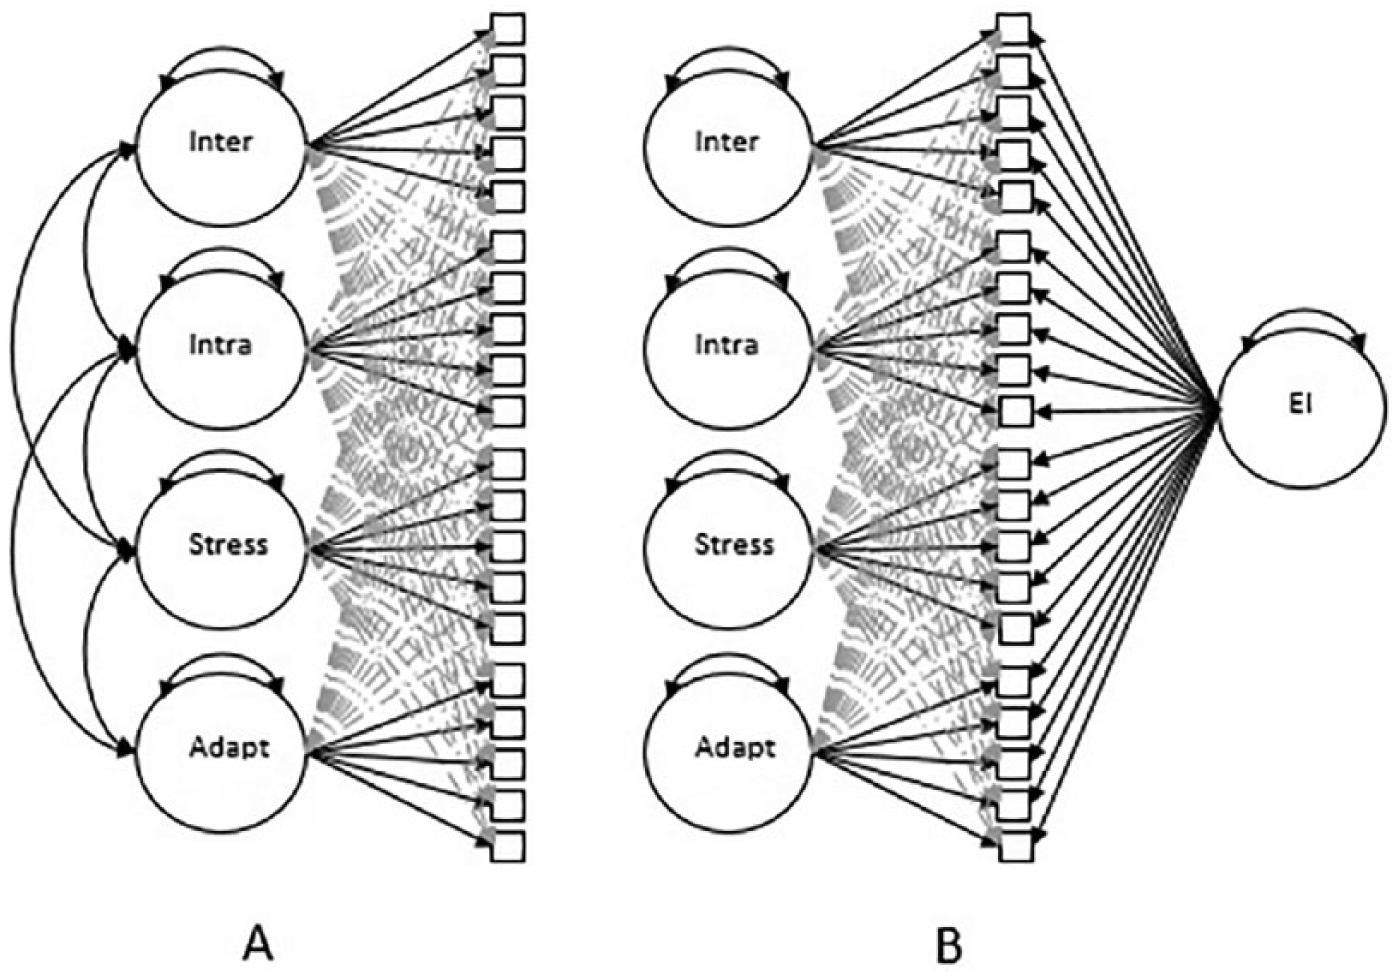
Conceptual representations of ESEM oblique model (M1) and bifactor model (M2).
Exploratory Structural Equation Modeling (ESEM; Asparouhov & Muthén, 2009) was used. The ESEM approach combines the flexibility of Exploratory Factor Analysis (EFA) with the critical advantages of Confirmatory Factor Analysis (CFA), such as the assessment of fit indices, local sources of misfit, and discriminant validity at item level (magnitude of the primary loadings in contrast to the cross-loadings). The decision to use an ESEM approach was based on the potential limitations of the basic independent clusters model of Confirmatory Factor Analysis (ICM-CFA) to represent certain complex psychological constructs properly (Asparouhov & Muthén, 2009; Morin, Arens, & Marsh, 2016).
To estimate ESEM models, TARGET rotation was used, oblique in M1 and bifactor orthogonal (Jennrich & Bentler, 2012) in M2. Target rotation facilitates the rotated solution that is most similar to a pre-specified pattern of loadings. This way, target rotation allows a priori hypotheses about the configuration of the factor loadings, enabling the use of ESEM in a confirmatory way (Asparouhov & Muthén, 2009).
The evaluation of the models was performed based on two sets of indicators: fit indices and model parameters (loadings, cross-loadings, and factor correlations). With respect to model parameters, both the statistical significance and absolute size of the standardized loadings and cross-loadings (loadings > .30 and cross-loadings > .20) were considered. To estimate reliability, the coefficient omega (McDonald, 1999) was calculated for M1 and the omega hierarchical (Brunner, Nagy, & Wilhelm, 2012; Zinbarg, Yovel, Revelle, & McDonald, 2006) and omega subscale (Reise, 2012) for M2. These indices quantify the degree to which the scores accurately reflect the position of the subject in the latent variable (values above .70 ensure the psychometric interpretability of the scores).
Step 2: Assessing the impact of social desirability
In this step, Multiple Indicators-Multiple Causes (MIMIC; Jöreskog & Goldberger, 1975) models were used.
Figure 2 is a conceptual representation of the three MIMIC models. In the M3 model (Figure 2A), each factor is influenced by an observable variable created from the latent scores of PI for each participant. M3 assumes that PI influences the latent scores of the EQ-i: YV-S main dimensions, but not participants’ responses to individual items. In the M4 model, shown in Figure 2B, the direct influence of PI on all items is allowed. Finally, the M5 model sets relationships between PI and the rest of the model to zero (M5 hypothesizes that there is no impact of PI on EI).

Conceptual representations of MIMIC models.
Once the three models were estimated, we performed the following comparisons, according to the procedure described in Morin et al. (2016). First, M5 was compared with M3 and M4. As M3 and M4 are more complex than M5, they should fit better. However, if M5 does not fit substantially worse than the others, one would not reject the hypothesis that PI has negligible influence on the measurement of EI. Then, we compared M3 with M4. If M3 does not fit substantially worse than M4, the impact of PI could be explained by the differences in the latent scores of the EI factors. Conversely, if M4 fits substantially better than M3, possibly certain items would be at risk of differential functioning, due to widespread contamination by PI.
Step 3: Temporal stability and predictive validity
In the third step, evidence of predictive validity (using general self-concept as a criterion) and temporal stability (evaluating EQ-i: YV-S main factors’ longitudinal behavior) were explored with the sample collected at Time 2.
For the investigation of the longitudinal stability with respect to the ranking of participants in the distribution of latent variables, an ESEM model (M6, see Figure 3) was specified following Marsh and Grayson’s (1994) recommendations, in which (a) the four main factors of EQ-i: YV-S measured at Time 1 were regressed to the same factors measured at Time 2; and (b) the uniqueness of the same items was allowed to correlate. To assess the predictive validity of EQ-i: YV-S main factors, a measure of self-concept was included at Time 1, which received regression paths from each EI factor. Given the results of Step 1, in the measurement model of EI in M6, items 1 and 18 belonging to the interpersonal subscale were eliminated.
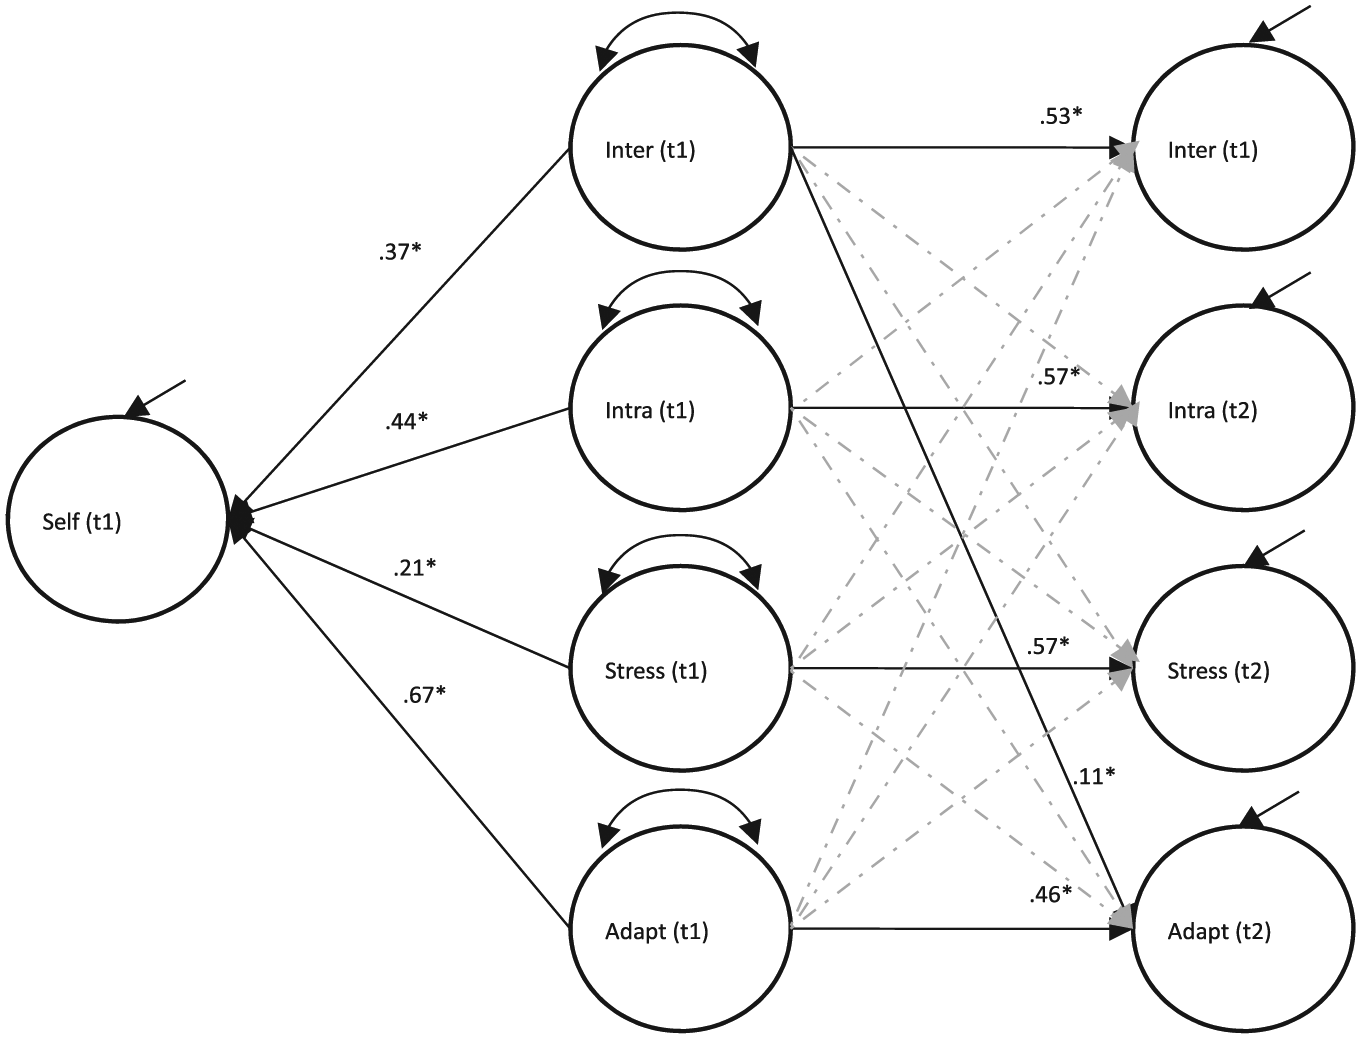
ESEM model of longitudinal stability and predictive validity.
Additional information
Weighted Least Squares Means and Variances adjusted (WLSMV) was used as the estimation method, given the ordinal nature of the raw data and the robustness of the method for multivariate normality violations (Rhemtulla, Brosseau-Liard, & Savalei, 2012). To evaluate the fit of the models, the Comparative Fit Index (CFI), the Tucker–Lewis Index (TLI), and the root mean square error of approximation (RMSEA) were considered. For CFI and TLI, values above .90 and .95 indicate degrees of acceptable and good fit respectively (Hu & Bentler, 1999). For RMSEA, values equal to or less than .05 and .08 are considered good and acceptable, respectively (Hu & Bentler, 1999). To determine the relevance of the differences in fit between nested MIMIC models, the chi-square difference test for WLSMV estimation was made. All analyses were performed using MPlus v. 7.3 (Muthén & Muthén, 1998-2014). For the estimation of measurement models, the nonindependence of observations among children in the same classroom was taken into account (i.e., TYPE = COMPLEX Within MPLUS).
Results
Step 1
Both M1 and M2 showed indices above the acceptable level (Table 1). M2 did not produce a substantially better fit than M1.
Fit of the Estimated Models.
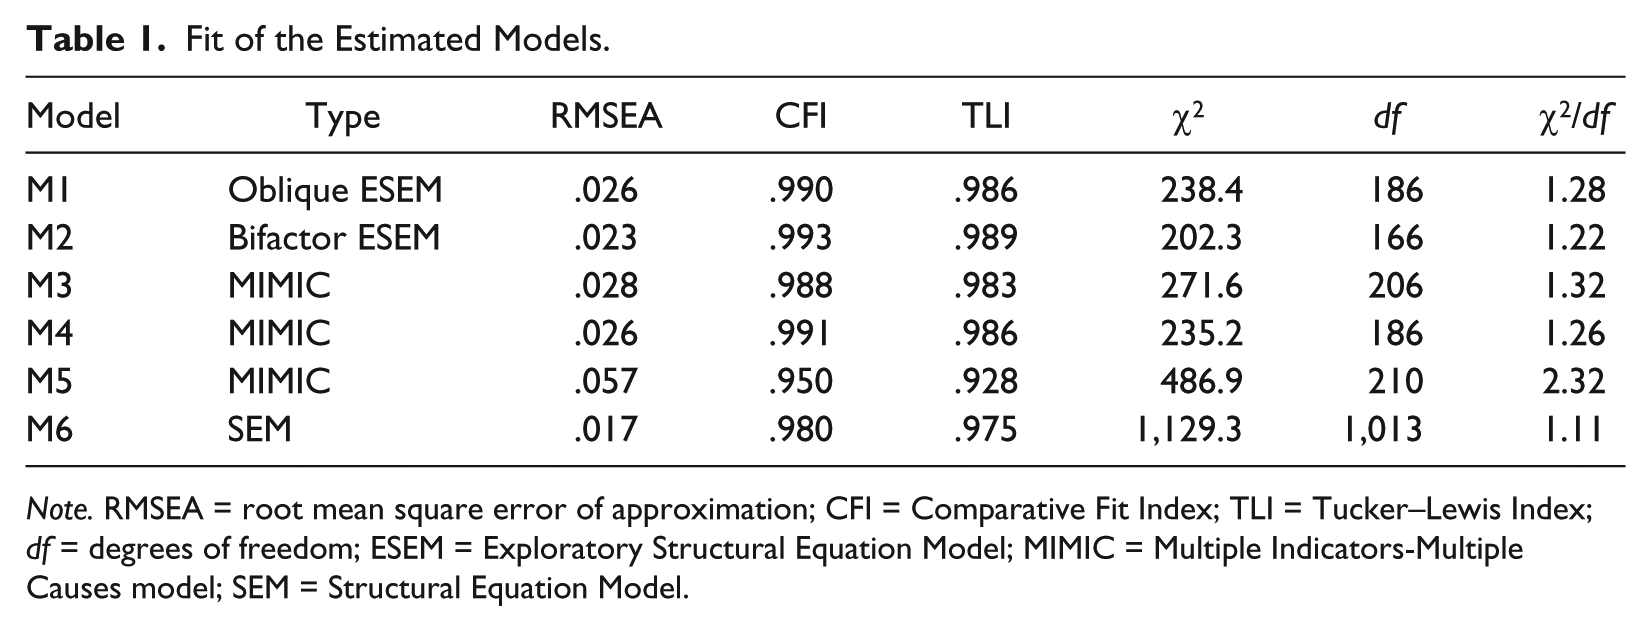
Note. RMSEA = root mean square error of approximation; CFI = Comparative Fit Index; TLI = Tucker–Lewis Index; df = degrees of freedom; ESEM = Exploratory Structural Equation Model; MIMIC = Multiple Indicators-Multiple Causes model; SEM = Structural Equation Model.
Table 2 contains the parameters obtained from M4 (M4 is identical to M1, but accounting for social desirability, see Figure 2B). The primary loadings were greater than .30 in all cases, except for the interpersonal factor, where two items (1 and 18) failed to capture substantive variance in their theoretical factor. Cross-loadings were generally low in contrast to primary loadings, explaining a negligible amount of total variance in the model (2.3%). The model-based omega reliability was acceptable for intrapersonal (.88), stress management (.81) and adaptability (.84) factors, but poor for interpersonal (.63). Correlations between factors were low and mostly nonsignificant (range = .07-.24). Regarding the bifactor model, general factor loadings were generally low (range = .009-.53, absolute M = 0.15, SD = 0.12; factor loadings are available upon request).
ESEM Parameter Estimates From Model 4.
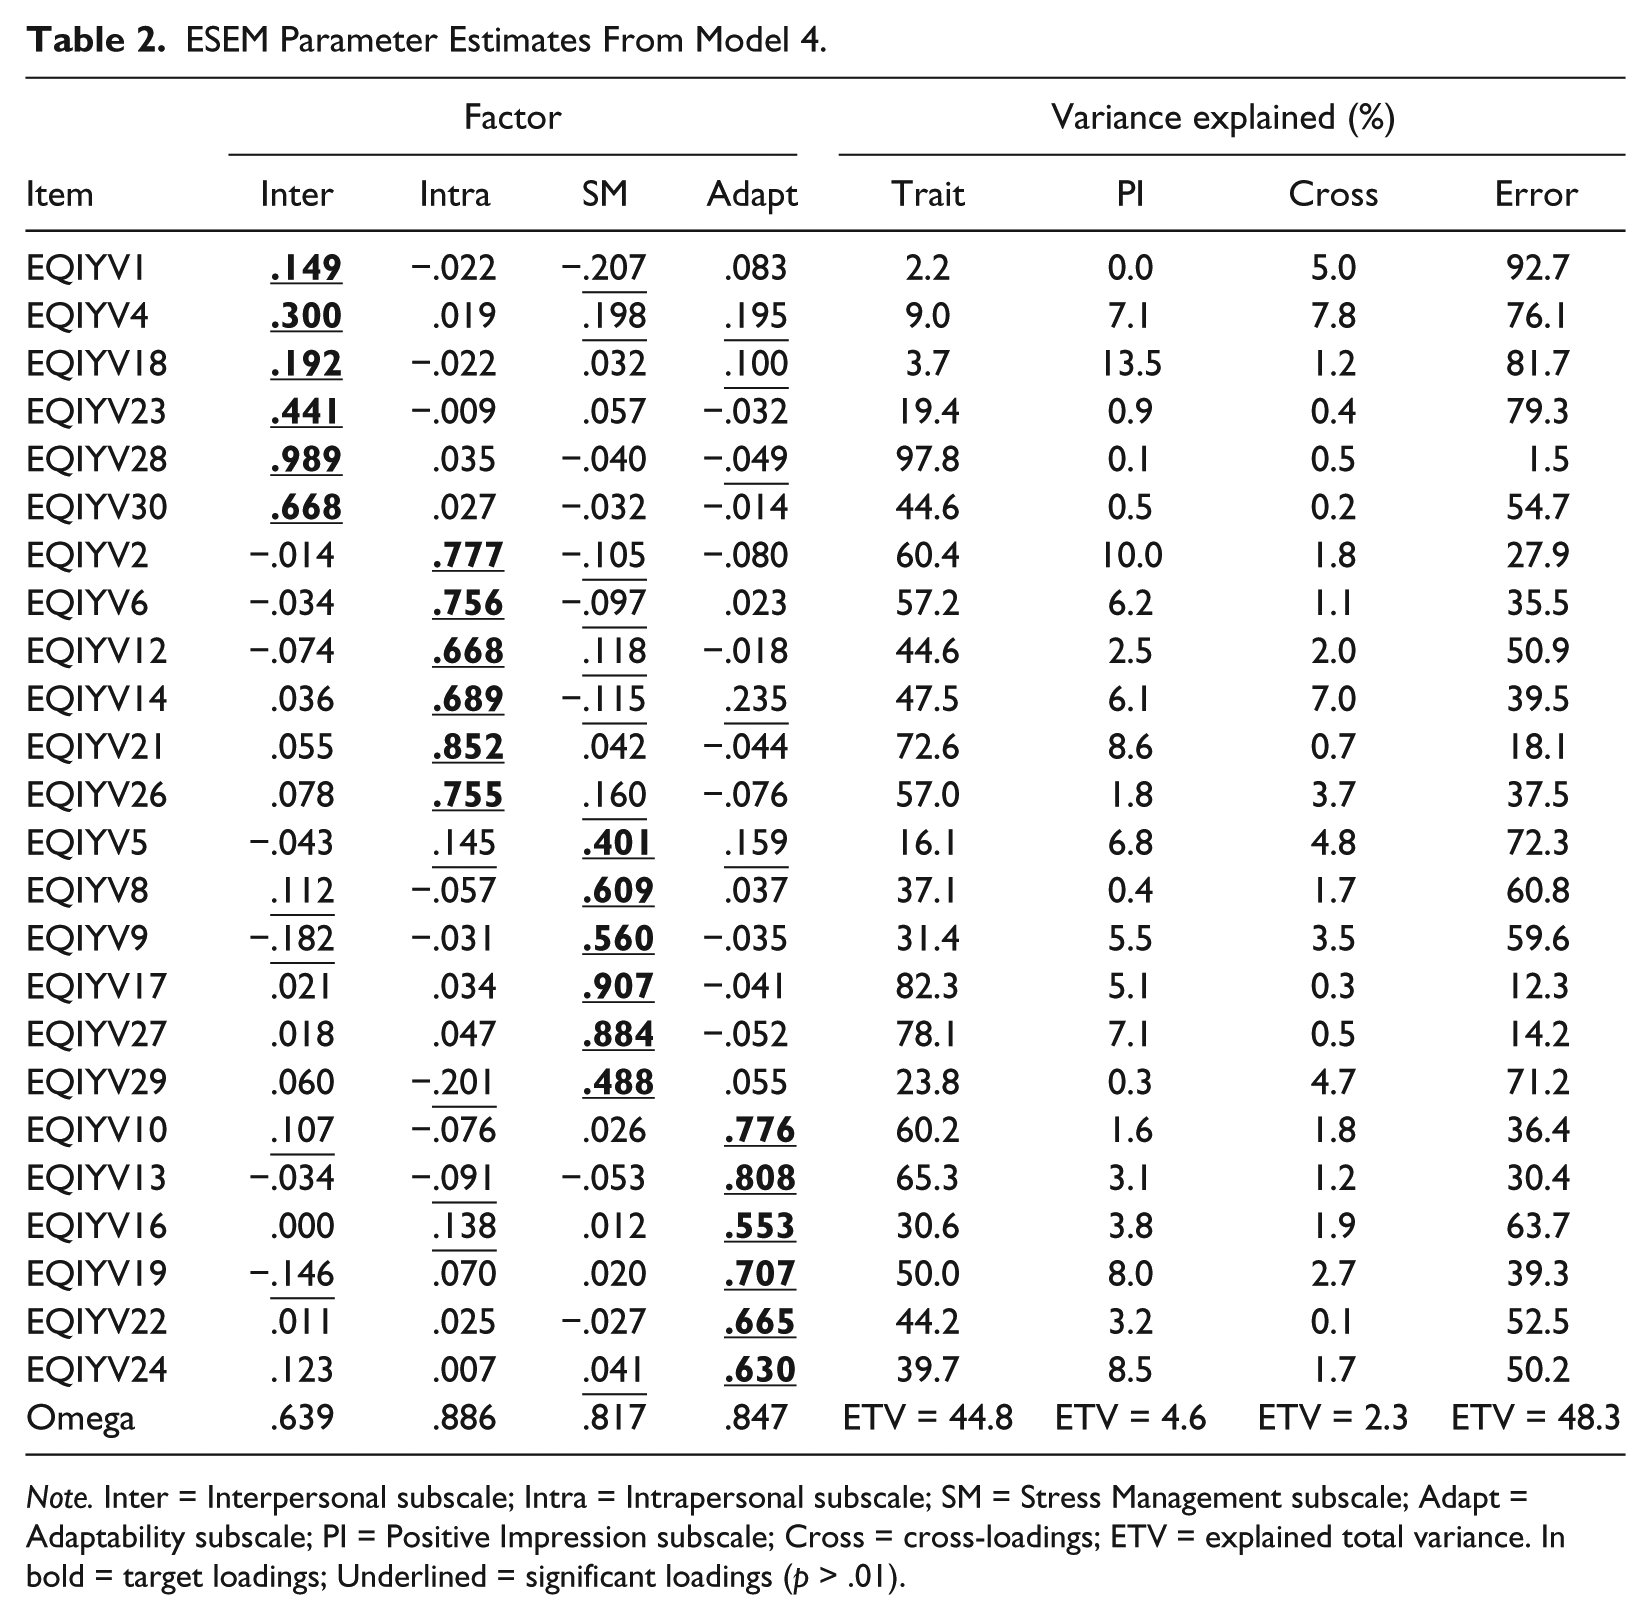
Note. Inter = Interpersonal subscale; Intra = Intrapersonal subscale; SM = Stress Management subscale; Adapt = Adaptability subscale; PI = Positive Impression subscale; Cross = cross-loadings; ETV = explained total variance. In bold = target loadings; Underlined = significant loadings (p > .01).
Step 2
The observable variable in Figures 2a to 2c represents the latent scores on the PI dimension. These scores were extracted by CFA from this subscale’s one-dimensional model (RMSEA = .053, CFI = .981; TLI = .961; omega = .93). Regarding the MIMIC models (Table 1), M5 showed an acceptable fit, but a substantially worse fit than M3 (chi-square difference = 177, df difference = 4, p < .01) and M4 (chi-square difference = 324, df difference = 24; p < .01). This finding suggests the need to investigate the impact of PI on responses to the main scales. In M4 (Table 2), PI explains a proportion of variance in the items ranging from 0.01% to 13.5%, with 4.6% of total variance explained. Although some items were particularly influenced by desirability (more than 10% of total variance due to PI in items 2 and 18), generally the variance captured by EI traits was substantially greater than the variance explained by PI.
Step 3
The Structural Equation Model (M6) fit was acceptable (Table 1). Factors showed distinct predictive capacity (the following lines report the standardized regression paths): adaptability being the best predictor of general self-concept (.67) and stress management the poorest (.21). EQ-i: YV-S main factors showed moderate temporal stability, with paths ranging between .46 and .57 (Figure 3). Paths from each factor in Time 1 to different factors in Time 2 were statistically nonsignificant, with the exception of interpersonal to adaptability (.11).
Discussion
The main purpose of the present study was to explore new sources of validity and reliability evidence drawn from scores on the EQ-i: YV-S in a sample of Chinese adolescents. In addition, there were three specific objectives for the study.
The first objective was to examine the construct validity of the EQ-i: YV-S through analyzing its dimensionality and internal structure by comparing two models (a four correlated first-order factors model and a hierarchical model). The four correlated first-order factors model provided the best fit to the data. This result suggests that the EQ-i: YV-S is a multifactorial array of interrelated emotional and social competencies, skills, and facilitators (Bar-On & Parker, 2000) for these Chinese adolescents, thereby agreeing with most previous research across diverse populations (Bar-On & Parker, 2000; Esnaola et al., 2016; Ugarriza & Pajares, 2005).
The hierarchical structure of the EQ-i: YV-S did not receive empirical support. In the bifactor model, the loadings on the general factor were low. This result, together with the low correlations between observed factors in the first-order model, suggests that the dimensions of EQ-i: YV-S can be clearly distinguishable empirically, replicating previous research (Kun et al., 2012). However, the interpersonal subscale did not work well. Two items presented unacceptable factor loadings, resulting in subscale reliability indices lower than desirable. This result should be replicated before making decisions; since the validity of some EQ-i: YV-S items has been questioned previously (Kun et al., 2012), some indicators may need to be reformulated to ensure the validity and replicability of the measure.
Second, the impact of social desirability on the participants’ responses to the items was investigated. Although the impact of PI was generally low, including PI in the model greatly improved fit. Thus, the effect of PI was not ignorable; its impact should be modeled in further investigations of the EQ-i: YV-S. Future studies about how the impact of PI may vary in relation to the application context, culture, or individual characteristics of the respondents are warranted.
The third objective was to extend predictive validity evidence based on the relationships of scores on the EQ-i: YV-S with general self-concept and on the temporal stability of the EQ-i: YV-S. As found previously (Kong et al., 2012; Runcan & Iovu, 2013), EI subscales showed significant predictive power for general self-concept though structural equation modeling. Regarding the longitudinal study, the four main factors of the EQ-i: YV-S showed moderate temporal stability, similar to previous research (Keefer et al., 2013; Petrides et al., 2007).
Limitations and Future Research
This study has three primary limitations. First, as the Chinese population is vast and this is the first study analyzing the psychometric properties of the Chinese version of EQ-i: YV-S, further studies are needed in different regions of the country. Second, the reliability indices of the interpersonal scale were inadequate, so further investigation should clarify its reliability. Third, to accumulate further validity evidence for scores on the EQ-i: YV-S, future research should examine factorial invariance using multigroup confirmatory factor analysis from structural equation modeling and other recent methodological strategies, such as ESEM. However, while this study has limitations, its findings make an important contribution to the field by providing overall support for the reliability and validity of scores on the EQ-i: YV-S with Chinese adolescents.
Footnotes
Authors’ Note
This research is part of work carried out within the Consolidated Research Group of the Basque University System IT934-16. It presents results of the research project EHUA15/15 of the University of the Basque Country (UPV/EHU).
Declaration of Conflicting Interests
The author(s) declared no potential conflicts of interest with respect to the research, authorship, and/or publication of this article.
Funding
The author(s) disclosed receipt of the following financial support for the research, authorship, and/or publication of this article: Financial support for the project is provided by the Universidad del País Vasco/Euskal Herriko Unibertsitatea (UPV/EHU, Spain).