
Abstract
A total of 248 students from one Southeastern U.S. middle school responded to measures of global and domain-based life satisfaction on three occasions, reflecting 5-month, 7-month, and 1-year time intervals. Alpha coefficients were all above .80 for each global and domain-based score on each occasion. The test–retest coefficients were variable, underscoring the importance of contextual factors in life satisfaction reports. Nevertheless, with the exception of the Friends domain, the retest coefficients for the global and domain-based scores all exceeded .50 across all three intervals, suggesting a moderate degree of stability yet potential sensitivity to changing life circumstances.
The World Health Organization (WHO; 1948) has defined health as “a state of complete physical, mental, and social well-being and not merely the absence of disease or infirmity” (p. 100). The field of positive psychology reflects this definition by studying the presence of positive qualities within individuals’ lives as well as negative ones. To monitor the presence of these qualities, measures have been developed to assess a variety of constructs, including life satisfaction (LS). LS has been conceptualized as a cognitive evaluation of the quality of one’s life as a whole and/or with specific life domains, such as family, school, and community (Diener, 2000). LS judgments have been shown to be important because they predict a variety of important outcomes, including mental and physical health, satisfying interpersonal relationships, and vocational and educational success in adults as well as children and adolescents (for reviews, see Huebner, Hills, Siddall, & Gilman, 2014; Lyubomirsky, King, & Diener, 2005).
Given the increasing interest in positive psychology (Furlong, Gilman, & Huebner, 2014), there is a need for reliable and valid measures of relevant constructs, such as LS. Although studies of LS and its measurement in adults are numerous, studies with children and adolescents remain relatively sparse (see Pavot & Diener, 2008). The extant research on the measurement of LS in children and adolescents has been summarized by several authors, including Proctor, Linley, and Maltby (2009a). Such reviews have identified several promising measures of LS that are appropriate for youth, especially the Students’ Life Satisfaction Scale (SLSS; Huebner, 1991) and the Multidimensional Students’ Life Satisfaction Scale (MSLSS; Huebner, 1994).
The SLSS was created to measure the overall or global LS of students who are in Grades 3 through 12 (Huebner, 1991). The SLSS has been used in a number of studies with various samples including elementary (e.g., Huebner, 1991) and secondary schoolchildren (e.g., Dew & Huebner, 1994; McKnight, Huebner, & Suldo, 2002) from various areas of the United States and elsewhere. Factor analyses have supported a one-factor structure (Huebner, 1991; Weber, Ruch, & Huebner, 2012).
The internal consistency of the SLSS has been investigated in numerous studies. For example, Dew and Huebner (1994) found an alpha of .86 in their sample of students in Grades 9 through 12. Huebner (1991) found an alpha of .82 in a sample of students in Grades 4 through 8. Alpha coefficients of .86 and .75 have also been reported for samples of middle school students with giftedness (Ash & Huebner, 1998) and middle school students with serious emotional difficulties (Griffin & Huebner, 2000), respectively.
Studies of test–retest reliability of the SLSS have also been conducted, but these have not been as extensive as the studies of internal consistency. In the extant literature, Huebner (1991) reported a test–retest coefficient of .74 across a 1- to 2-week interval with students in Grades 4 through 6. Using a sample of students in Grades 3 through 5, Terry and Huebner (1995) reported a test–retest coefficient of .76, also across a 1- to 2-week time interval. Another report of the SLSS stability coefficients using a 1-month span of time yielded a stability coefficient of .64 (Gilman & Huebner, 1997). Furthermore, Weber et al. (2012) reported a stability coefficient of .55 for a German version of the SLSS over a 4-month period of time with a sample of German-speaking Swiss students aged 12 through 17 years. Finally, Huebner, Funk, and Gilman (2000) reported a 1-year test–retest coefficient of .52 with a group of high school students.
The MSLSS was developed to measure domain-specific LS in students in Grades 3 through 12 (Huebner, 1994). The MSLSS specifically addresses the five domains of family, friends, self, school, and living environment. Factor analyses have supported a five-factor structure (Huebner, 1994; Huebner, Laughlin, Ash, & Gilman, 1998; Zappulla, Pace, Lo Cascio, Guzzo, & Huebner, 2014).
The internal consistency of the MSLSS scores has been reported in multiple studies (Greenspoon & Saklofske, 1997; Haranin, Huebner, & Suldo, 2007; Huebner & Gilman, 2002). For example, Haranin et al. (2007) reported a range of alpha coefficients from .77 to .87 across MSLSS subscales among students in Grades 6 to 12. Antaramian and Huebner (2009) reported alphas ranging from .76 to .95 for a sample of middle school students. In addition, Brantley, Huebner, and Nagle (2002) obtained coefficient alphas ranging from .63 to .83 with a sample of adolescents with mild mental disabilities and alphas ranging from .73 to .92 with a sample of typically achieving adolescents.
Three studies in the extant literature have explored the test–retest reliability of the MSLSS. Two studies examined the test–retest reliability of the MSLSS over a period of 4 weeks. Greenspoon and Saklofske (1997) investigated the use of the MSLSS with Canadian students in Grades 3 through 8, yielding 4-week test–retest correlations ranging from .59 (School) to .78 (Self). Huebner et al. (1998) reported similar results with a group of students in Grades 6 through 8, with 4-week retest coefficients ranging from .53 (Self) to .81 (Living Environment). Furthermore, Antaramian and Huebner (2009) reported test–retest reliability coefficients for time spans of both 1 year and 2 years with students in Grades 8 through 10. The 1-year test–retest coefficients ranged from .27 (Friends) to .59 (School), with a median coefficient of r = .49. The 2-year coefficients ranged from .41 (Environment) to .53 (Self), with a median coefficient of r = .46.
In a study with Canadian youth, Sawatzky, Ratner, Johnson, Kopec, and Zumbo (2009) found interpretability problems with the 10 reverse-key items of the MSLSS. Given that previous research has suggested that some children and early adolescents have difficulty understanding reverse-key items (Marsh, 1986), a modified version of the MSLSS was developed in which the 10 reverse-keyed items were excluded (Huebner, Zullig, & Saha, 2012). Support for the five-factor structure has been provided for this abbreviated version of the MSLSS (Huebner et al., 2012), with one study demonstrating better fit for the abbreviated version compared with the original, lengthier version of the MSLSS (Zappulla et al., 2014). Studies of the reliability of the abbreviated MSLSS have been sparse. No studies have addressed its test–retest reliability, and only two studies have addressed its internal consistency. Huebner et al. (2012) reported internal consistency coefficients ranging from .71 to .91for the abbreviated MSLSS domain-based scores with a sample of U.S. middle school students, whereas Zappulla, Pace, Lo Casci, Guzzo, and Huebner (2014) reported comparable internal consistency coefficients for the abbreviated MSLSS, that is, ranging from .71 to .94, with a sample of Italian adolescent students of ages 14 to 19 years.
As a necessary albeit not sufficient condition for validity, a basic assumption of scores on psychological measurement instruments is that they are reliable, that is, the scores display consistency across items and time. For self-report measures, judgments about reliability are based on whether differing items within the measure converge with each other (internal consistency reliability) and whether scores on the measure remain comparable over time when conditions are not changing (test–retest reliability). Determination of the adequacy of reliability coefficients remains a challenging, unresolved issue and depends upon the assessment context as well as the nature of the relevant psychological construct (Haynes, Smith, & Hunsley, 2011). LS has been conceptualized as a cognitive judgment comprising both trait-like and state-like components, meaning that it reflects some stability (i.e., more than a momentary or short-term mood state or cognitive judgment), but it is also sensitive to changing life circumstances, such as those due to planned (e.g., psychosocial interventions) or unplanned (e.g., parental divorce) events over the life course (Pavot & Diener, 1993). Given such a conceptualization, it seems reasonable to expect that scores on LS measures for adolescents would display internal consistency and test–retest estimates (over a few months) of .70 or above to be considered adequate, with the retest coefficients representing a lower bound of reliability due to the fact that changes in scores can reflect actual changes in life circumstances (Haynes et al., 2011). Lower estimates of stability would be expected for intervals beyond a few months.
To date, the SLSS and MSLSS (and to a lesser extent the abbreviated MSLSS) have generally shown adequate internal consistency coefficients and meaningful test–retest reliability estimates across various lengths of time and across various samples. Even so, additional research is warranted to elucidate the properties of these measures more fully, especially with respect to the assessment of stability with adolescents, who show many biopsychosocial differences compared to adults (Steinberg, 2008). Although some studies of test–retest reliability have been conducted with adolescents, most have focused on relatively short periods of time. Investigations of stability of responses across lengthier time periods are needed to illuminate further the sensitivity to varying life circumstances of measures of global and domain-based LS in children and adolescents.
We thus addressed the reliability of the SLSS and abbreviated version of the MSLSS when assessed on three occasions over a 1-year time period. Specifically, we addressed the following research questions.
Research has suggested declines in global and/or domain-specific LS among some groups of early adolescents (see Proctor, Linley, & Maltby, 2009b for a review). However, the extant research has not examined the longer term stability (i.e., more than 1 month) of the SLSS or the abbreviated MSLSS with this age group. Thus, we particularly added to the existing literature by extending the study of the longer term reliability of these LS measures to early adolescents in the United States in middle school.
Method
Participants
Data were collected at a middle school in a suburban school district in the Southeastern United States as part of a multi-semester, schoolwide monitoring of school climate, student engagement, and well-being conducted by the school administration. The data have been used in previous studies (e.g., Antaramian, Huebner, Hills, & Valois, 2010), but these analyses are new. Data analysis excluded participants who were absent for one or more of the three surveys. The final sample consisted of 248 students. Participants (53% male and 47% female) included students who were in seventh grade during Time 1 and Time 2 and in eighth grade during Time 3. The mean ages were 12.14 years (SD = .38), 12.53 years (SD = .55), and 13.18 years (SD = .43) at Times 1, 2, and 3, respectively. Sixty-one percent of the students were Caucasian, 30% were African American, 2% were Asian American or Pacific Islander, and 7% were of other racial heritage. As an estimate of socioeconomic status (SES), students indicated whether they paid for lunch or received free or reduced price lunches. A total of 20% of the students in the sample reported free or reduced lunch status (i.e., lower SES).
Procedures
Approval for the study was obtained from the local school district and the referent university’s institutional research board. Parent consent was obtained prior to their children’s participation in the survey. All students who were enrolled in the middle school were eligible to participate, and all but 11 students participated on the first occasion. Participants completed the survey in a regular classroom setting during one 30-min session in October, followed by another session in March, and another session in October 1 year later. The survey was administered by classroom teachers, and the data were compiled by school district personnel. All identifying information was removed from the database prior to its receipt by the researchers.
Measures
Global LS
Global LS was assessed using the seven-item SLSS (Huebner, 1991). Participants rated their agreement for each item on a 6-point Likert-type scale, ranging from 1 = strongly disagree to 6 = strongly agree. An example item was “My life is going well.” Total LS scores were calculated by summing the scores on the seven items and dividing by seven. Two items were reverse scored. Summaries of the evidence for the measure’s psychometric properties can be found in Huebner and Hills (2013) and Proctor, Linley, and Maltby (2009a).
Domain-based LS
Domain-based LS was assessed using the abbreviated, 30-item version of the MSLSS (Huebner et al., 2012). The domains included family, friends, school, living environment, and self. Participants rated their agreement for each item on a 6-point Likert-type scale, ranging from 1 = strongly disagree to 6 = strongly agree. Example items were as follows: “I enjoy school activities” (School), “My parents and I do fun things together” (Family), “I have enough friends” (Friends), “I like myself” (Self), and “I like my neighborhood” (Living Environment). Domain-based scores were calculated by summing the scores on each item of the respective domain and dividing by the number of items. Summaries of its psychometric properties can be found in Huebner and Hills (2013) and Proctor, Linley, and Maltby (2009a).
Varying amounts of missing data existed in the three waves of data, accounting for a total of 3.88% of the final sample. Based on the low percentage of data that were missing (Buhi, Goodson, & Neilands, 2008), missing data were managed using listwise deletion in IBM SPSS Statistics for Windows, Version 22.0 (2013).
Results
Alpha coefficient was calculated for the SLSS and abbreviated MSLSS for all 3 time points. All alphas exceeded .80 for the SLSS and the MSLSS scores (all p < .05). Specifically, the alphas for the SLSS were .83, .87, and .84 for Time 1, Time 2, and Time 3 respectively. For the MSLSS, for Time 1, Time 2, and Time 3, respectively, the alphas were .90, .93, and .92 (Family); .87, .90, and .89 (Friends); .89, .90, .90 (School); .84, .87, and .84 (Self); and .85, .87, and .86 (Living Environment).
The test–retest correlation coefficients for the SLSS scores for each of the three time intervals were also calculated (see Table 1). The retest coefficients were .68, .62, and .52 for the 5-month, 7-month, and 1-year time intervals, respectively.
Test–Retest Reliability Coefficients.
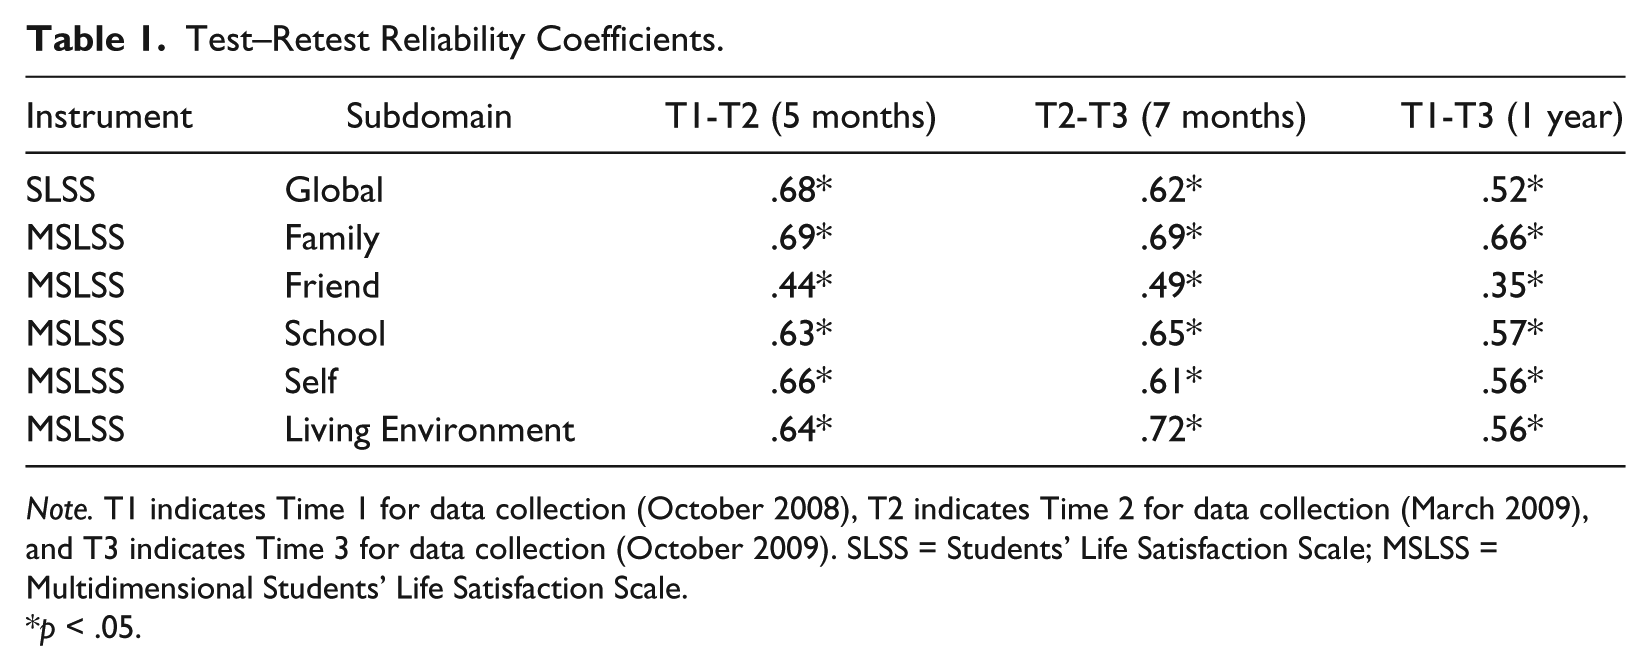
Note. T1 indicates Time 1 for data collection (October 2008), T2 indicates Time 2 for data collection (March 2009), and T3 indicates Time 3 for data collection (October 2009). SLSS = Students’ Life Satisfaction Scale; MSLSS = Multidimensional Students’ Life Satisfaction Scale.
p < .05.
The test–retest coefficients for the MSLSS over the 5-month interval ranged from .44 (Friend) to .69 (Family), with a median coefficient of .64. For the 7-month interval, the retest coefficients for the MSLSS ranged from .49 (Friends) to .72 (Living Environment), with a median coefficient of .65. For the 1-year interval, the retest coefficients for the MSLSS ranged from .35 (Friends) to .66 (Family), with a median coefficient of .56.
The magnitudes of the retest coefficients for the SLSS and MSLSS revealed that all coefficients, with the exception of the Friends domain, were above .50 for the five- and 7-month time periods. For the 1-year time period, the SLSS and MSLSS test–retest coefficients remained above .50, except for the Friends domain. The coefficient for the Friends domain was the lowest coefficient across all three time intervals.
To determine whether the retest coefficients decreased across time, we compared the difference between the 5-month coefficients and the 1-year coefficients. The resulting Fisher’s z-test values for one-tailed tests were 7.39 (Global), 1.59 (Family), 3.10 (Friends), 2.72 (School), 4.63 (Self), and 3.64 (Living Environment). All values for the 1-year time period were significantly lower than the 5-month time period (p < .05), with the exception of the Family domain, which did not show a statistically significant difference (p = .056).
A repeated measures ANOVA was conducted to identify significant differences between scores on the measures across the three administrations. Means and standard deviations are presented in Table 2. For the SLSS, similar responses were found for students in Grade 8 compared with students in Grade 7 (both fall and spring semesters), F(2, 488) = 2.90, p = 0.06, η2 = 0.02. For the MSLSS, a statistically significant difference was found for the Living Environment domain, with adolescent in Grade 8 reporting lower satisfaction compared with students in Grade 7 (both fall and spring semesters), F(2, 500) = 3.42, p = 0.03, η2 = 0.03. Less than 1% of the variance was due to differences in administration occasions.
Means and Standard Deviations According to Administration Occasion.

Note. Means sharing common subscripts are not statistically different according to Tukey procedure. SLSS = Students’ Life Satisfaction Scale; MSLSS = Multidimensional Students’ Life Satisfaction Scale.
p < .05.
Discussion
We addressed the internal consistency and test–retest reliability of two measures of LS for youth, that is, the SLSS and an abbreviated version of the MSLSS. Alpha coefficients of at least .80 were obtained for the SLSS across all three administrations. These estimates were consistent with those estimates reported in previous studies, using a variety of youth samples (e.g., Dew & Huebner, 1994; Gilman & Huebner, 1997; Huebner, 1991; McDougall, Wright, Nichols, & Miller, 2013; Park & Huebner, 2005; Weber et al., 2012) and adult samples (Pavot & Diener, 2008). The current findings regarding the internal consistency of the abbreviated MSLSS were a bit higher than those reported in previous studies with the longer, 40-item version with similar samples (e.g., Antaramian & Huebner, 2009; Gilman et al., 2008; Griffin & Huebner, 2000; Huebner, 1994; Huebner et al., 1998), suggesting higher estimates of internal consistency for the abbreviated version, perhaps because the abbreviated version omitted reverse-keyed items, which may present particular cognitive challenges (i.e., difficulty understanding the items) to children and younger adolescents (Marsh, 1986).
The estimates of the test–retest reliability of these early adolescents’ reports on the SLSS and abbreviated MSLSS also yielded meaningful coefficients. The investigation of test–retest reliability of the SLSS revealed a coefficient of .68 for the 5-month interval, with coefficients of at least .50 across all three administrations, decreasing by about .10 over the time interval of 1 year compared with the 5-month interval. Relative to a study reporting a 4-month retest coefficient on the German SLSS (r = .55; Weber et al., 2012), the 5-month coefficient reported in this study was higher (r = .68). Huebner et al. (2000) previously reported a retest coefficient of .53 after a 1-year time span, which is comparable to that of this study (r = .57). The pattern of decreasing retest correlations is not inconsistent with the summary report of Pavot and Diener (1993), which indicated test–retest coefficients of .84 for 1 month, .64 for 2 months, .50 for 10 weeks, and .54 for 4 years on a widely used measure of global LS with adults.
On the abbreviated MSLSS, the magnitudes of the test–retest coefficients across domains were variable. Although few previous studies have reported retest coefficients beyond a 1-month interval, one study reported coefficients for a 1-year interval (Antaramian & Huebner, 2009), some of which differed from those of this study. On the Family domain, a higher 1-year test–retest coefficient (r = .66) was obtained compared to that of the Antaramian and Huebner (2009) study (r = .48). Furthermore, the current study revealed a 1-year retest coefficient of .56 on the Self subscale compared with the coefficient of .29 reported in the aforementioned study. The differences in findings may relate to the differing samples of the studies; for example, the Antaramian and Huebner (2009) sample contained more female students and more students from a lower SES background. Nevertheless, the differences may also relate to the variations between the abbreviated and lengthier versions of the MSLSS. Future research is needed to evaluate further the comparability of the two versions of the MSLSS.
The lowest test–retest coefficient for the MSLSS in this study was found for the Friends domain of the MSLSS, consistent with the findings of Antaramian and Huebner (2009). Across all three time periods, the test–retest coefficients for the scores on the Friends domain were consistently lower than the coefficients for the other four domains of LS (range of r = .35- .49). This difference is notable, especially given that test–retest coefficients for the other MSLSS domains ranged from .54 to .62. However, given that Barry and Wentzel (2006) and Bowker (2004) have demonstrated that the nature of friendships is typically unstable in early adolescence, the lower test–retest reliabilities for this domain may reflect the more transient nature of early adolescent friendships.
Consistent with expectations, test–retest reliability coefficients for the MSLSS decreased over a year’s span compared with the span of 5 months in middle school students, with the exception of the Family domain, which did not show a statistically significant difference. Nevertheless, with the aforementioned exception of the Friends domain coefficients, the 1-year coefficients all exceeded .50, suggesting moderate stability, yet potential sensitivity to changing life conditions.
We also addressed mean differences across grade levels. Statistically significant differences across grades were observed on the Living Environment domain on the MSLSS. Adolescents’ mean scores on the MSLSS Living Environment domain were significantly lower in the eighth grade relative to the scores on both occasions in the seventh grade, which did not differ. However, the effect size was small. Even so, our findings support previous ones showing that satisfaction with the Living Environment may decrease during periods of adolescence (e.g., Antaramian & Huebner, 2009; Park, 2005). For example, Park (2005) found significant decreases in the MSLSS Living Environment domain when comparing students across the elementary, middle, and high school years. Further research is needed to clarify the meaning of the reported declines in satisfaction regarding adolescents’ neighborhood and community environments.
Given the aforementioned benefits of high LS, interventions for middle school students with low LS may be desirable (Suldo, 2016). Psychometrically sound measures of the components of LS in middle school students are essential in evaluating prevention and intervention efforts related to enhancing students’ LS and other indicators of well-being in middle schools. Given that reliable measurement is a prerequisite to valid measurement, studies of reliability are essential to provide greater understanding of the usefulness of various measures in intervention programs. This study, therefore, provides useful, additional information regarding the reliability of two relatively understudied self-report measures of LS appropriate for adolescents.
A key limitation of the study involves the nature of the sample. Although the sample was relatively large, it was not representative of U.S. youth of this age. Although males and females were represented fairly evenly, it is likely that additional research would be helpful with samples reflecting greater diversity in age, ethnicity, SES, and geographic locale.
Despite its limitations, our study provides important information regarding measurement of LS in adolescents. The results revealed additional support for the adequacy (α > .70) of internal consistency estimates for both the SLSS and abbreviated version of the MSLSS with students in Grades 6 through 8. Furthermore, the findings demonstrated meaningful levels of stability of the scores on both measures over time intervals of 5 months, 7 months, and 1 year. Perhaps with the exception of the Friends domain on the abbreviated version of the MSLSS, the magnitudes and patterns (i.e., decreases across time) of the retest correlations are consistent with the underlying conceptual model of LS, that is, scores on the measures reflect judgments that are somewhat enduring but are also responsive to life changes. Of course, more research is needed to clarify further the sensitivity of the measures to unplanned and planned (e.g., systematic intervention programs) situational changes across varying time periods.
Footnotes
Declaration of Conflicting Interests
The author(s) declared no potential conflicts of interest with respect to the research, authorship, and/or publication of this article.
Funding
The author(s) received no financial support for the research, authorship, and/or publication of this article.