
Abstract
This study examined the psychometric properties of Strengths Knowledge Scale (SKS) and Strengths Use Scale (SUS) in a sample of 442 adolescents by the exploratory structural equation modeling. Correlations between strength use/strength knowledge and flourish, positive affect, negative affect, depression, anxiety, stress, and GPA were examined to illustrate criterion-related validities. Results showed good internal consistency reliability, expected structure factor, and convergent validity of the SKS and the SUS in the current sample.
Introduction
Character strengths are relatively stable and positive patterns of cognition, emotion, and behaviors were manifested by individuals (Peterson & Seligman, 2004). Recently, character strengths were introduced into positive education (Seligman, Ernst, Gillham, Reivich, & Linkins, 2009), for the positive correlation with academic performance and class-related behavior among students (International Positive Education Network, 2016).
Studies demonstrated that characters are positively associated with grade point average (GPA; Lounsbury, Fisher, Levy, & Welsh, 2009). Interventions based on character strengths have been constructed to facilitate the emotional and cognitive development of students. Quinlan, Swain, and Vella-Brodrick (2012) proposed that strengths knowledge and strengths use may be the underlying mechanisms of how strengths-based interventions work and promote individual development. Self-determination theory suggests that both strengths knowledge and strengths use can satisfy the fundamental psychological needs of individuals and hence raise self-motivation and well-being (Ryan & Deci, 2000). Strengths knowledge refers to the awareness and recognition of one’s strengths, and strengths use means using one’s strengths intentionally (Govindji & Linley, 2007). Accordingly, Govindji and Linley (2007) developed the Strengths Knowledge Scale (SKS) and Strengths Use Scale (SUS) to measure the extent of recognizing and using strengths. Both scales show good psychometric characteristics in Western countries (Wood, Linley, Maltby, Kashdan, & Hurling, 2011). However, the situation among adolescents has not been reported in existing literature.
The present study evaluated the psychometric properties of the abovementioned scales by the exploratory structural equation modeling (ESEM). ESEM combines the framework and benefits of exploratory factor analysis, confirmatory factor analysis, and structural equation model (Marsh, Liem, Martin, Morin, & Nagengast, 2011). Compared with confirmatory factor analysis, ESEM has better model–data fit, and more accurate interfactor correlations in the framework (Marsh et al., 2011; Marsh et al., 2013). As positive education and corresponding interventions can promote cognitive and emotional development of students, we hypothesized that strengths knowledge/strength use positively relates to GPA, flourishing, and positive affect (PA), but negatively relates to negative affect (NA) and psychological symptoms.
Method
Participants and Procedures
In all, 226 females and 216 males took part in this study (Mage = 14.67; SD = 1.02; range = 14-17 years old). Among them, 229 students came from five junior high schools, and 213 students came from five high schools. Participants were randomly recruited from February to May 2016. GPA scores were obtained from the school records.
Measures
Strengths knowledge and strengths use were assessed by the eight-item SKS and 14-item SUS (Govindji & Linley, 2007). Both scales were first translated to Chinese by one PhD student, and then backward translated by another. Finally, the Chinese version of the scale were reviewed by three adolescents aged from 15 to 17 to ensure that the items can be correctly understood. The corresponding author of this study considered these modifications and finalized the Chinese version. Responses options range from 1 (strongly disagree) to 7 (strongly agree). High mean scores on each scale indicate a high level of strengths knowledge/strengths use.
Flourishing Scale is an eight-item scale for assessing aspects of human positive functions. Responses options range from 1 (strongly disagree) to 7 (strongly agree). Previous studies have demonstrated the good psychometric characteristics of FS in Chinese adolescents (Duan & Xie, 2016). The coefficient alpha of the scale in the present study was .94.
Positive Affect and Negative Affect Schedule is widely used for measuring PA and NA using two 10-word lists (Watson, Clark, & Tellegen, 1988). Responses options range from 1 (very slightly or not at all) to 5 (very much). The coefficient alphas of the PA and NA subscales in the present study were .87 and .91, respectively.
Depression Anxiety Stress Scale includes three 7-item scales for assessing depression, anxiety, and stress over the past week. Response options range from 0 (did not apply to me at all) to 3 (applied to me very much or most of the time). Previous studies have revealed the good internal consistency and factor structure of the scale among the Chinese (Wang et al., 2016). The coefficient alphas of the Depression, Anxiety, and Stress subscales were .92, .87, and .89, respectively.
Results and Discussion
The ESEM analyses were conducted by Mplus 7.4 with the robust maximum likelihood (MLR) estimation. An initial analysis revealed that the goodness-of-fit indices of the 22-item and two-factor related structure achieved adequate fit (χ2 = 615.342, df = 188, comparative fit index [CFI] = .911, Tucker–Lewis index [TLI] = .891, standardized root mean square residual [SRMR] = .037, root mean square error of approximation [RMSEA] = .072, 90% confidence interval [CI] = [.066, .078]). However, Item 2 showed insignificant loading on the strengths knowledge factor (loading = −0.007), and the modification indices showed a strong residual covariance between Item 10 and Item 11 (Modification Index = 92.98, Expected Parameter Change = 0.278). The reason for the insignificant loading of Item 2 was wording effects which may confound the factor structure of the scale (Ye, 2009). Negatively worded items in the questionnaire will generate wording effects which are affected by age and reading ability (Marsh, 1996). Thus, a revised model that excluded Item 2 and included the residual covariance between Item 10 and Item 11 was constructed. The goodness-of-fit indices of the revised 21-item structure were significantly improved (χ2 = 484.887, df = 168, CFI = .931, TLI = .914, SRMR = .035, RMSEA = .065, 90% CI = [.059, .072]). The standardized factor loadings on SKS ranged from .51 to .93, and that of SUS ranged from .52 to .91. The average variance extracted (AVE) of SKS and SUS are .60 and .61, respectively. The final model also demonstrated good internal consistency reliability for the SKS (ω = .925) and SUS (ω = .959).
The item-rest correlations ranged from .65 to .84. Descriptive statistics and correlations of the strengths knowledge, strengths use, and variables are shown in Table 1. Strengths knowledge and strengths use are positively related to flourishing, PA, and GPA (r = .15 to .66, p < .001), whereas negatively related to NA, depression, anxiety, and stress (r = −.10 to −.32, p < .001). Specifically, strengths knowledge demonstrates stronger correlations to other variables than strengths use, except PA. Multiple regression analysis was conducted to identify the significant contributors to academic achievement.
Descriptive Statistics and Correlations of the SKSU and Other Criteria-Related Variables.
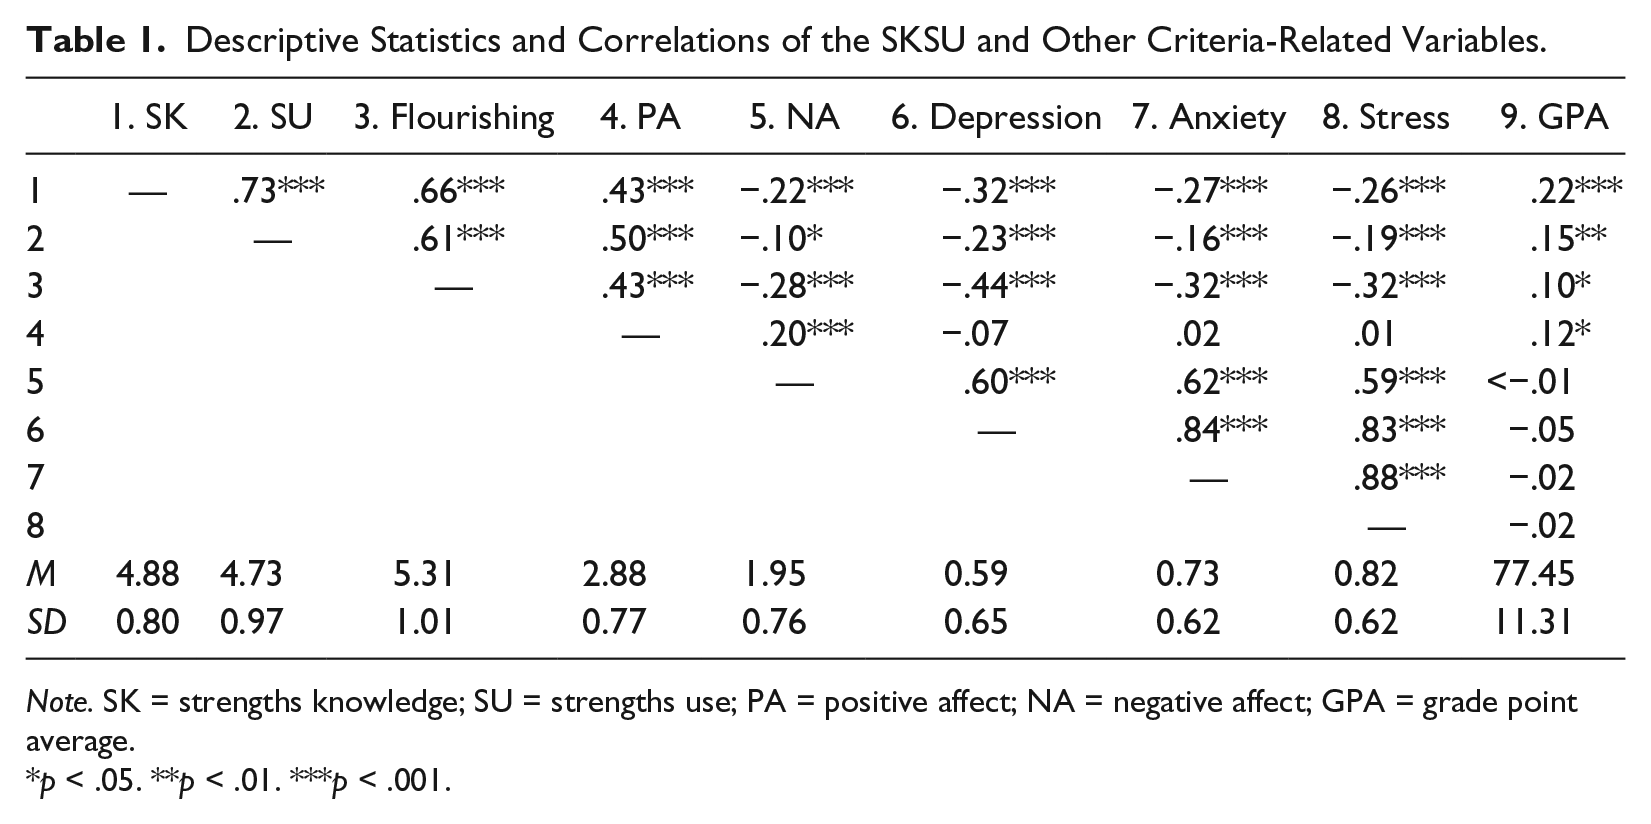
Note. SK = strengths knowledge; SU = strengths use; PA = positive affect; NA = negative affect; GPA = grade point average.
p < .05. **p < .01. ***p < .001.
The results in Table 2 were straightforward. Strengths knowledge was the only significant factor (B = 3.84; t = 3.59, p < .001) in explaining GPA, and the whole model contributed 5.50% (F = 3.11, p < .01) of the variances. These results highlighted the significance of strengths knowledge. However, other studies implied that strengths use was more important than strengths knowledge for well-being. Among our results, the closer association between GPA and strengths knowledge might result from that both of them belong to cognitive aspect (Govindji & Linley, 2007; Richardson, Abraham, & Bond, 2012), while others results might be due to the lack of direct and detailed guidelines on how to use strengths. Future research should be cautious about the guidelines. Also, further studies should be conducted to examine the temporal and causal relationships among strengths knowledge, strengths use, and GPA. Another finding that required further discussion was the positive correlation (r = .20, p < .001) between PA and NA. Watson et al. (1988) assumed that PA and NA were separate and independent constructs in the original mode. However, further studies in different cultures found negative (Jovanović & Gavrilov-Jerković, 2016) or insignificant correlation (Zhang, Diao, & Constance, 2004) between them. These inconsistent results implied that culture might moderate the relationship between PA and NA (Schimmack, 2009). In this study, NA positively associated to depression, anxiety, and stress, whereas PA showed insignificant correlations with them. It might suggest that the Chinese are not good at expressing positive emotions (Diener, Suh, Smith, & Shao, 1995). Accordingly, future studies should incorporate cultural factors in studying the relationship between PA and NA. Finally, the participants were recruited from 10 different schools, but the analyses did not take the sample dependency into consideration. Further studies may adopt multilevel modeling to handle the nesting of students within the classes/schools.
Regression of Psychological Variables on GPA.

Note. O’Brien (2007) suggested that the VIF bigger than 10 indicated the serious multi-collinearity issue of multiple regression model. GPA = grade point average; VIF = variance inflation factor.
p < .01. ***p < .001.
Footnotes
Declaration of Conflicting Interests
The author(s) declared no potential conflicts of interest with respect to the research, authorship, and/or publication of this article.
Funding
The author(s) disclosed receipt of the following financial support for the research, authorship, and/or publication of this article: This study was funded by the Wuhan University Humanities and Social Sciences Academic Development Program for Young Scholars “Sociology of Happiness and Positive Education” (Whu2016019) and Wuhan University Teaching Reform Project “Teaching Quality Evaluation System of Social Work Specialty Based on Competency-based Education Model (CBE)”.