
Abstract
This brief report presents an analog test of the relative classification validity of three cutoff values (CVs; 16, 18, and 20) derived from responses to the self-report version of the Strengths and Difficulties Questionnaire: Total Difficulties Scale. Results from Bayesian t-tests, using several school-specific subjective well-being indicators as dependent variables, yielded evidence suggesting all CV models effectively differentiated between students with lower and higher levels of risk. Evidence also indicated that the lowest CV (16) was more effective than the higher CVs (18, 20) at identifying students with greater levels of risk, and that the higher CVs functioned comparably well. Implications for future research and practice are noted.
The Strengths and Difficulties Questionnaire (SDQ; Goodman, 1997) is probably the most well-researched mental health screener for youth. A recent literature search identified 4,201 publications, conducted across 95 countries, which have used this measure (Youth in Mind, 2017). The SDQ consists of 25 items that comprise five subscales targeting emotional symptoms, conduct problems, hyperactivity, peer problems, and prosocial behavior. The screener can be scored and interpreted at the subscale level or as a composite, which is created by summing responses to the four problem-oriented subscales to make the Total Difficulties Scale (TDS). Research has probed the diagnostic accuracy and other psychometrics of all SDQ scales (e.g., Goodman, 2001), and both the measure and associated scoring guidelines are freely available online (www.sdqinfo.com). Although the SDQ is typically used in schools within single-occasion screening frameworks, it could also feasibly function as the “first gate” within a multiple-gating screening framework (see Walker, Small, Severson, Seeley, & Feil, 2014, for more on this approach). Multiple-gating frameworks are recommended because they improve the diagnostic accuracy of screening results and, in turn, allow school personnel to better prioritize or triage students who have the greatest need for intervention (e.g., Kilgus, Chafouleas, Riley-Tillman, & Welsh, 2012).
Historically, cutoff values (CVs) for all SDQ scales have been provided to facilitate classifying youth according to three risk levels: normal (< 80th percentile), borderline (80-90th percentile), and abnormal (> 90th percentile). But more recently, a four-group classification schema has been recommended, which parses the abnormal category into two subgroups: high (90-95th percentile) and very high (> 95th percentile). Much research has investigated the classification validity of the SDQ CVs associated with the original three-group schema, and other studies have established alternative CVs based on different samples (e.g., Bourdon, Goodman, Rae, Simpson, & Koretz, 2005). However, no research, to date, has probed the relative classification validity of the different CVs designated in the three-group and four-group schemas. Thus, it is unknown if using different SDQ CVs has differential effects for identifying at-risk students. The purpose of the present study was to initiate this line of work, using an analog study to test the relative classification validity of three CVs recommended for the self-report version of the SDQ-TDS: CV = 16 (borderline), CV = 18 (abnormal, high), and CV = 20 (abnormal, very high).
Within the context of the present study, the term classification validity refers to evidence supporting a meaningful differentiation in criterion performance as a function of screening classification. Given the mental health domains targeted by the SDQ, common criterions used in previous research have included more robust measures of these same domains or diagnostic decisions regarding the psychiatric syndromes most closely related to these domains (e.g., Goodman, 2001). Considering the purpose of school mental health screening is not only (or always) to diagnose mental health problems but also (and sometimes only) to identify risk of school performance problems (Dowdy, Ritchey, & Kamphaus, 2010), using school-specific indicators as criterions can likewise lend credence to classification validity. A recent study by Kilgus, Sims, von der Embse, and Taylor (2016) exemplifies this approach, as they probed the classification validity of responses to a teacher-report mental health screener with a variety of school-performance criterions: office discipline referrals, in-school suspensions, out-of-school suspensions, a curriculum-based reading measure, and statewide achievement test scores.
In the present study, the approach used for investigating the classification validity of responses to the SDQ-TDS was likewise grounded in school-specific indicators, not general mental health criterions. Specifically, the criterions of interest were adolescents’ self-reports of school-specific well-being. Taking well-being as a broad construct referring to all manner of healthy and successful human functioning, the term subjective well-being can be understood as self-appraisals of one’s private behaviors (thoughts and feelings) and public behaviors (verbal and physical actions) that are deemed to be personally or socially desirable (Renshaw, 2016). Classification validity was operationalized in this study as effectively differentiating between students with lower and higher levels of student subjective well-being across a variety of indicators that are valued by educators: academic efficacy, school connectedness, joy of learning, and educational purpose (Renshaw, Long, & Cook, 2015). Given the general trend in the literature showing that mental health problems are inversely correlated with student subjective well-being (e.g., Renshaw & Cook, 2018), it was hypothesized that (a) screening models based on all three SDQ-TDS CVs would effectively identify at-risk students (i.e., those with lower levels of student subjective well-being), and that (b) screening models based on higher SDQ-TDS CVs (e.g., 20 vs. 18 vs. 16) would effectively identify students with even greater risk (i.e., those with poorer levels of student subjective well-being).
Method
Participants
Participants were 401 students enrolled in Grades 6 to 7 at a traditional public middle school within an urban school district, located within the southeastern United States. Approximately half of the participants were enrolled in each grade (Grade 7 = 51.87%) and were equally represented by gender (female = 49.58%). The majority identified as Black or African American (> 60%), followed by White (~ 25%), and other/mixed ethnicities (< 15%). Participants completed study measures via a paper-and-pencil administration that was part of preexisting prevention programming sponsored by the school. Data collection procedures were approved by the appropriate ethical review boards, at both the university and school-district levels.
Measures
The screener of interest in the present study was the SDQ-TDS (Goodman, 1997). All items in this measure are arranged along a three-point response scale, representing participants’ agreement with statements of problematic behavior (0 = not true, 1 = somewhat true, 3 = certainly true). Three quarters of SDQ TDS items are directly phrased (e.g., “I am often unhappy, depressed or tearful”), whereas one quarter are indirectly phrased (e.g., “I usually do as I am told”), and thus require reverse-coding. Responses to the SDQ TDS with the present sample were relatively normally distributed (skewness = 0.42, kurtosis = –.12) and characterized by strong internal reliability (α = .80, ω = .80).
The variables tested for classification validity were derived from participants’ concurrent responses to the Student Subjective Wellbeing Questionnaire (SSWQ; Renshaw et al., 2015). The SSWQ is a 16-item self-report instrument comprised of four, four-item subscales: Joy of Learning (JL), School Connectedness (SC), Educational Purpose (EP), and Academic Efficacy (AE). All items are directly phrased to represent the constructs of interest, requiring no reverse-scoring. Subscales can be scored and interpreted at the local level or summed to create the Overall Student Wellbeing Scale (OSW). Further detail regarding the conceptual framework underlying the SSWQ, construct definitions, item content, and related psychometrics, can be found in Renshaw et al. (2015) and Renshaw (2015). The present study used all SSWQ subscales (JL, SC, EP, and AE) as well as its composite scale (OSW) within the validity analyses. Responses to all scales with the present sample were relatively normally distributed (JL skewness = −0.12, kurtosis = −0.55; SC skewness = −0.18, kurtosis = −0.66; EP skewness = −1.15, kurtosis = 1.06; AE skewness = −0.53, kurtosis = 0.01; OSW skewness = −0.43, kurtosis = −0.06) and characterized by at least adequate internal reliability (JL α = .77, ω = .78; SC α = .74, ω = .74; EP α = .71, ω = .72; AE α = .86, ω = .86; OSW α = .87, ω = .87).
The other indicator of student well-being used within the validity analyses was students’ self-reported academic achievement (SRAA), which consisted of a single item adapted from the California Healthy Kids Survey (https://chks.wested.org): “During the past 12 months, how would you describe the grades you received in school?” Response options for this item were arranged along a nine-point scale, with lower responses indicating higher academic achievement (1 = mostly As, 2 = mostly As and Bs, 3 = mostly Bs, . . . 8 = mostly Ds and Fs, 9 = mostly Fs). To enhance the interpretability of this scaling system, responses were transformed into relative GPA estimates prior to data analysis (1 = 4.0 GPA, 2 = 3.5 GPA, 3 = 3.0 GPA, 4 = 2.5 GPA, and so on). Responses to the SRAA item with the present sample were relatively normally distributed (skewness = −0.32, kurtosis = −0.69) and yielded an average estimated GPA of 2.68 (SD = 0.80).
Data Analysis
Analog screening classifications were simulated by creating categorical variables that represented each of the three SDQ-TDS CV models. Following, the relative classification validity of the three CVs was evaluated via three series of Bayesian independent samples t-tests that used the screening classification models (i.e., CV = 16, CV = 18, CV = 20) as the grouping variable and the six aforementioned student subjective well-being indicators as dependent variables (i.e., JL, SC, EP, AE, OSW, and SRAA). All data analyses were conducted using the open-source JASP statistical software (JASP Team, 2018; https://jasp-stats.org).
A Bayesian approach to data analysis was preferred so that results could be interpreted in relation to their direct support (or lack thereof) of the alternative hypotheses proposed above. Using a traditional, frequentist approach would only allow for interpreting the extremeness of the data under the null hypothesis (Jarosz & Wiley, 2014), which was not the analytic aim. A frequentist approach would also not allow for comparing the relative evidence in favor of the hypotheses across models (Wagenmakers, 2007), which was the analytic aim. Thus, Bayes factors were calculated to contrast the probability of the data fitting under the alternative hypothesis with the probability of the data fitting under the null hypothesis (B10). All Bayesian analyses were conducted using JASP’s default prior probability distribution for model parameters. Follow-up robustness checks were also conducted to evaluate the stability of Bayes factors across a range of Cauchy priors (Rouder, Speckman, Sun, Morey, & Iverson, 2009). The relative strength of evidence provided by a given Bayes factor was interpreted using the qualitative guidelines provided within the JASP output: 1-3 = anecdotal, 3-10 = moderate, 10-30 = strong, and 30+ = very strong (JASP Team, 2018). The effect size of posterior distributions was estimated using the median Glass’s δ, which can be interpreted similarly to Cohen’s d: .20-.49 = small, .50–.79 = medium, .80+ = large.
Results and Discussion
Analog classification results for each of the models based on each of three SDQ-TDS CVs are presented in Table 1. All three screening models yielded substantially more negative cases (no-risk) compared with positive cases (at-risk), and the proportion of positive cases substantially decreased (Δ 5-7%) with each increase in the CV (i.e., CV = 16 to CV = 18, CV = 18 to CV = 20). Although particular schools or practitioners may find the proportion of positive cases identified by each of these screening models to be more or less manageable, it is noteworthy that the results are at least similar to those derived from other self-report mental health screeners used with adolescents in schools (e.g., Renshaw & Cook, 2018) and may, therefore, be handled efficiently using multiple-gating screening approaches (Walker et al., 2014) or a serviceable base rate screening heuristic (Kilgus & Eklund, 2016).
Classification Results by CV Model.

Note. CV = cutoff value.
Descriptive statistics for all student subjective well-being indicators are presented by CV model in Table 2. Results from the three series of Bayesian independent samples t-tests are presented by screening model in Table 3. All CV models yielded Bayes factors (alternative/null) indicating very strong evidence in favor of the alternative hypothesis for the SC, AE, and OSW indicators, which were characterized by medium effect sizes. For the other student subjective well-being indicators, the relative strength of evidence for the alterative hypothesis varied across CV models, with effect sizes ranging from small to medium. Bayes factors for EP were anecdotal for CV = 18 and CV = 20, yet moderate for CV = 16. The evidence for JL was moderate for CV = 18 and strong for the other two models. And Bayes factors for SRAA were moderate for CV = 18 and CV = 20, but very strong for CV = 16 (Table 3). Follow-up robustness checks indicated that resulting Bayes factors remained relatively stable across a range of Cauchy priors for all screening models and all student subjective well-being indicators, suggesting confidence in the interpretability of results. (Note: Exact results from these stability analyses are not presented in this brief report, but can be obtained by contacting the author.)
Descriptive Statistics of Student Subjective Well-Being Indicators by CV Model.
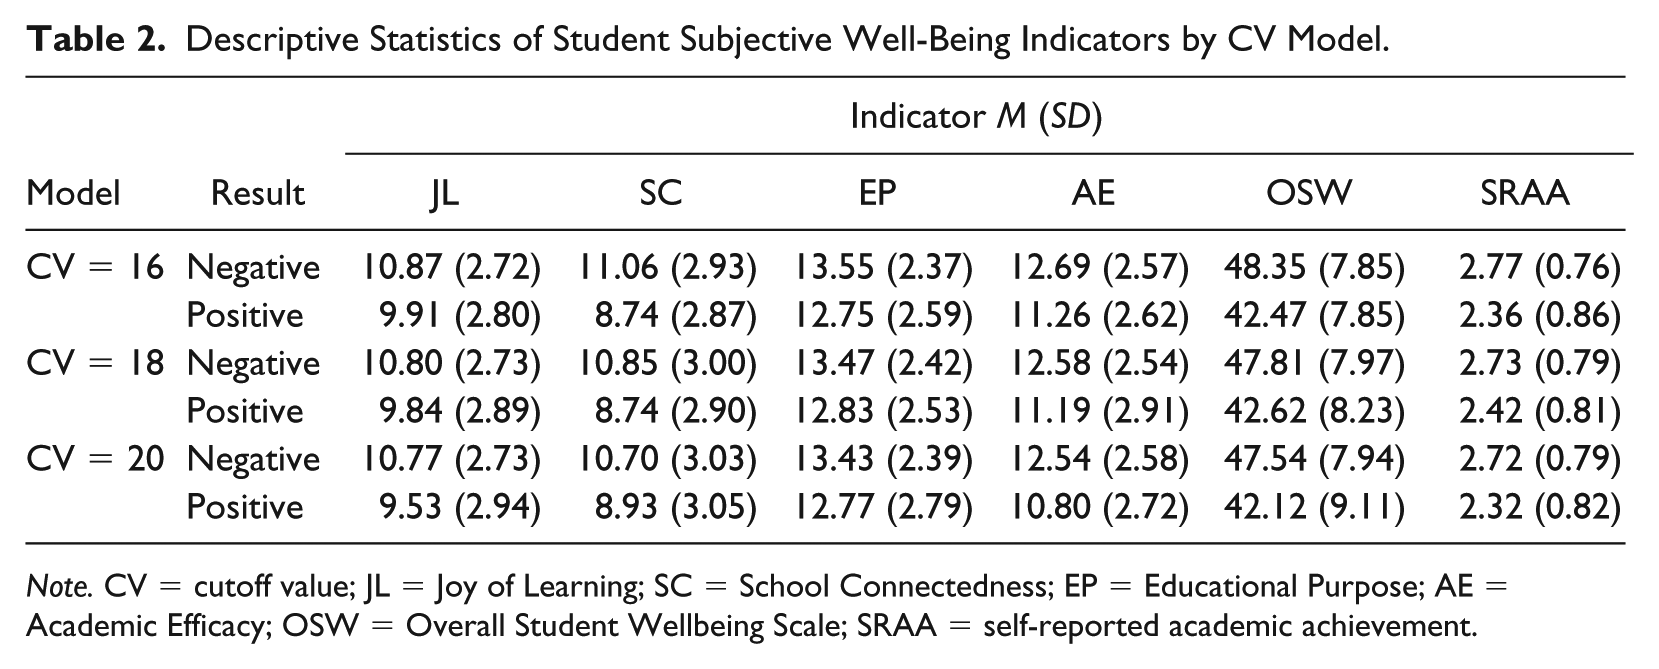
Note. CV = cutoff value; JL = Joy of Learning; SC = School Connectedness; EP = Educational Purpose; AE = Academic Efficacy; OSW = Overall Student Wellbeing Scale; SRAA = self-reported academic achievement.
Results of Bayesian Independent Samples t-Tests by CV Model.
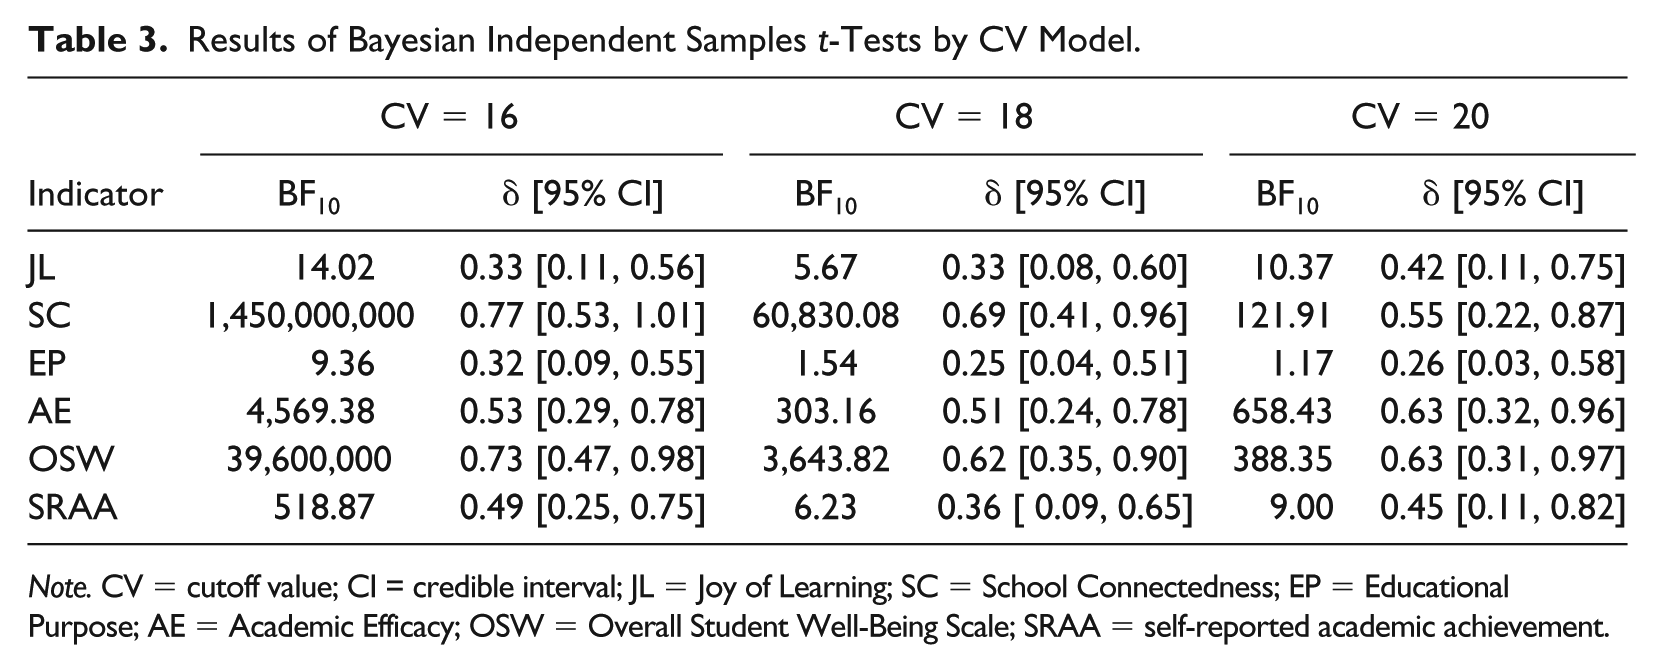
Note. CV = cutoff value; CI = credible interval; JL = Joy of Learning; SC = School Connectedness; EP = Educational Purpose; AE = Academic Efficacy; OSW = Overall Student Well-Being Scale; SRAA = self-reported academic achievement.
Overall, for each student well-being indicator, the relative evidence in favor of the alternative hypothesis appeared strongest for the CV = 16 model. Given several different criterions were tested (i.e., JL, SC, AE, EP, OWS, and SRAA), it seems reasonable to conclude that using this model is likely to identify students with the poorest levels of school-specific well-being. However, it is noteworthy that the CV = 18 and CV = 20 models also functioned relatively well to differentiate among students with lower-and-higher levels of school-specific subjective well-being across most indicators, suggesting they are still likely to be useful (albeit probably less so) for identifying at-risk students in practice. Taken together, then, these findings provide positive support for the first hypothesis—that all SDQ-TDS CVs would demonstrate classification validity. However, they offer evidence contrary to the second hypothesis—that higher CVs would be more effective than lower CVs for identifying students with greater levels of risk. Results actually suggest the opposite: the lowest SDQ-TDS CV model (CV = 16) appears most effective for identifying students with poorer school-specific well-being, across a variety of indicators.
The practical upshot of this analog study is that school-based screening using the SDQ-TDS might favor the CV of 16, as opposed to 18 or 20. Also, the weight of evidence does not seem to favor a definite preference between the two higher CVs (18 and 20). Rather, results suggest both CVs are likely to be similarly useful (yet not as useful as the lower CV) for identifying youth with poorer levels of school-specific subjective well-being. That said, these interpretations and conclusions should be considered tentative, as much more empirical research is needed prior to recommending these findings as a guide for practice. For example, the results observed herein warrant replication within similar study parameters. Generalization studies are also needed to test the consistency of these findings across diverse samples of students and with other valued student outcomes, such as school-reported disciplinary infractions or achievement test scores (cf. Kilgus et al., 2016). Additionally, given the criterion of interest in this study focused on school-specific performance indicators and not general mental health indicators, it is possible that these same SDQ-TDS CV models might perform differently with other kinds of criterions. Direct empirical testing is thus needed to probe these issues. Ultimately, a focused line of research might produce enough quality evidence to inform practice guidelines for effectively using the self-report SDQ-TDS as a school mental health screener. The present study makes an initial contribution toward this potential end.
Footnotes
Declaration of Conflicting Interests
The author(s) declared no potential conflicts of interest with respect to the research, authorship, and/or publication of this article.
Funding
The author(s) received no financial support for the research, authorship, and/or publication of this article.