




Abstract
The Washington Assessment of Risk and Needs of Students (WARNS) is a brief self-report measure designed for schools, courts, and youth service providers to identify student behaviors and contexts related to school truancy. Empirical support for WARNS item invariance between ethnic groups is lacking. This study examined differential item functioning (DIF) to ensure that items on the WARNS function similarly across groups, especially for groups where truancy rates are highest. The item response theory graded response model was used to examine DIF between Caucasian, African American, and Latinx students. DIF was identified in six items across WARNS domains. The DIF amount and magnitude likely will not influence decisions based on total scores. Implications for practice and suggestions for an ecological framework to explain the DIF results are discussed.
Truancy is defined as the number of unexcused absences from school within a designated time period (Sutphen, Ford, & Flaherty, 2010). Truancy is linked to negative social, financial, and psychological outcomes (e.g., Rocque, Jennings, Piquero, Ozkan, & Farrington, 2017). Particularly concerning is the association between truancy and the criminal justice system, with at least 64% state prisons inmates lacking a high school diploma (Curley, 2016), and approximately 92,000 youth arrested on school property between 2011-2012 (U.S. Department of Education, Office for Civil Rights, 2014). Reducing truancy rates, negative trajectories, and implementing interventions and services to support student outcomes is a formidable challenge for researchers, educators, and policymakers (Dembo & Gulledge, 2009).
Rates in which truancy impacts student outcomes vary by social and cultural groups, with an overrepresentation of low socioeconomic status (SES) and minority-status students with disciplinary consequences which keep students out of classrooms (Fenning & Rose, 2007; Gardner & Martin, 2018). Of particular concern is the disparity in discipline rates among African Americans students in exclusionary and punitive consequences (Skiba et al., 2011) and rate of office referrals (Skiba, Michael, Nardo, & Peterson, 2002), both positively related to truancy rates. Washington, the context of this study, has the second highest rate of chronic truancy in the nation (Rowe, 2017). Thus, state policymakers and practitioners have focused on early-warning indicators such as truancy and associated behaviors to support student outcomes. Such indicators may be informed by evidence-based resources including risk assessments (Mendoza, Rose, Geiger, & Cash, 2016).
The Washington Assessment of Risk and Needs of Students (WARNS) is an instrument used by state service providers, courts, and schools for information about maladaptive behaviors and needs of youth aged 13 to 18 years (George et al., 2015). Scores are used to target appropriate interventions for students who indicate risk for behaviors linked to truancy and delinquency. Given score use and race/ethnic differences in truancy and related behaviors, providing score validation evidence is essential for measures such as WARNS (American Educational Research Association, American Psychological Association, & National Council on Measurement in Education, 2014; Kane, 2013). Some validity evidence does exist for the WARNS including internal factor structure (e.g., Strand, Gotch, French, & Beaver, 2017) and latent profiles of risk and needs (e.g., Iverson, French, Strand, Gotch, & McCurley, 2016), yet there lacks evidence of item invariance across groups for which the instrument is widely used. Differential item functioning (DIF) refers to when the probability of endorsing a certain item response is unequal for different groups who possess the same ability level (Zumbo, 1999). DIF can introduce systematic bias and reduce test score validity (Kane, 2013). To safeguard against biased decision-making from WARNS scores, DIF was evaluated within a scoring inference using Kane’s (2013) validity argument framework, as “scoring procedures are appropriate, are applied as intended, and are free of overt bias” (p. 25) are assumptions for this inference. This validity lens is used to evaluate DIF evidence, which can support a fairness aspect of a scoring inference in building a validity argument. However, we remind the reader that the scoring inference examined across three groups alone cannot support all fairness claims about WARNS scores.
Method
Participants
Washington and Georgia state students (N = 1,468, 52% male), aged 13 to 18 years, completed the WARNS as standard practice in their schools during the 2017-2018 academic year. Data were collected via the online WARNS System, where a counselor or school administrator was present during administration, averaging 13 minutes. The ethnic background of students was Latinx (40.7%), followed by Caucasian (36.4%) and African American (22.9%). Of the students, 83.6% were from Washington and 16.4% were from Georgia, where Washington schools used WARNS routinely, and the Georgia district was in a first year of implementation of the assessment. In both cases, WARNS results are used for conversations with the student and parents and an information point in offering services and interventions.
Instrument
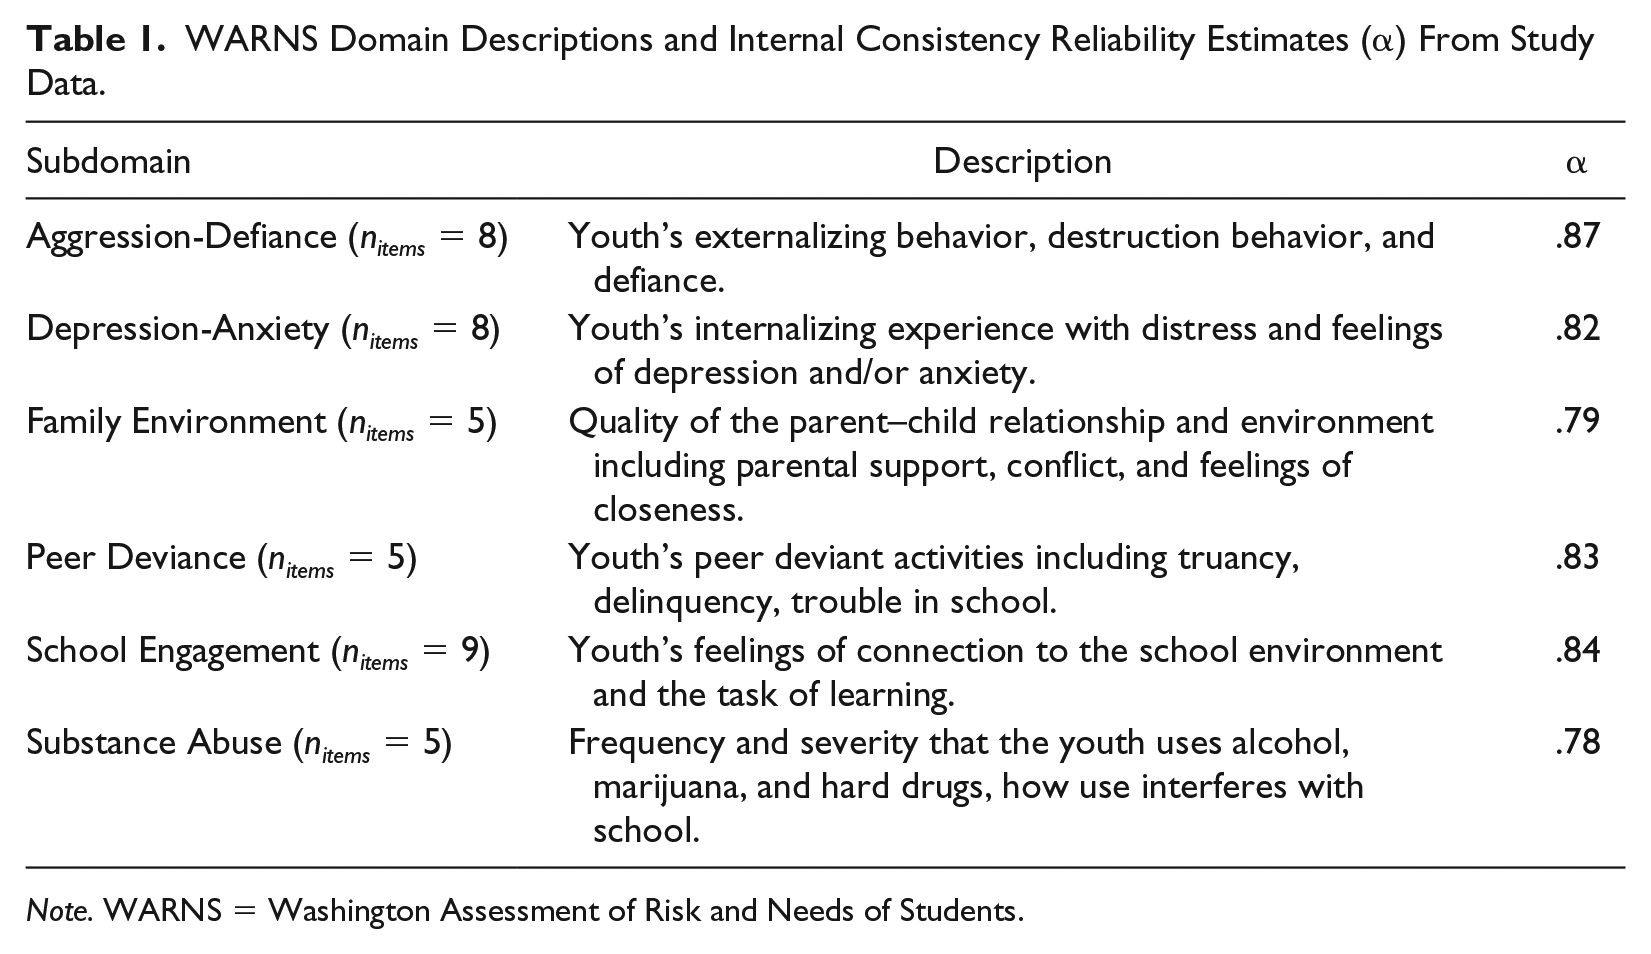
The WARNS (George et al., 2015) is a self-report, 40-item measure consisting of six subdomains. Each subdomain measured a student’s reflection of a thought, behavior, or emotion, in the past 2 months using a rating scale from 0 = Never or Almost Never, 1 = Sometimes, 2 = Often, and 3 = Always or Almost Always. See Table 1 for subdomain descriptions and internal consistency reliability estimates for this sample, which ranged from .78 to .87. The manual (George et al., 2015) provides internal structure evidence of a bifactor model for a general risk and needs factor, and six specific factors as well as high correlations with similar measures (<.70) such as the Problem Oriented Screening Instrument for Teenagers (POSIT; Rahdert, 1991).
WARNS Domain Descriptions and Internal Consistency Reliability Estimates (α) From Study Data.
Note. WARNS = Washington Assessment of Risk and Needs of Students.
Analysis
An item response theory (IRT) graded response model (Samejima, 1969) was employed for each subdomain. Step 1 involved an iterative process to identify a purified anchor set of items for accurate matching of ability level (e.g., French & Maller, 2007). In Step 2, DIF was identified using the χ2 test of significance for total DIF, a-parameter DIF (i.e., slope), and b-parameter (i.e., k’–’1 thresholds) DIF at the significance level of p < .01. In Step 3, items displaying DIF were categorized based on effect sizes and statistical significance, where .40 = small, .60 = moderate, and .80 = large areas between the item characteristic curve (ICC; Raju, 1988), representing the magnitude of DIF (Steinberg & Thissen, 2006).
Results and Discussion
Across all WARNS items, six (15%) items showed a large DIF effect size. Tables 2 to 4 contain the parameter estimates for the DIF items by group and by subdomain. For the Aggression-Defiance subdomain (Table 2), three DIF items were identified. When examining b-parameters, large effect sizes across groups ranged from 0.93 to 1.41, where African American students were more likely to endorse the Fights item, compared to their counterparts. See ICC in Figure 1. In the Family Environment subdomain, the item Argue showed differences between the African American and Caucasian group, with the latter having a greater item discrimination value compared to the former group, and a medium effect size (0.72; see Table 3; Figure 1 for ICC). Differences across groups on the b-parameters ranged from moderate (0.48) to large (2.61) effects. A single large b-DIF item was identified in the Peer Deviance subdomain (i.e., FrFights; Table 3), where African American students were more likely to endorse the item compared to Caucasian students, with moderate (0.60) to large (0.85) effect. In the subdomain of School Engagement, one DIF item was identified (i.e., HWComplete; Table 4), where b-parameter comparisons revealed effect sizes ranging from small (0.38) to large (1.03). The subdomains of Substance Abuse and Depression and Anxiety indicated no DIF items.
DIF Parameter Estimates for the Aggression-Defiance Subdomain by Group.
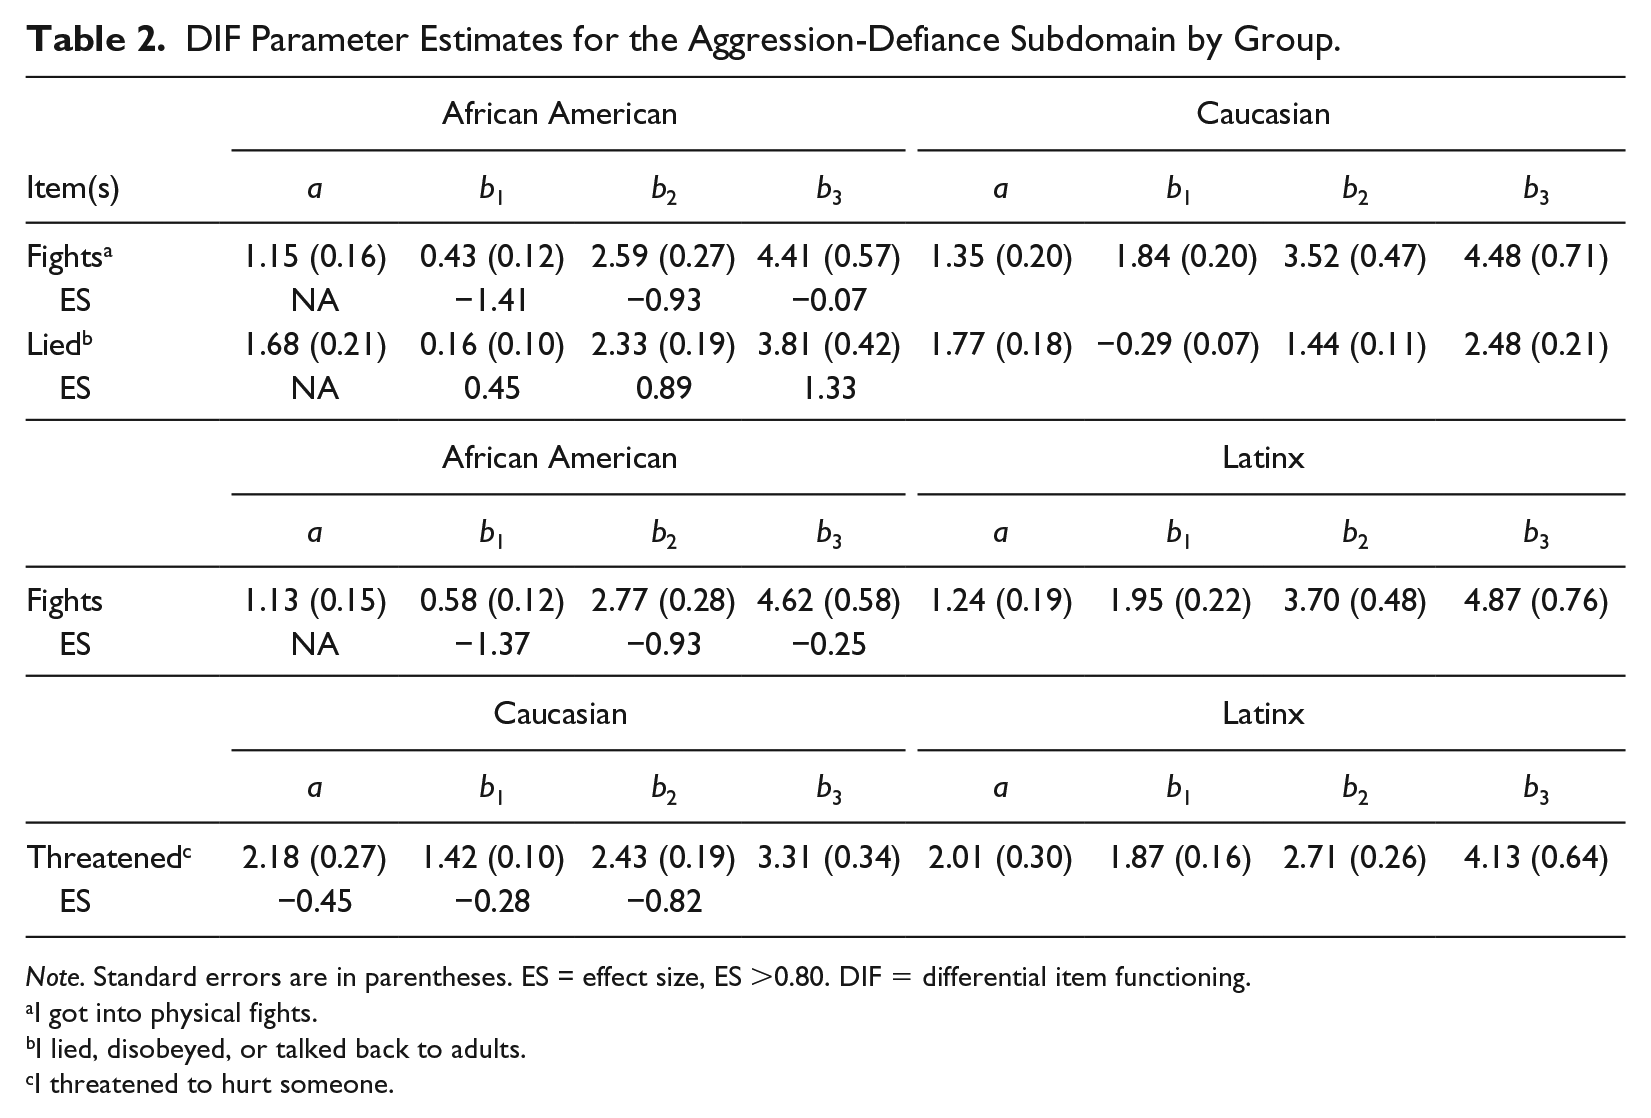
Note. Standard errors are in parentheses. ES = effect size, ES >0.80. DIF = differential item functioning.
I got into physical fights.
I lied, disobeyed, or talked back to adults.
I threatened to hurt someone.
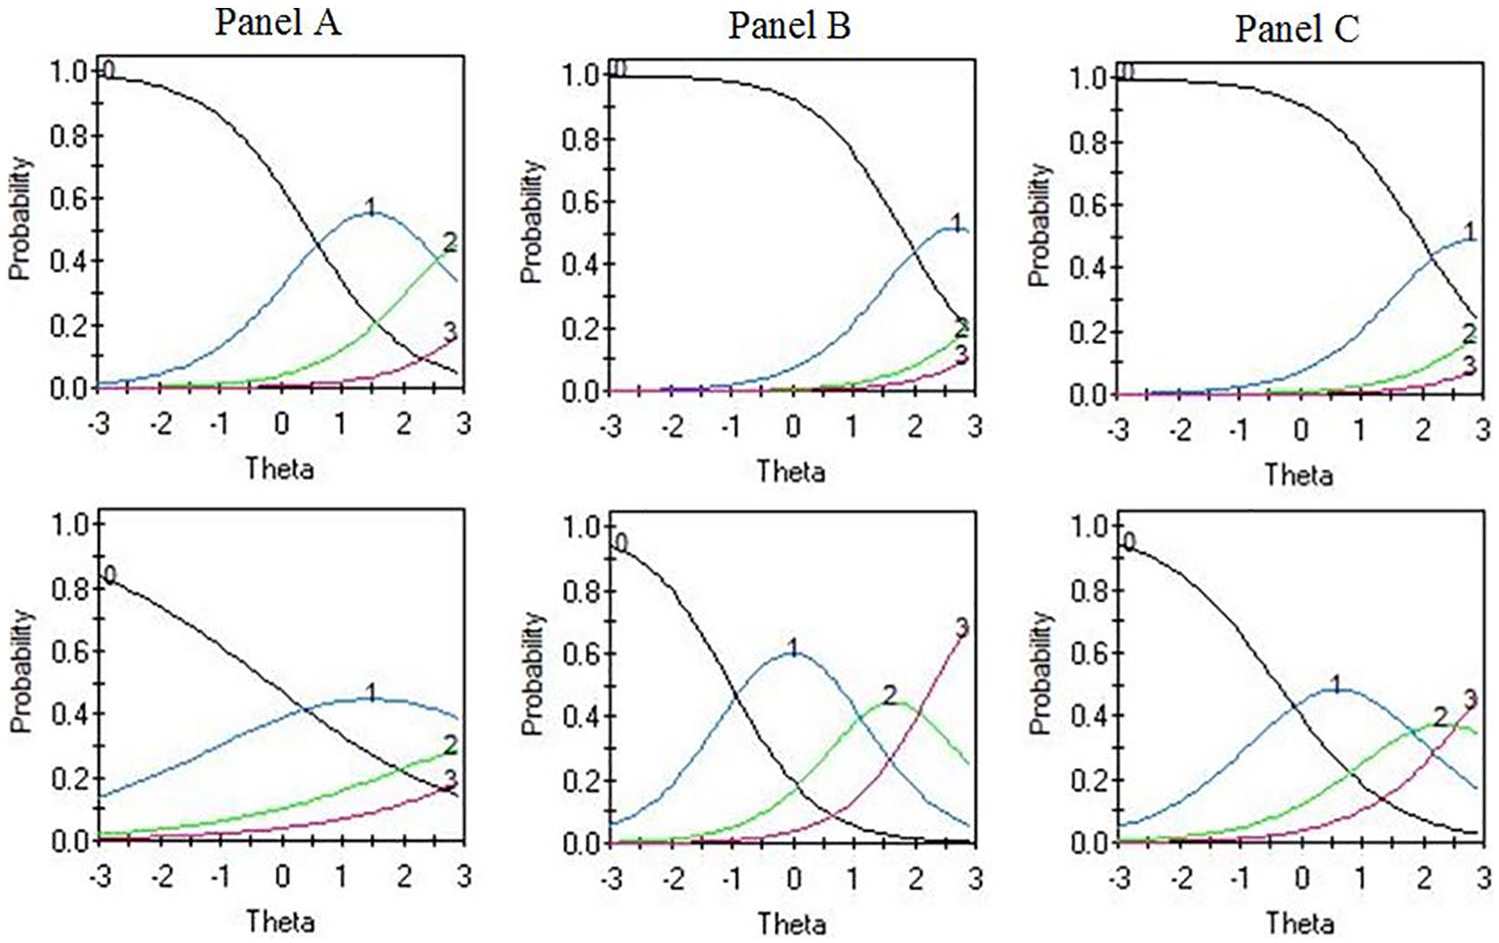
Item characteristic curves for African American (Panel A), Caucasian (Panel B), and Latinx (Panel C) groups for item “I got into physical fights” of the aggression-defiance subdomain (top row) and item “I got into arguments with my parents” of the Family Environment subdomain (bottom row).
DIF Parameter Estimates for the Family Environment and Peer Deviance Subdomain by Group.

Note. Standard errors are in parentheses. ES = effect size; ES >0.80. DIF = differential item functioning.
I got into arguments with my parents.
My friends got into physical fights.
DIF Parameter Estimates for the School Engagement Subdomain by Group.
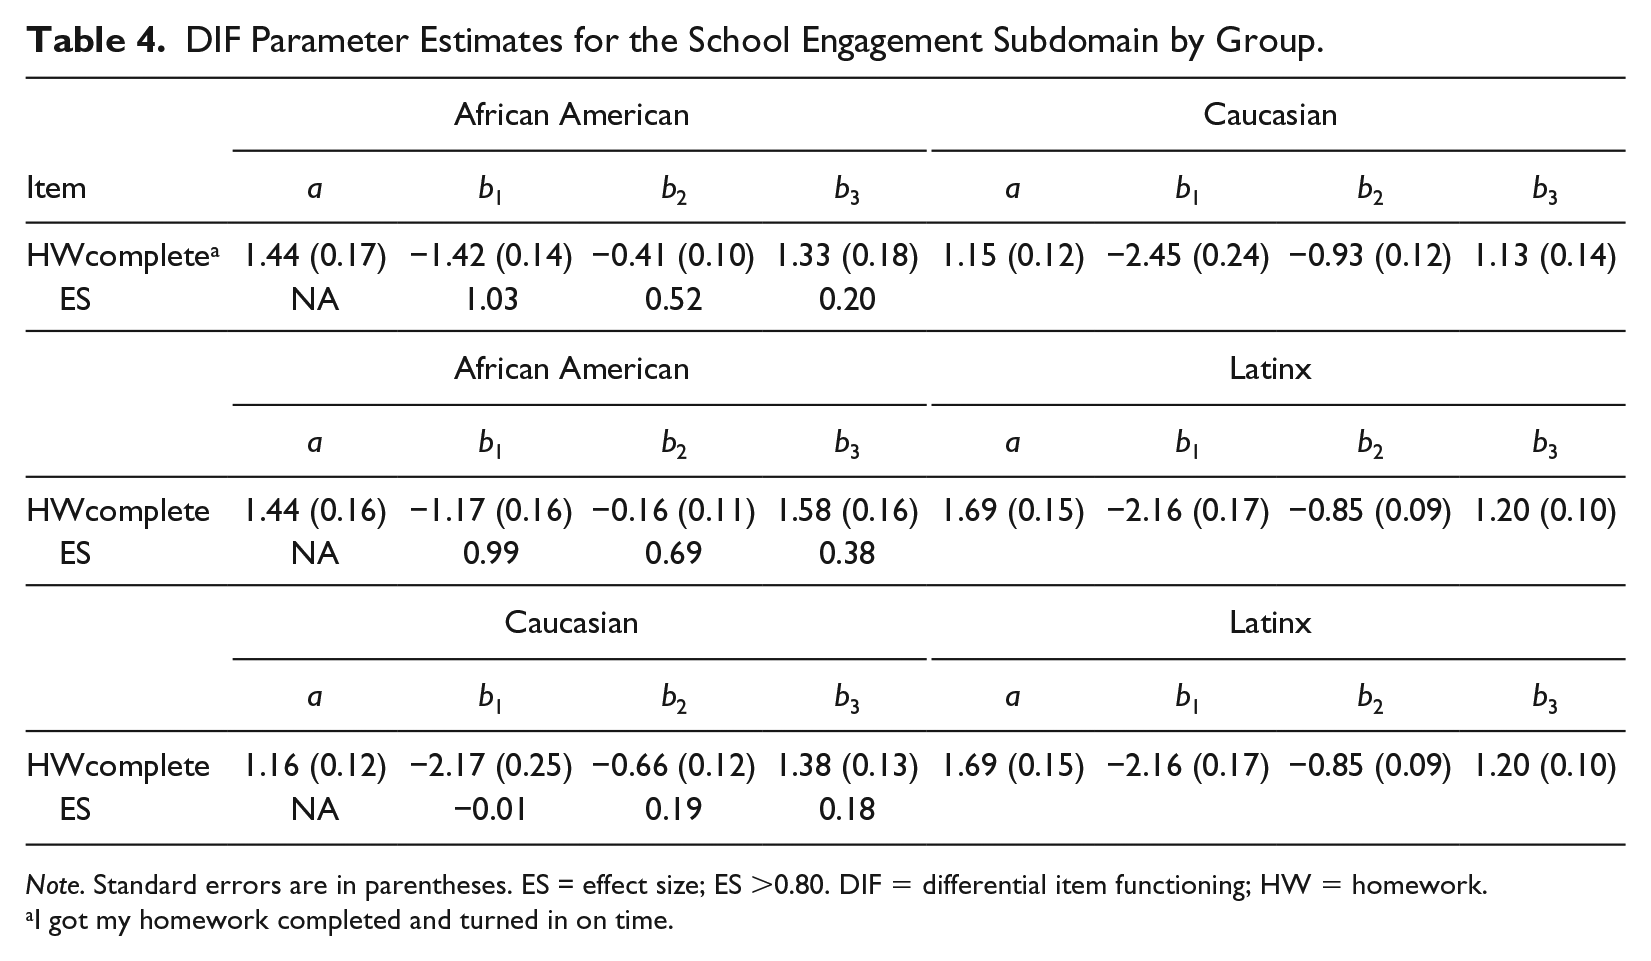
Note. Standard errors are in parentheses. ES = effect size; ES >0.80. DIF = differential item functioning; HW = homework.
I got my homework completed and turned in on time.
Results indicated that 6% of comparisons identified large DIF effects between groups. These DIF rates fall within the 5% and 10% commonly found with race and gender (Miller & Oshima, 1992). The main implication for practice for these groups is that the minor level of DIF spread across subdomains may not likely change individual decisions made with WARNS scores, although this requires additional empirical evidence to confirm. Nevertheless, these results generally support a scoring inference (Kane, 2013) where overt bias is minimized across the 120 group comparisons.
That said, the differences found with respect to the African American sample push DIF analyses in a different direction. This study’s convenience sample of African American students from a charter school in Georgia comprised students who do not fit into the regular school system (e.g., credit deficient, high truancy problems). Thus, differences between the Georgia–Washington school settings may contribute to why 87% of DIF items impacted the African American group. The context in which WARNS subdomains are measured may be overlooked in this study (Anastasi, 1993). Future research should explore how the sociocultural environment of an individual can help uncover how behaviors manifest differently depending on the student’s context (Bronfenbrenner, 1997; John-Steiner & Mahn, 1996). Pursuing an ecological DIF framework to understand how context may explain DIF across groups (Zumbo et al., 2015). It may be informative to take a multilevel modeling DIF framework (Shear, 2018). The use of school or contextual level variables (e.g., school truancy and discipline rates) may assist with exploring whether differences are related to a simple dichotomous category classification (e.g., race/ethnicity) or more complex sociocultural or contextual variables.
Footnotes
Declaration of Conflicting Interests
The author(s) declared no potential conflicts of interest with respect to the research, authorship, and/or publication of this article.
Funding
The author(s) received no financial support for the research, authorship, and/or publication of this article.
